Introduction
In the past 30 years, understanding biodiversity patterns and identifying priority areas for conservation have become important areas of focus for conservation science (Margules & Pressey Reference Margules and Pressey2000). Understanding where the most important areas for biodiversity are located can help us to allocate limited conservation resources more effectively (Orme et al. Reference Orme, Davies, Burgess, Eigenbrod, Pickup and Olson2005). Much of the work to understand large-scale biodiversity patterns has used species richness (Ceballos & Ehrlich Reference Ceballos and Ehrlich2006); however, prioritization approaches based on species richness do not always lead to the highest coverage of species in protected area (PA) networks (Beier & Albuquerque Reference Beier and de Albuquerque2015). Identifying priority areas for conservation using species richness produces a lower coverage of species than identifying priority areas based on complementarity methods and using species range maps (Veach et al. Reference Veach, Di Minin, Pouzols and Moilanen2017). Thus, it is now generally recognized that complementarity-based site selection methods (i.e., those that take into account both the biological attributes of sites and inter-site similarities) deliver greater overall conservation efficiency than scoring-based approaches that simply treat candidate sites as unrelated entities (Moilanen et al. Reference Moilanen, Wilson, Possingham and Regan2009).
There is a pressing need to understand where best to locate future PAs in order to maximize effectiveness and feasibility for biodiversity conservation (Yang et al. Reference Yang, Cao, Hou, Peng, Wang and Wang2020). The identified networks invariably include areas closer to key socioeconomic areas (i.e., cities and farmland), or those with poor ecological conditions would require greater restoration costs than wilderness areas with lower levels of human impact. Several studies indicate that minimizing human disturbance could enhance the biodiversity conservation effectiveness of newly designated PAs (Jacobson et al. Reference Jacobson, Riggio, Tait and Baillie2019, Kennedy et al. Reference Kennedy, Oakleaf, Theobald, Baruch-Mordo and Kiesecker2019). Therefore, a spatial socioeconomic cost estimation and condition assessment would support decision-making and enable a more cost-effective allocation of economic resources for conservation prioritization.
The karst area of southwest China (KASC) is the largest piece of karst landscape on Earth and a global biodiversity hotspot containing many endemic species (Myers et al. Reference Myers, Mittermeier, Mittermeier, da Fonseca and Kent2000, Luo et al. Reference Luo, Tang, Jiang, Chen, Fang and Li2016). Since 2000, KASC PA coverage has gradually increased (UNEP-WCMC et al. 2021); however, biodiversity continues to be lost at an alarming rate (Pimm et al. Reference Pimm, Jenkins, Abell, Brooks, Gittleman and Joppa2014, Yang et al. Reference Yang, Cao, Hou, Peng, Wang and Wang2020). PAs in the region are mostly ineffective, isolated from other PAs and immersed within a degraded or unproductive matrix (Carvalho et al. Reference Carvalho, Brown, Gordon, Yesuf, Raherilalao and Raselimanana2020). Without comprehensive planning and given the disjointed PA categories (Xu et al. Reference Xu, Pimm, Du, Su, Fan and An2019), the current PA network fails to adequately represent regional biodiversity and suffers from fragmented management. Short-term economic interests such as tourism or recreation returns have prevailed over conservation objectives. The current PAs have historically been relegated to the status of ‘residual places’ (Ouyang et al. Reference Ouyang, Xu, Du, Lei, Zhu and Chen2018). KASC conservation planning has experienced some shortcomings, such as a lack of an accurate and standardized procedures to select species and define species’ distributions, as well as the use of an outdated methodology for the selection of priority areas.
Identifying the gaps in PAs in China occurs mainly at the large administrative and mountainous scales (Su et al. Reference Su, Han, Liu, Zhang and Lu2019, Zhang et al. Reference Zhang, Gheyret, Chi, Bai, Zheng and Tang2020). However, karst aquifer systems are connected over large areas and constitute transboundary groundwater resources. In particular, PAs created to protect terrestrial features have failed to recognize the off-site threats (e.g., water pollution and water yield reduction) caused by activities such as land clearance or farming in the upstream catchment (Wang et al. Reference Wang, Zhou, Hou, Tan, Li and Feng2018), reflecting the particular vulnerabilities created by the longitudinal connectivity (Leathwick et al. Reference Leathwick, Moilanen, Ferrier and Julian2010). One analysis of PAs for freshwater systems with hydrological connectivity addressed this problem simply by requiring protection of the entire catchment upstream of any particular site of interest (Zhang et al. Reference Zhang, Xu, Ouyang and Zhu2014). Hydrological connectivity is important for maintaining wildlife habitats and global biogeochemical cycling (Cui et al. Reference Cui, Xiao, Zhang, Wang, Ma and Xiu2020). Previous research has shown that the importance of river connections and ecological integrity can be recognized by grouping river segments into catchment-based planning units (Moilanen et al. Reference Moilanen, Anderson, Eigenbrod, Heinemeyer, Roy and Gillings2011a). Selecting catchments as a grid can also facilitate conservation management (Nhancale & Smith Reference Nhancale and Smith2011). More research needs to be done on optimizing and evaluating on-site conservation at the watershed scale based on hydrological connectivity (Fan et al. Reference Fan, Shibata and Chen2018).
Thus, the conservation planning principles of complementarity, cost-effectiveness and catchment-based connectivity have been introduced into PA expansion practices to provide a pragmatic basis for conserving biodiversity in rapidly changing, fragmented landscapes under pressure from land degradation. The main aims of this study were: (1) to determine the representativeness of the existing PA network in the region; (2) to determine the degree of interference from human exploitation and the trend of habitat degradation over the past 20 years; and (3) to consider how more adequate and representative conservation areas for key species might be expanded and prioritized under scenarios of ecological integrity prioritization (Scenario 1) and the inclusion of socioeconomic costs (Scenario 2).
Methods
Study area
The Zhangjiang River Basin covers an area of 1673.9 km2 and is the richest species region and most famous tourist spot within the KASC PA system. The main river, the Zhangjiang, originates from Yueliang (Moon) Mountain and flows from northeast to southwest, spreading in a fan shape (Fig. 1). This river basin is an important ecological barrier at the upper reaches of the Yangtze (the longest river in Asia) and the Pearl (the third longest river in China). Existing PAs are the Zhangjiang National Scenic Area, the Maolan National Nature Reserve (a karst landscape forest) and three county-level nature reserves. Nevertheless, in spite of the above problems and the urgency of the subject, little is known about the priority conservation areas of the Zhangjiang River Basin, and even less is known about the efficiency of the PA network in this threatened biodiversity hotspot.

Fig. 1. (a) Distribution of ecological degradation conditions from 2000 to 2016 and (b) distribution of the cost layer for each catchment unit of the Zhangjiang River Basin, where the higher the human disturbance index, the higher the spatial socioeconomic cost of protecting the particular site. The coloured condition values range between 0.0 (completely degraded) and 1.0 (pristine).
Setting conservation features and targets
A representative PA network should guarantee the survival and viability of key species and ecological and evolutionary processes. Thus, the biodiversity conservation feature consisted of 46 key species according to the list of ‘national key protected wildlife species’ (NKPWAS, Category I and Category II) and ‘provincial key protected wildlife species’ (see Supplementary Appendix S1 & Table S1, available online).
Our target was to identify areas that would best complement the already existing conservation area network within the river basin for target species. There is overwhelming agreement that Aichi Target 11 is not adequate to conserve biodiversity (Woodley et al. Reference Woodley, Bhola, Maney and Locke2019). Optimizing the total PA coverage means increasing it to 30%, with at least 10% of the total land area under strict protection by 2030 according to the Post-2020 Global Biodiversity Framework under the Convention on Biological Diversity (CBD 2020). We classified the top 10% and top 20% of landscapes corresponding to high- and medium-ranked PAs, respectively. The top 30% correspond to the post-2020 global biodiversity framework target.
Species distributions
The spatial distribution of each species was determined using species distribution models, which spatially link key species’ occurrences with maps of environmental variables (elevation, soil type, vegetation type, land-use type, etc.) and provide continuous mapped predictions of habitat suitability (Li et al. Reference Li, Xiong and Wu2013, Snäll et al. Reference Snäll, Lehtomäki, Arponen, Elith and Moilanen2016). The associated biodiversity feature data, such as environmental variables and records of animal and plant species, are listed in Table S2, and site fieldwork was also conducted from September 2017 to January 2018 and in April 2019 in order to verify this information.
Spatial conservation prioritization
The conservation planning software Zonation 4GUI was used to create a hierarchical ranking system starting from the full landscape and generating a priority ranking system by iteratively ranking and removing the grid cells in the order that causes the least loss in aggregate conservation value (Moilanen et al. Reference Moilanen, Pouzols, Meller and Veach2014). The Zonation 4GUI input files with data sources and methods are listed in Table S2. The primary focus of spatial conservation prioritization is on the quality of the new areas and the overall connectivity of the conservation area network.
Complementarity exists when an area has at least some biodiversity features (species in the current context) that are unrepresented in some other area with which the area is being compared (Williams et al. Reference Williams, Faith, Manne, Sechrest and Preston2006). Maximizing complementarity allows important areas for conservation to be identified that can add as much biodiversity as possible to a plan. Therefore, the cell removal rule we used was core-area zonation (CAZ), which places emphasis on protecting the highest-quality areas for all key species. When a part of a feature’s distribution is removed, the proportion located in each remaining cell increases. This means that Zonation 4GUI tries to retain core areas of all species until the end of cell removal, even if the feature is initially widespread and common.
Conservation weights
Weighting lowers the contribution of wide-ranging species and highlights the areas that have a relatively high proportion of narrow-range species (Moilanen et al. Reference Moilanen, Leathwick and Quinn2011b). First, we assigned a weight to each species within each taxon based on a multiplicative and additive component (i.e., per-species weight components) in the Zonation 4GUI algorithm (Appendix S1; Lehtomaki & Moilanen Reference Lehtomäki and Moilanen2013). Factors that best fit the multiplicative component include International Union for Conservation of Nature (IUCN) Red List status (
 $${M_{endangered}}$$
: least concern = 1, near threatened = 2, vulnerable = 4, endangered = 6, critically endangered = 8, data deficient = 2) and the endemicity of a species (
$${M_{endangered}}$$
: least concern = 1, near threatened = 2, vulnerable = 4, endangered = 6, critically endangered = 8, data deficient = 2) and the endemicity of a species (
 $${M_{endemicity}}$$
: non-endemic = 1, China endemic = 4, KASC endemic = 8). The weight component that is not obviously multiplicative is a candidate for the additive component. These include factors such as the economic value of a species. Economic value might include being used for medicines and pigments or as a source of potherbs, oils, fibre, nectar or spices (species with five kinds of the value or more = 8, four kinds of the value = 6, three kinds of the value = 4, one or two kinds of the value = 2, no economic value = 1). The initial relative weight of species j becomes:
$${M_{endemicity}}$$
: non-endemic = 1, China endemic = 4, KASC endemic = 8). The weight component that is not obviously multiplicative is a candidate for the additive component. These include factors such as the economic value of a species. Economic value might include being used for medicines and pigments or as a source of potherbs, oils, fibre, nectar or spices (species with five kinds of the value or more = 8, four kinds of the value = 6, three kinds of the value = 4, one or two kinds of the value = 2, no economic value = 1). The initial relative weight of species j becomes:
 $$r_j^b = {M_{endangered}} \times {M_{endemicity}} \times {A_{economic}}$$
Our second step was to reflect the aggregate characteristics of each taxon (Table 1). We complemented the taxon-specific weighting with weight components reflecting the relative importance of the taxon to overall ecosystem functioning (ESF: plants = 3, amphibians = 0, birds = 1, mammals = 2), ecosystem services provided (ESS: plants = 6, amphibians = 0, birds = 1, mammals = 1) and overall number of species in the group (NSP: plants = 3, amphibians = 0, birds = 1, mammals = 0) (Appendix S1). These weight components were then summed to form the aggregate weight for
 $${W_b}$$
:
$${W_b}$$
:
 $${W_b} = 1 + ES{F_b} + ES{S_b} + NS{P_b}$$
Table 1. Aggregate group weights for each taxon.

The weight
 $$W_j^b$$
of species j in taxon b was then obtained by setting:
$$W_j^b$$
of species j in taxon b was then obtained by setting:
 $$W_j^b = \frac{{{r_j^b \times {W_b}}}\over{{\mathop \sum \nolimits_{i = 1}^{{N_b}} r_j^b}}$$
Planning unit
We adopted catchment-based units as the planning units to highlight the integrity of the ecosystem structure and the continuity between upstream and downstream portions of the basin. This approach conforms to the natural distribution characteristics of the conservation targets and maintains the natural similarity between the protected habitat and the landform unit. The ArcGIS Hydrology tool was used to establish the planning units, which included a total of 1421 catchments (Fig. S1).
Ecological condition
Land-use change, habitat loss and degradation may lower the conservation value of sites (Moilanen et al. Reference Moilanen, Wilson, Possingham and Regan2009). We added a proxy for ecological condition into the analysis by using the net primary productivity (NPP) of vegetation, which helps to characterize the ecological quality and is an important parameter for evaluating the functional characteristics of an ecosystem (Fu et al. Reference Fu, Lü, Harris, Comber and Wu2018). We used simple linear fitting to quantify the multi-annual change trends of NPP from 2000 to 2016 as a condition layer in Zonation 4GUI; that is, as a proxy layer indicating ecological condition from fully lost (0) to pristine (1). The data were calculated using the Carnegie–Ames–Stanford approach (CASA) model (Potter et al. Reference Potter, Randerson, Field, Matson, Vitousek, Mooney and Klooster1993).
Socioeconomic cost
The cost layer is an optional input file in Zonation 4GUI under land cost consideration. We added a proxy (human disturbance index (HDI)) for spatial socioeconomic cost and directed the conservation plan towards the least-cost areas. The HDI considered the socioeconomic activities on land, including 10 variables covering five aspects of land cost at our site. The five aspects were transportation infrastructure, settlement, farmland, mines and hydroelectric stations (Fig. S1). The weights for the five aspects were assigned by an expert panel with the values of 1, 5, 2, 5 and 20, respectively, based on their cost of ecological compensation and the cutting-off effects on hydrological connectivity generally (Table 2). The HDI was calculated by summing up the following variables within a planning unit: the ratio of the length of roads and railways; the proportion of urbanized area; the density of rural residents; the proportion of farmland; the density of mining sites; and the density of hydroelectric dams and stations. Therefore, the HDI value in each catchment was calculated as follows:
 $$C = \mathop \sum \limits_{j = 1}^n \left( {\frac{{{V_i} - {V_{i,min}}}}\over{{{V_{i,max}} - {V_{i,min}}}}}{W_i}} \right)$$
where
 $${V_i}$$
is the value of variable
$${V_i}$$
is the value of variable
 $$i$$
in each planning unit and
$$i$$
in each planning unit and
 $${W_i}$$
is the weight of variable
$${W_i}$$
is the weight of variable
 $$i$$
.
$$i$$
.
 $$j$$
is the number of factor
$$j$$
is the number of factor
 $$i$$
in each planning unit.
$$i$$
in each planning unit.
Table 2. Description of the five aspects, including ten variables used to calculate the socioeconomic land cost in each catchment-based planning unit. The measurement of each variable was normalized and assigned a different weight.

ps = points with GIS shapefile (*.shp) format.
Scenario analyses
All Zonation 4GUI analyses used the set of key species grids described above, along with the planning unit layer, the condition layer, the hierarchical mask and, for some analyses, the cost layer described above. Existing PAs were included using a hierarchical mask, an approach developed in order to select optimal areas for PA expansion (Pouzols et al. Reference Pouzols, Toivonen, Di Minin, Kukkala, Kullberg and Kuusterä2014). Two Zonation 4GUI analyses were performed. In an initial analysis (CAZ), we assumed that, from an ecological perspective, the best practice was to protect the entire landscape, while for the second analysis, we added the socioeconomic value of conservation costs in order to identify feasible regions for PA designation to protect biodiversity cost-effectively. Increases in solution acquisition costs required the same total conservation value to be maintained following the forcible exclusion of sites (section cost layer), which would belong to the optimal cost-efficient solution (Moilanen et al. Reference Moilanen, Wilson, Possingham and Regan2009).
Conservation effectiveness
The overall conservation effectiveness came from performance curves in Zonation 4GUI. Each target species’ conservation effectiveness (
 $${T_o}$$
) was assessed by quantifying the degree to which the range of each key species in the existing PAs is achieved in each target species’ appropriately proportioned distribution area:
$${T_o}$$
) was assessed by quantifying the degree to which the range of each key species in the existing PAs is achieved in each target species’ appropriately proportioned distribution area:
 $${T_o} = {A_{protected}}/{A_{target}}$$
where
 $${A_{ptected}}$$
represents the distribution area of species
$${A_{ptected}}$$
represents the distribution area of species
 $$o$$
in the existing protected planning units and
$$o$$
in the existing protected planning units and
 $${A_{target}}$$
is the appropriately proportioned distribution area of species
$${A_{target}}$$
is the appropriately proportioned distribution area of species
 $$o$$
. The value of
$$o$$
. The value of
 $${A_{target}}$$
was obtained by multiplying the conservation weight and each suitable habitat area of target species.
$${A_{target}}$$
was obtained by multiplying the conservation weight and each suitable habitat area of target species.
 $${T_o}$$
≥ 100% represents that the range of species
$${T_o}$$
≥ 100% represents that the range of species
 $$o$$
is covered.
$$o$$
is covered.
Results
Degradation status of watershed conservation
The ecological quality of the river basin has been declining year by year, and its ecological vulnerability has increased. According to NPP analysis, significantly degraded areas with a confidence coefficient of over 90% accounted for 32.4% of the total watershed area (Fig. 1(a)). The ecological degradation of the Zhangjiang River Basin has been severe in the past 20 years. The water retention capacity has declined and the main ecological flow has degraded by 25% (Zhangjiang Libo Hydrological Station, personal communication). The indicators of river connectivity, sinuosity, channelization, riverbank stability, riverbed stability and river morphology showed that the main channel of the river’s physical structure had degraded by 31.2%. The upstream water source area had degraded by 7.3%, accompanied by water pollution and water volume reduction.
Designated PAs cover 6.3% of the Zhangjiang River Basin, but over 2.3% of the land in PAs had been exploited in 2017. In the current PA, several species were found to have no coverage, including Semiliquidambar cathayensis, Kmeria septentrionalis, Thamnocharis esquirolii, Fokienia hodginsii (Fujian cypress), Taxus wallichiana var. chinensis, Pseudotsuga sinensis (Chinese Douglas-fir), Phoebe zhennan, Mussaenda anomala and Sinopteris grevilleoides. The other 80.4% of the species had low habitat coverage. The average coverage ratio per species was 7.1%, which indicated that the current PA network fails to represent all of the biodiversity that needs protection.
The conservation cost analysis (Fig. 1(b)) showed that the planning units that had high conservation costs were located in the middle of the Zhangjiang River Basin, including along the main channel of the Zhangjiang River, concentrated habitats in the upstream region and the catchments of the Shuidong River and Shuibian River.
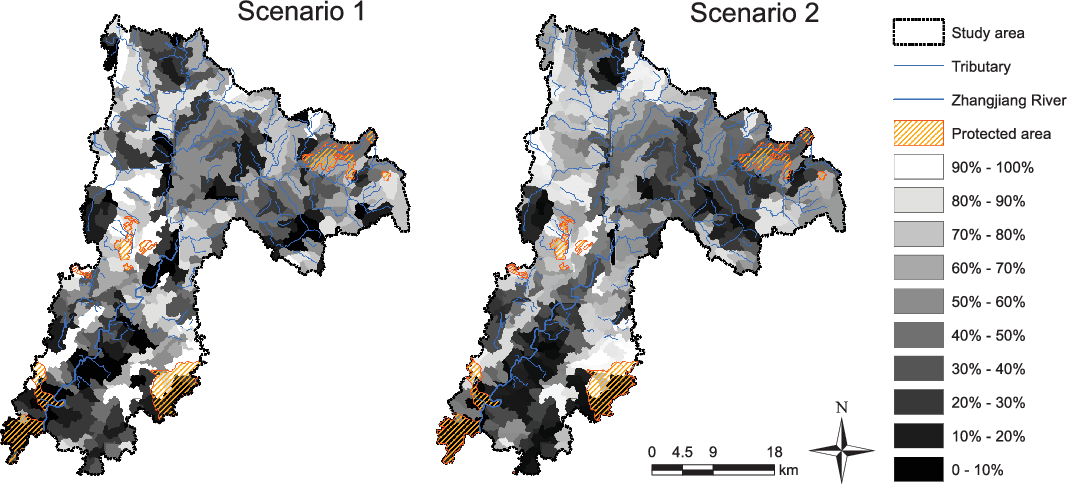
Scenario assessment with ecological integrity as a priority
The large central areas of the sub-catchments along the mainstream Zhangjiang River and Latan River have a very high priority rank (Fig. 2(a)), despite being areas of high human impact (Fig. 1(b)). The environmental conditions that made this subtropical evergreen broadleaf forest a place to settle and build towns also make it suitable for a particular set of birds such as the scaly-sided merganser (Mergus squamatus) and the declining Manglietia calcarea that have relatively little suitable habitat elsewhere in the region. According to the current conservation network, by protecting an additional 7.4% of the study area, this scenario has characteristics such that the top 10% of the landscape would include 34.8% of the ranges of target species, which are mostly mammals, such as the Asian golden cat (Catopuma temminckii) and rhesus monkey (Macaca mulatta). Increasing the coverage to 30% to match the overall conservation goal would need an additional 27.2% of the study area to be protected; this would cover 93.5% of the ranges of the target species.

Fig. 2. Priority rankings derived from Zonation 4GUI analyses under (a) Scenario 1 with ecological integrity as a priority and (b) Scenario 2 where socioeconomic costs were involved in the iteration. Panels (a) and (b) show priority rank maps expanding from the current protected areas. The darker areas have higher priority for conservation. The top 10% and top 20% correspond to high- and medium-ranked protected areas, respectively. The top 30% correspond to the post-2020 global biodiversity framework target.
Socioeconomic costs involved in iterative assessment of conservation scenarios
Incorporating socioeconomic impact markedly alters the distribution of high-priority units, with greater priority accorded to planning units with low cost (Fig. 2(b)). These are located mostly in high-elevation sites with steep terrain, which are unsuitable for agricultural or other development (Fig. S1). By protecting an additional 8.0% of the Zhangjiang River Basin, the representativeness of the PA network would increase, covering 17.4% of the ranges of target species. With regards to the threshold of 30% protection of the area, protecting an additional 27.2% of the region would cover 80.4% of the ranges of target species (Table 3).
Table 3. Comparison of conservation goals achieved before and after expansion of the protected area (PA) network to Scenario 1 with ecological integrity as a priority and Scenario 2 where socioeconomic costs were involved in the iteration. Target species conservation effectiveness was quantified by the percentage of each key species’ coverage within the top 10%, 20% and 30% priority areas in each target species’ appropriately proportioned distribution area. New PAs are the areas identified by Zonation 4GUI that would best complement the already existing PA network. ‘
 $${T_o}$$
≥ 100%’ represents that the range of a key species
$${T_o}$$
≥ 100%’ represents that the range of a key species
 $$o$$
is encompassed.
$$o$$
is encompassed.

Performance curves of the two scenarios
Zonation 4GUI output indicates the likely conservation effectiveness. Scenario 1’s performance value initially rises rapidly, reaching a value of 0.314 when just 10% of the geographical area is protected, 0.485 at 20% landscape protection and 0.575 at 30% landscape protection (Fig. 3). Scenario 2’s performance value rises more slowly than that of Scenario 1, reaching a value of 0.167 when 10% of the study area is protected, 0.367 at 20% landscape protection and 0.482 at 30% landscape protection. This non-linear response reflects the manner in which initial increments in protection can be expected to produce rapid gains in biodiversity protection, but with decreasing increments once higher levels of protection proportion are achieved and only low-quality locations remain. At the 30% conservation target, prioritization under the scenario with ecological integrity as a priority performed better than prioritization under the scenario of socioeconomic cost iteration. Taking account of land costs reduces the conservation effectiveness. However, because at least some good-condition sites are available across many classification groups, the conservation effectiveness delivered by protection of the highest-quality 10% declines only by 0.147. In the two prioritizations, the maximum mean species coverage at the start of the analyses was 80%. This is a result of the adjustment to the species distributions that occurred after applying the landscape condition layer. Ecological conditions resulted in a 28.4% reduction in the species distributions potentially available for protection at the beginning of the prioritization.

Fig. 3. Performance curves of the Zonation 4GUI prioritization analyses based on ecological integrity prioritization (Scenario 1, black line) and Scenario 2 where socioeconomic cost is involved in iteration (grey line), showing the proportion of available cells that are protected (x-axis) and the corresponding weighted average species range protected (y-axis). The vertical dotted line corresponds to the area equal to the post-2020 global biodiversity framework 30% target for terrestrial land protection.
Discussion
New category of priority areas
The Zhangjiang watershed has been recognized internationally and is part of the international conservation network of the United Nations Educational, Scientific and Cultural Organization (UNESCO) World Biosphere Reserve and World Cultural and Natural Heritage. However, problems with overlapping designations, fragmented governance, unclear boundaries, ambiguities and conflicts between development and protection have been accumulating in China. In order to address this deficiency, a new category of PAs in the ongoing reforms of establishing the ‘PA system with national parks as its mainstay’ was introduced in 2019 (Xu et al. Reference Xu, Pimm, Du, Su, Fan and An2019). Our revised conservation target established under a post-2020 global biodiversity framework is effectively structured so that it can enhance implementation through actionable policies. We recommend all types of current PAs, and our conservation gap analysis results (see Fig. 2) need to be re-categorized within China’s newly proposed three major types to meet measurable conservation goals: Maolan National Park as the mainstay (top 10% of total study area), supported by Zhangjiang mainstream nature reserves as the foundation (top 10–20%) and complemented with various natural parks (top 20–30%). Each type should be treated differently. National parks restrict human disturbance; ecological loss should be completely avoided. In nature reserves, ecological loss should be minimized through proper project design. In natural parks, restoration should progress through on-site habitat actions. Our study provides a practical approach to identifying an area-efficient and balanced set of candidates at scale for optimizing the existing PA system of southwest China.
Representativeness and complementarity
Our findings are consistent with the conclusions of other nationwide assessments using gap analysis (Guo et al. Reference Guo, Cui, Zhang and Li2019), hotspot identification (Chi et al. Reference Chi, Zhang, Xu, Zhang, Zhao and Liu2017) and system conservation planning (Zhang et al. Reference Zhang, Luo, Mallon, Li and Jiang2017). PAs are not well delineated enough to protect either biodiversity or ecosystem services in the Southwest China Biodiversity Hotspot. PA networks scarcely capture the habitats for plants and amphibians (Xu et al. Reference Xu, Xiao, Zhang, Yang, Zhang and Hull2017). PAs cover only 1–10% of the karst area (Xu et al. Reference Xu, Wu, Cao, Cao, Tong and Le2018). Chi et al. (Reference Chi, Zhang, Xu, Zhang, Zhao and Liu2017) found that southwest China as a hotspot of threatened Chinese medicinal plants was underrepresented by all types of PA. Our site includes the distributions of M. calcarea and Michelia angustioblonga, wild plant species with extremely small populations that represent complete conservation gaps (Zhang et al. Reference Zhang, Guo, He and Tang2018). Focusing on the conservation of such plants can better protect other species as well (Zhang et al. Reference Zhang, Guo, He and Tang2018).
The current PA network of the Zhangjiang River very poorly represents those key species whose presence must be guaranteed inside this ecological region. However, opportunities to improve this weak representation are quite high. The CAZ of the complementarity algorithm we adopted in Zonation 4GUI gives a better analysis of species rarity and uniqueness. Because it prioritizes the core areas that are important to threatened amphibians, plants and species with extremely small populations and it tests all possible site selection scenarios, it gives those species within a limited range higher priority. We recommend that existing PAs need to be expanded in order to encompass important areas focusing on amphibians and plants, given their low coverage inside current PAs and the need for stricter protection. The priority areas delineated through our analysis span c. 30% of the total land surface area, but will encompass 80.4% and 93.5% of important habitats for threatened plants, mammals, birds and amphibians. The priority areas will better protect their genetic resources for sustainable development.
Effectiveness and connectivity
China is now advancing policies to secure biodiversity and ecological conservation from rapid economic development; however, our results show severe environmental degradation is occurring. The Yangtze River and Pearl River Shelter Forest Projects were launched in 1989 across the southwest parts of China with the aim of battling floods and reducing soil erosion. The increased forest cover is dominated by non-native, single-species plantations, and the afforestation has been in regions that did not originally support forests; such forests contribute less significantly to biodiversity conservation (Wu et al. Reference Wu, Possingham, Yu, Jin, Wang and Yang2019). We suggest that this ongoing project should promote native, mixed plantations over non-native, fast-growing monocultures and prioritize the restoration of native forests.
Catchment hydrology manipulation could enhance the in situ persistence of target species (Greenwood et al. Reference Greenwood, Mossman, Suggitt, Curtis and Maclean2016). This evidence, in combination with our conservation prioritization based on the analysis of catchment units, suggests establishing clusters of PAs in priority areas in order to reinforce the hydrological connectivity of the PA system. It is also necessary to help coordinate between our inner PA system transboundary PAs, which are experiencing related karst habitat degradation, pollution, resource overexploitation and biodiversity loss due to a lack of connectivity. A larger scale of coordinated PA implementation and management between southwest China and Association of Southeast Asian Nations (ASEAN) countries such as Laos and Myanmar could achieve better integrated and more optimal biodiversity conservation.
We acknowledge that it would be beneficial to account for several additional factors. In the real-life implementation context, conservation prioritization typically involves actions rather than places or species (Lehtomäki & Moilanen Reference Lehtomäki and Moilanen2013). This implies that, in addition to spatially explicit biodiversity information, socioeconomic costs of conservation actions and threats to species have critical roles to play when making conservation decisions (Lehtomäki et al. Reference Lehtomäki, Kusumoto, Shiono, Tanaka, Kubota and Moilanen2019). Our method can be applied farther afield. Located in part of a world biodiversity hotspot, southwest China is home to many impoverished ethnic minorities. Current PAs are understaffed, underfunded, poorly managed and degrading. Given that China’s rural revitalization strategy is implemented at the local level, a fully operational conservation prioritization approach would be greatly enhanced if it could account for balancing both socioeconomic and environmental preferences and constraints. We propose that environmentally friendly farming techniques and management skills need to be taught to village residents in order to help them escape from poverty and increase in situ PA protection management and incomes. For example, alliances between government, industry, universities and institutes could promote underforest bee farming or traditional mushroom and herb growing, which might mitigate resource overexploitation through the development of forest by-products.
Supplementary material
To view supplementary material for this article, please visit https://doi.org/10.1017/S0376892921000138.
Financial support
This work was supported by the National Natural Science Foundation of China (No. 41901220), the General project of Beijing Municipal Science & Technology Commission (KM201910016018) and Youth Backbone Individual Program of Beijing Excellent Talents Training Project.
Conflicts of interest
None.
Ethical standards
None.