I. INTRODUCTION
Acetamidine salts are starting materials for syntheses of various nitrogen heterocycles mainly used as biologically active compounds (Gautier et al., Reference Gautier, Miocque, Farnoux and Patai1975; Lobanov and Dar’lin, Reference Lobanov and Dar'in2013; Re et al., Reference Re, Fantacuzzi, Maccallini, Paciotti and Amoroso2016). In the field of energetic materials, acetamidines are starting materials for synthesis of 2,2-dinitroethene-1,1,-diamine (Latypov et al., Reference Latypov, Bergman, Langlet, Wellmar and Bemm1998; Jalový et al., Reference Jalový, Ek, Ottis, Dudek, Růžička, Lyčka and Latypov2013), the compound with reduced sensitivity to mechanical stimuli. Main reason for the use of acetamidine in the form of salts is that free base of acetamidine is hygroscopic and rather unstable producing ammonia and acetonitrile at elevated temperatures (Crossland and Grevil, Reference Crossland and Grevil1981) or acetamidinium carbonate in contact with air (Norrestam, Reference Norrestam1984).
We have inspected the CSD database (Allen, Reference Allen2002) and the PDF-4 Organics 2016 database (ICDD, 2016) and found the powder data for the title compound, PDF card no. 02-090-6820 (Tominey et al., Reference Tominey, Docherty, Rosair, Quenardelle and Kraft2006) calculated from the single-crystal measurement at 100 K. The compound is tetragonal [a = 6.4456(9) Å, c = 12.530(3) Å, unit-cell volume V = 520.6(3) Å3, Z = 4, space group P43212].
The significant temperature expansion was observed and therefore we have decided to characterize this compound by X-ray powder diffraction (XRD) technique at the ambient temperature.
II. EXPERIMENTAL
A. Synthesis
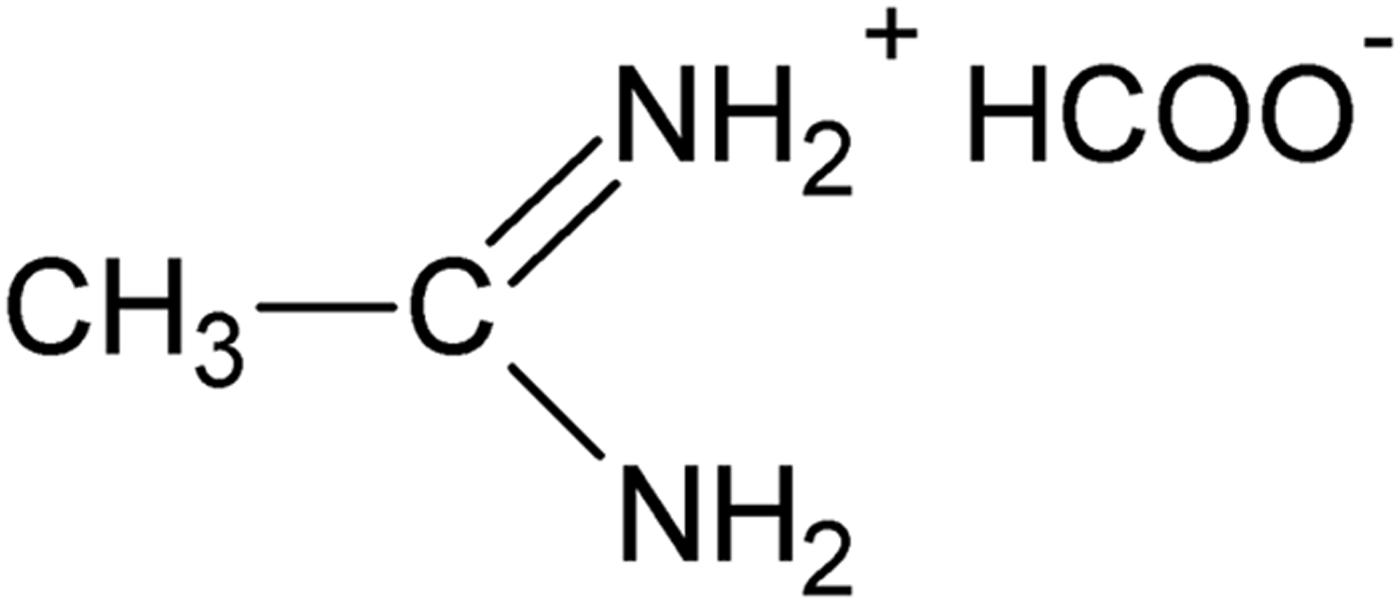
A mixture of trimethyl orthoacetate and ammonium formate at molar ratio 1:2, respectively, was heated under reflux for 2.5 h (Jalový et al., Reference Jalový, Matyáš, Ottis, Růžička, Šimůnek and Polášek2011). After cooling, the white material obtained (title compound, Figure 1) was washed with methanol and dried. Melting point, elemental analysis, and NMR spectra were identical with those described in literature (Jalový et al., Reference Jalový, Matyáš, Ottis, Růžička, Šimůnek and Polášek2011).
B. Melting point and density measurement
The melting point M.p. 215–216 °C was measured with Kofler bench (Nagema). The experimental density ρ m = 1.269 g.cm−3 was determined in Helium pycnometer, Accu Pyc II 1340, MJ Micromeritics, Norcross, USA.
C. Specimen preparation
Sample was carefully grinded in an agate mortar and firstly front-loaded into the specimen holder. The obtained powder pattern showed strong preferred orientation effect because of plate-like shape of crystallites. The (0 0 l) intensities normal to the plate were enhanced significantly. A few sample preparation technique combining front loading, back loading, mixing with SiO2 amorphous diluting in ratio 0.3:0.2 g or 0.3:0.005 g, spreading on the Si low-background support and capillary packing were used to eliminate preferred orientation effect. The ratio of integral intensities I(0 0 4)/I(2 1 2) was used to judge which technique is the most appropriate one. The results are summarized in Table I.
Table I. The elimination of preferred orientation by different sample preparation technique.
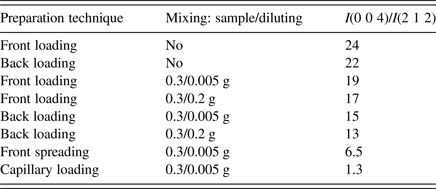
It is clearly seen that back loading has got only a slight effect on decreasing preferred orientation, mixing with diluting is a more efficient method. The ratio 0.3 g of sample:0.005 g of diluting seemed reasonable compromise for eliminating preferred orientation effect and keeping intensities of sample relatively high. The front spreading on the Si low-background support got us even further, but the best elimination was achieved when capillary packing was used. So the final powder data were collected from the sample mixed with diluting placed in the 0.5 mm borosilicate glass capillary.
D. Diffraction data collection and reduction
The diffraction pattern for the title compound was collected at room temperature with an X'Pert3 Powder θ–θ powder diffractometer with parafocusing Bragg–Brentano geometry using CuKα radiation (λ = 1.5418 Å, Ni filter, generator setting: 40 kV, 30 mA). An ultrafast PIXCEL detector was employed to collect XRD data over the angular range from 5 to 80° 2θ with a step size of 0.026° 2θ and a counting time of 316.97 s/step.
The software package High Score Plus V 3.0e (PANalytical, Almelo, The Netherlands) was used to smooth the data, to fit the background and the top of smoothed peak method was used to determine the peak positions and intensities of the diffraction peaks.
III. RESULTS AND DISCUSSION
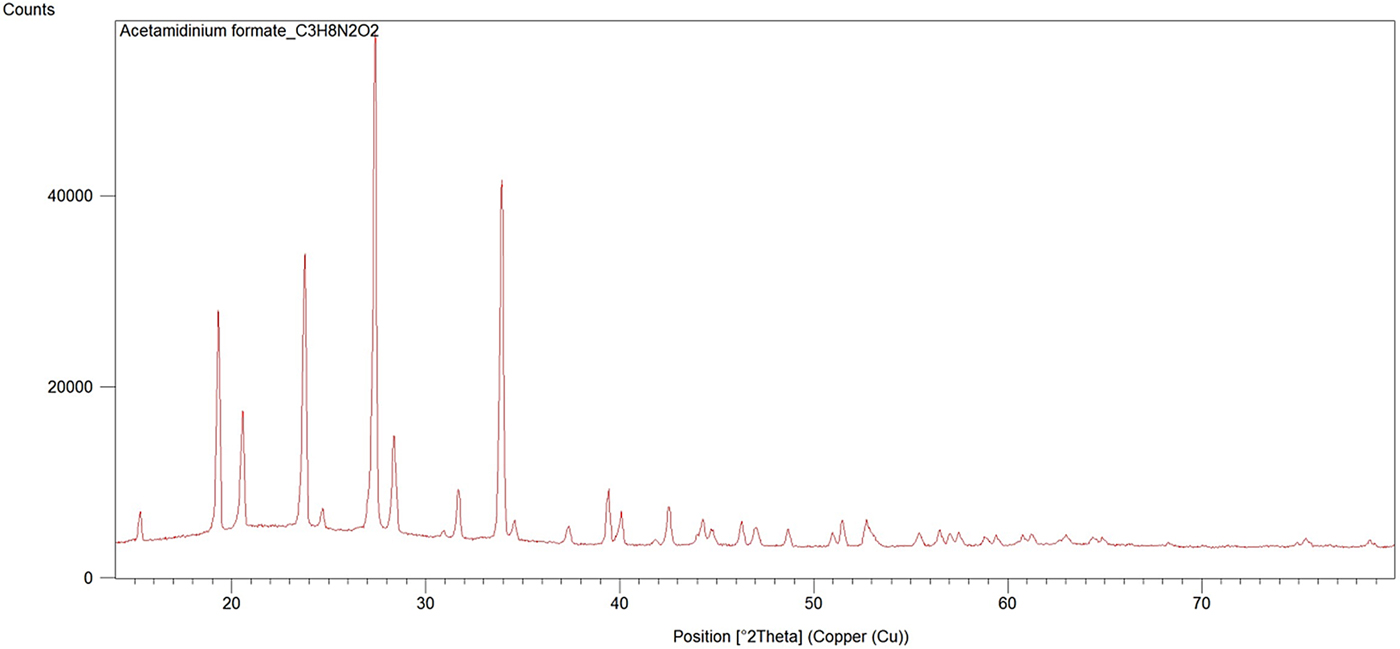
The experimental powder diffraction pattern is depicted in Figure 2. Automatic indexing of results obtained using TREOR (Werner et al., Reference Werner, Erikson and Westdahl1985) show that title compound C3H8N2O2 is tetragonal with space group P43212 and unit-cell parameters: a = 6.4564(5) Å, c = 13.021 (3) Å, unit-cell volume V = 542.8(3) Å3, and Z = 4. The figures of merits are F 20 = 32(0.0191, 370) (Smith and Snyder, Reference Smith and Snyder1979) and M 20 = 25 (de Wolff, Reference de Wolff1968). All measured lines presented in Table II were indexed and are consistent with the P43212 space group.

Figure 1. Structural formula of acetamidinium formate.

Figure 2. (Colour online) X-ray powder diffraction pattern of title compound using CuK α radiation (λ = 1.5418 Å).
Table II. Indexed X-ray powder diffraction data for C3H8N2O2.
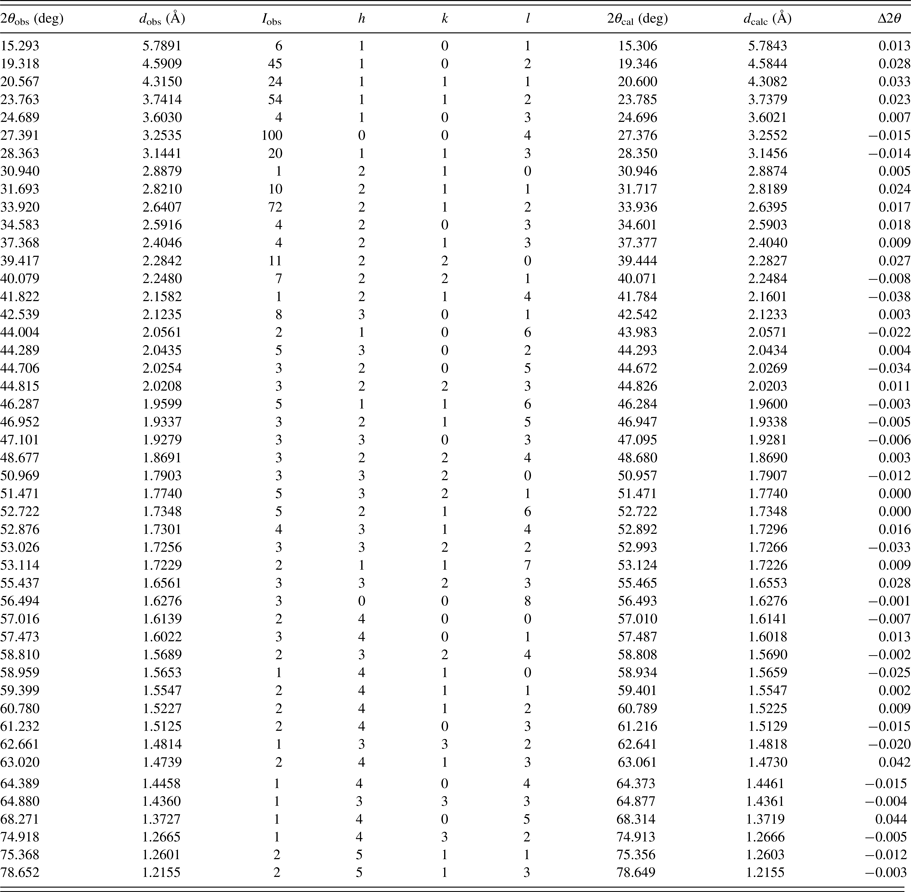
Only the peaks with I rel of 1 or greater are presented [a = 6.4564(5) Å, c = 13.021 (3) Å, unit-cell volume V = 542.8(3) Å3, Z = 4, and space group P43212]. All lines were indexed and are consistent with the P43212 space group. The d-values were calculated using CuK α 1 radiation (λ = 1.5406 Å).
SUPPLEMENTARY MATERIAL
The supplementary material for this article can be found at https://doi.org/10.1017/S0885715617000987.
Acknowledgements
This work was carried out within the framework of the National Programme for Sustainability (NPU I LO1215) Ministry–34870/2013, GACR project 16-25747S and specific university research (MSMT No. 20-SVV/2016).