


Introduction
High plant species diversity in tropical rainforests is largely attributable to the large number of uncommon species that occur at low population densities which are thus vulnerable to fragmentation and changing environmental conditions (Ashton Reference Ashton1969; Janzen Reference Janzen1970; Gentry Reference Gentry, Holm-Nielsen, Nielsen and Balslev1989; Condit et al. Reference Condit, Hubbell and Foster1992; Condit et al. Reference Condit, Hubbell, La Frankie, Sukumar, Monokaran, Foster and Ashton1996). While trees play important ecological roles (Jones et al. Reference Jones, Lawton and Shachak1994; Svenning Reference Svenning2001), understory species, which may have shorter lifespans, can represent 45% of the vascular plant diversity in tropical forests (Gentry & Dodson Reference Gentry and Dodson1987; Balslev et al. Reference Balslev, Valencia, Paz, Mĩno, Christensen, Nielsen, Dallmeier and Comiskey1998; Linares-Palomino et al. Reference Linares-Palomino, Knist, Aguirre-Mendoza and Gonzales-Inca2009; Cicuzza et al. Reference Cicuzza, Krömer, Poulsen, Abrahamczyk, Delhotal, Piedra and Kessler2013). Yet tropical forest plots have largely focused on trees larger than 10 cm diameter at breast height (dbh), and hence major components of diversity represented by smaller species, which are likely to have higher turnover rates, have been neglected (Cicuzza et al. Reference Cicuzza, Krömer, Poulsen, Abrahamczyk, Delhotal, Piedra and Kessler2013; Lutz et al. Reference Lutz, Furniss, Johnson, Davies, Allen, Alonso, Anderson-Teixeira, Andrade, Baltzer and Becker2018; Hubau et al. Reference Hubau, De Mil, Van den Bulcke, Phillips, Ilondea, Van Acker, Sullivan, Nsenga, Toirambe and Couralet2019; Muscarella et al. Reference Muscarella, Emilio, Phillips, Lewis, Slik, Baker, Couvreur, Eiserhardt, Svenning and Affum-Baffoe2020). Palms (Arecaceae) typically display high levels of endemism and high species diversity in tropical forests (Dransfield et al. Reference Dransfield, Uhl, Asmussen, Baker, Harley and Lewis2008). Palms in the Indo-Malayan region are mostly small-sized in diameter and are rarely included in permanent plot monitoring programmes, meaning that little is known of their long-term persistence (Faurby et al. Reference Faurby, Eiserhardt, Baker and Svenning2016; Kissling et al. Reference Kissling, Balslev, Baker, Dransfield, Göldel, Lim, Onstein and Svenning2019; Muscarella et al. Reference Muscarella, Emilio, Phillips, Lewis, Slik, Baker, Couvreur, Eiserhardt, Svenning and Affum-Baffoe2020).
Understorey species make up a large portion of palm diversity in the Indo-Malayan biogeographical realm, particularly in the genera Pinanga and Licuala (Muscarella et al. Reference Muscarella, Emilio, Phillips, Lewis, Slik, Baker, Couvreur, Eiserhardt, Svenning and Affum-Baffoe2020). Borneo is a centre of diversity for Pinanga with a large number of endemic species (37), yet we know little about abundance and population dynamics of most species (Dransfield Reference Dransfield1991; Govaerts et al. Reference Govaerts, Dransfield, Zona, Hodel and Henderson2019; Bellot et al. Reference Bellot, Odufuwa, Dransfield, Eiserhardt, Sang, Pérez-Escobar, Petoe, Usher and Baker2020). Globally, the distribution of palms is strongly associated with relatively high rainfall levels, particularly in the driest quarter; thus, palm species may be susceptible to climate change in regions where it leads to drier dry seasons (Muscarella et al. Reference Muscarella, Emilio, Phillips, Lewis, Slik, Baker, Couvreur, Eiserhardt, Svenning and Affum-Baffoe2020). Besides water availability, the occurrence of extreme weather events may influence palm distributions (Blach-Overgaard et al. Reference Blach-Overgaard, Kissling, Dransfield, Balslev and Svenning2013). Forest clearing in Borneo is predicted to lead to reduced rainfall (Kumagai et al. Reference Kumagai, Kanamori and Yasunari2013; McAlpine et al. Reference McAlpine, Johnson, Salazar, Syktus, Wilson, Meijaard, Seabrook, Dargusch, Nordin and Sheil2018). While there has been significant clearing of native forest in Borneo in recent decades, Brunei is an exception with more than 50% of the land area still covered by unlogged forest (Bryan et al. Reference Bryan, Shearman, Asner, Knapp, Aoro and Lokes2013; Gaveau et al. Reference Gaveau, Sloan, Molidena, Yaen, Sheil, Abram, Acrennaz, Nasi, Quinones, Wielaard and Miejaard2014, Reference Gaveau, Sheil, Salim, Arjasakusuma, Ancrenaz, Pacheco and Meijaard2017). Palm spatial distributions at a finer scale have been linked to hydrology, edaphic conditions and forest stand turnover rates (Svenning Reference Svenning2001; Costa et al. Reference Costa, Guillaumet, Lima and Pereira2009; Eiserhardt et al. Reference Eiserhardt, Svenning, Kissling and Balslev2011; Emilio et al. Reference Emilio, Quesada, Costa, Magnusson, Schietti, Feldpausch, Brienen, Timothy, Chave and Álvarez2014). Palm roots tend to be shallow, so they are often found on shallow, relatively low-nutrient soils with high water tables. Water availability has been shown to be important in the Arecoideae subtribe of which Pinanga are a member (Dransfield Reference Dransfield1991; Muscarella et al. Reference Muscarella, Emilio, Phillips, Lewis, Slik, Baker, Couvreur, Eiserhardt, Svenning and Affum-Baffoe2020). Thus, Pinanga palm population turnover rates could be impacted by increasing drought frequency and intensity under climate change even when protected in reserves (Muscarella et al. Reference Muscarella, Emilio, Phillips, Lewis, Slik, Baker, Couvreur, Eiserhardt, Svenning and Affum-Baffoe2020).
The Ulu Temburong National Park is an unlogged area of lowland mixed Dipterocarp tropical rainforest that has very high plant species diversity (Poulsen & Pendry Reference Poulsen and Pendry1995; Small et al. Reference Small, Martin, Kitching and Wong2004; Heckenhauer et al. Reference Heckenhauer, Abu Salim, Chase, Dexter, Pennington, Tan, Kay and Samuel2017). Landslides and slippages are the most common form of disturbance (Small et al. Reference Small, Martin, Kitching and Wong2004; Sukri et al. Reference Sukri, Wahab, Abu Salim and Burslem2012; Heckenhauer et al. Reference Heckenhauer, Abu Salim, Chase, Dexter, Pennington, Tan, Kay and Samuel2017). Of the understory species, the palms (Arecaceae) are the second most diverse family (Poulsen & Pendry Reference Poulsen and Pendry1995). At least, 13 species of Pinanga have been recorded in the Ulu Temburong National Park area, but little is known of species interactions or if populations are stable or declining (Coode et al. Reference Coode, Dransfield, Forman, Kirkup and Said1996). Both reproductive success and offspring survival are required for population persistence (Olmsted & Alvarez-Buylla Reference Olmsted and Alvarez-Buylla1995; Brook et al. Reference Brook, Tonkyn, O’Grady and Frankham2002; Bouzat Reference Bouzat2010). Pinanga have small fleshy fruits and are monoecious and most likely pollinated by insects (Henderson Reference Henderson1986; Dransfield et al. Reference Dransfield, Uhl, Asmussen, Baker, Harley and Lewis2008). The Pinanga genus contains both endangered and invasive species; thus, assumptions about population dynamics are likely to vary considerably (Shapcott Reference Shapcott1999; Singh et al. Reference Singh, Gaur and Gaur2014; Dyer et al. 2018; Zulkarnaen et al. Reference Zulkarnaen, Nisyawati and Witono2019). Many Pinanga, while single stemmed, basally resprout and can form multi-stemmed clumps which may also enhance individual persistence (Shapcott Reference Shapcott1999; Dransfield et al. Reference Dransfield, Uhl, Asmussen, Baker, Harley and Lewis2008; Hodel Reference Hodel2009).
There are few studies that document multiple co-occurring congeneric understory palm populations over longer time intervals compared to short duration single species studies, and few of these are in South East Asia (Martínez-Ballesté et al. Reference Martínez-Ballesté, Martorell, Martínez-Ramos and Caballero2005; Maschinski & Duquesnel Reference Maschinski and Duquesnel2006; Nazareno & dos Reis Reference Nazareno and dos Reis2014; Mandle et al. Reference Mandle, Ticktin and Zuidema2015; Jansen et al. Reference Jansen, Zuidema, van Ast, Bongers, Malosetti, Martínez-Ramos, Núñez-Farfán and Anten2019; Shapcott et al. Reference Shapcott, James, Simmons, Shimizu, Gardiner, Rabehevitra, Letsara, Cable, Dransfield, Baker and Rakotoarinivo2020). Five understory Pinanga species, which co-occur on the lower slopes and riverbanks at the Ulu Temburong National Park, P. aristata, P. brevipes, P. dumetosa, P. tenella var. tenella and P. veitchii were surveyed in detail as part of a genetic study in 1998 (Shapcott Reference Shapcott1999). They were selected for their overlapping population distributions and variation in density while minimising the life history differences (Shapcott Reference Shapcott1999). Twenty years later in 2018, this study undertook a comprehensive resurvey of the same five species of Pinanga at the same sites. This survey aimed to assess if there are similar population changes across multiple species and sites which may be indicative of broader environmental change. The study also assessed if there had been changes in rainfall patterns over this time that may have impacted on Pinanga species abundances. Specifically, the study asked: are populations of these five Pinanga species declining or increasing since the original surveys and if so, how is this related to species demographic, reproductive or growth form traits.
Methods
Field site
The study took place in the Ulu Temburong National Park in Brunei (550 km2) in which the Kuala Belalong Field Studies Centre (KBFSC) is located (Figure 1). The area is dominated by two rivers (Temburong and Belalong), which join at the Kuala Belalong (Figure 1). The geography of the area is highly dissected with very steep slopes divided by an intricate network of deeply incised drainage lines and creeks creating a myriad of microclimates and microhabitats (Figure 1: Small et al. Reference Small, Martin, Kitching and Wong2004; Sukri et al. Reference Sukri, Wahab, Abu Salim and Burslem2012; Heckenhauer et al. Reference Heckenhauer, Abu Salim, Chase, Dexter, Pennington, Tan, Kay and Samuel2017). A series of permanent plots has been established, including the Earthwatch plot used in this study (Figure 1: Ashton Reference Ashton1964; Poulsen et al. Reference Poulsen1996; Small et al. Reference Small, Martin, Kitching and Wong2004; Heckenhauer et al. Reference Heckenhauer, Abu Salim, Chase, Dexter, Pennington, Tan, Kay and Samuel2017). The dominant soils are silty clay dominated by quartz and kaolinite (utisols) and are low in basic plant nutrients (Sukri et al. Reference Sukri, Wahab, Abu Salim and Burslem2012; Heckenhauer et al. Reference Heckenhauer, Abu Salim, Chase, Dexter, Pennington, Tan, Kay and Samuel2017).
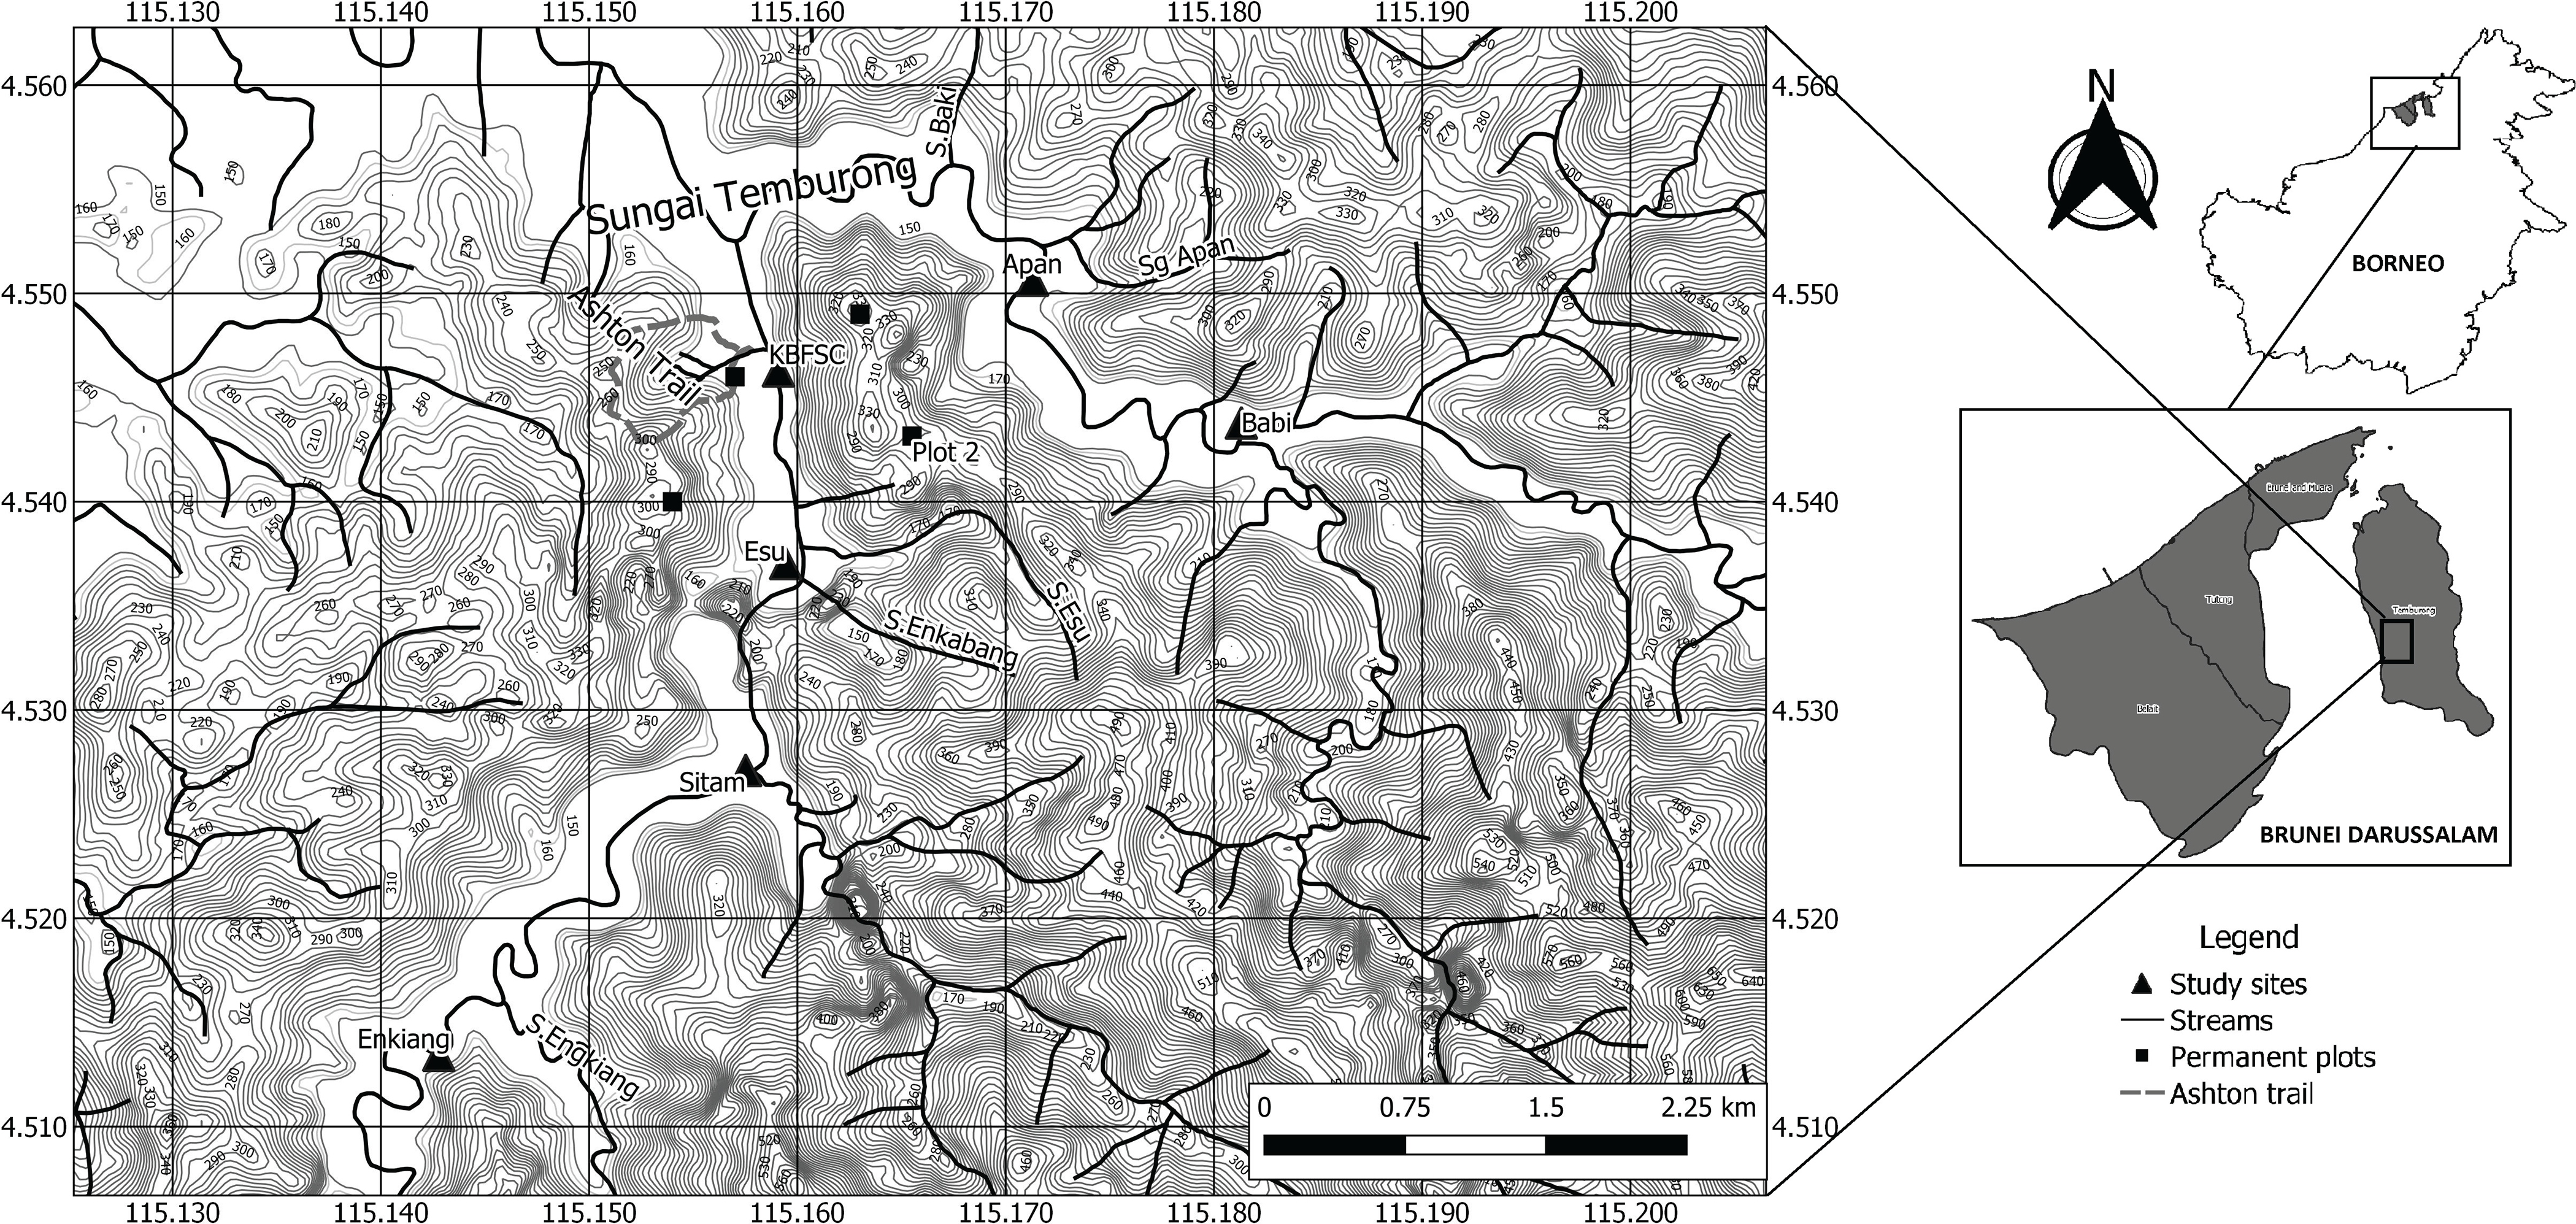
Figure 1. Topographical map of the study area showing its relative location within Brunei and Borneo (inserts) and the latitude and longitude grid, scale bar and contour lines. The locations and names of the six study sites are indicated together with the Temburong and Belalong rivers (Sungai) and their junction along with the smaller side creeks (Sungai) associated with the study site locations. The location of Kuala Belalong Field Studies Center (KBFSC) is indicated as are the locations of the nearby Earthwatch permanent plot and other permanent plot sites.
Field methods
The 1998 study used Pinanga species records to identify likely habitat locations and undertook extensive systematic field surveys to locate Pinanga populations (Shapcott Reference Shapcott1999). Five Pinanga species were found which overlapped in their distribution and varied in their density and abundance. These five study species (P. aristata, P. brevipes, P. dumetosa, P. tenella var. tenella and P. veitchii) were documented from six locations in the Ulu Temburong National Park on the Temburong (two sites) and Belalong rivers (four sites) in 1998 (see Shapcott Reference Shapcott1999) and again in 2018 (Figure 1). An area of approximately 50 ha area was searched in each of the original study sites (Figure 1) over a 5-day period, to locate all Pinanga. Once found, the study species were mapped in detail. The original detailed field notes, maps and site notes (Shapcott Reference Shapcott1998) were used to return to the same locations and to resurvey the same populations at a similar time of year in 2018 as in 1998, and the surveys were matched between years for sampling intensity. Where we could not confidently relocate a site in 2018, the site data were removed from the analyses for consistency. The areas where Pinanga were expected to be found (based on the 1998 survey) were searched to ensure plants were not missed in the 2018 survey.
Each site was systematically surveyed within contiguous belt transects until the entire population of each Pinanga species was documented and no more plants were found at that location. The return surveys in 2018 were careful to both survey the same area and capture the whole of the population, where it may have expanded. The relative positions of all individual plants, of all sizes, of each of the study species were mapped as X and Y coordinates 10 m on either side of a 30-m transect line, and this was repeated with contiguous transects placed end to end, side by side or perpendicular to each other with the compass direction of each transect start recorded. For P. tenella var. tenella populations, transects surveyed were 5 m wide, due to its very narrow distribution along creek banks. In 1998, site locations in Borneo Grid Eastings and Northings were derived from available maps, while in 2018 a Garmin handheld GPS set to Borneo Grid was used to mark the locations at the start and end of each transect. Some species were only rarely encountered. In 1998, these plants were mapped relative to one another in the field by recording the compass bearing and distance to the next sampled plant, and the relative locations were later converted into consistent XY coordinates using trigonometry. In 2018, sparsely dispersed plants were relocated from original data with extensive site searching, and individual plant locations were recorded using a GPS. These data were then assembled, and the location of each Pinanga plant was converted to a single X–Y coordinate system for each site. The area thus surveyed in detail ranged from 3600 m2 (6 transects) at Sungai (Sg) Esu to 23400 m2 at Sg Sitam (12 transects plus an area equivalent to 8 transects) for four of the species where their populations overlapped, and for P. tenella var. tenella the area mapped ranged from 800 m2 (5 transects) at Sg Esu to 1950 m2 (13 transects) at Sg Sitam (Figure 1).
For every Pinanga plant, the diameter, height of the trunk and the total plant height were measured with a tape measure or visually estimated against the recorders’ body size using the tape measure as a guide to enable later size distributions to be determined and to facilitate matching individual plants. Seedlings were noted, and their heights were recorded. Any evidence of reproductive activity, past or current (inflorescence or fruit), was also noted, to account for the variation in the timing of surveys. The presence of multi-stemmed plants (MS) was noted in both surveys, and the number of canes/stems per plant was recorded for each P. tenella individual in both 1998 and 2018, while the number of canes/stems per plant was recorded for individuals of all species in 2018.
At KBFSC, some transects overlapped with existing permanent plots including the Earthwatch plot (Small et al. Reference Small, Martin, Kitching and Wong2004) which has its own 10 x 10 m grid system (total 100 x 100 m) and forms a subsection of the area surveyed at KBFSC. To enable a comparison between years within the Earthwatch plot, the relative X–Y coordinate locations and sizes of all Pinanga plants were separately mapped within this grid system and plotted using Excel. Additional monitoring data were obtained subsequent to the 2018 census for the Pinanga in the Earthwatch plot for 2019.
Statistical methods
The total number of plants of each of the study species (N) was determined for 1998 and 2018 at each site. The percentage of plants of each species that showed any evidence of reproduction (% Rep) was also calculated at each site in each year and combined as a pooled percentage (total) across the sites for each year. Population density (D) was calculated as the number of plants per hectare for each species at each site sampled, by using the number of plants of that species encountered and calculating the total area encompassing the sampled plants, or a minimum transect size if only a single plant was recorded. The percentage of plants in each species, at each site, in each year (1998 and 2018) that were multi-stemmed (MS) was also determined from field records. The finite rate of increase (λ), otherwise known as population growth rate (R), from 1998 to 2018 was calculated for each species at each site where R = N(2018)/N(1998) (Akçakaya Reference Akçakaya1999). One-way ANOVA was used with Tukey’s and Dunnett post hoc testing to see if demographic attributes (N, %Rep, D and MS) were significantly different among the five Pinanga species in each of the study years (1998, 2018). Population growth rates (R) were also tested among species to determine significant differences using site data as replicates in IBM SPSS statistics for windows version 25 (IBM 2017). We tested if average species growth rates (R) were significantly correlated with demographic attributes (N, %Rep, D and MS) using Spearman’s rank correlation tests (in SPSS). The demographic data for each species (N, %Rep, D and MS) was compared between the 2 years (1998 and 2018) across the same sites using paired t tests to see if these attributes had significantly changed between census periods. Spearman’s rank correlation tests were undertaken (in SPSS) to test if population growth rates (R) of P. aristata and P. dumetosa were negatively correlated where they co-occurred.
The shape of the size structure was investigated for each species by allocating each plant to a size class, based on the size distributions of plants and where reproductive activity was observed, in order to best represent developmental stages. For P. aristata and P. brevipes, plants could be reliably assigned to diameter classes measured to 0.5 cm accuracy. These were found to be more consistent than height classes for representing developmental stages. Different diameter classes were used, due to the differing size range found in each species, as P. aristata can grow quite tall but height and diameter are not correlated, whereas P. brevipes shows very little vertical growth. The following diameter classe were used for P. aristata: 1 = <1 cm; 2 = 1–<2 cm; 3 = 2–<3 cm; and 4 = 3–<4 cm; 5 ≥ 4 cm, and for P. brevipes: = <1 cm; 2 = 1–<2 cm; 3 = 2–<3 cm; and 4 = ≥3 cm. Height classes were more representative of developmental stages for the remaining three species where canes develop with little expansion in stem diameter. Consistent height classes for P. dumetosa, P. tenella var. tenella and P. veitchii were found to best represent developmental stages as follows: 1 = <0.5 m; 2 = 0.5–<1 m; 3 = 1–<1.5 m; 4 = 1.5–<2 m and 5 = ≥2 m. For each species, the number of plants in each size class was converted to the percentage of plants in each site. The data were also pooled across sites to obtain the percentage of plants in each size class across the species for each year of study. These were plotted as histograms. For each species studied, the overall species size class structure across all study sites was compared between census years using a chi-squared test to see if species population structure had changed over the 20 years. Paired t tests were also undertaken to test if there was a consistent change in the abundance of a specific size class across the five study sites between census years. Bonferoni corrections were made to adjust for multiple tests.
Due to the low reproductive activity of most species, the reproductive activity data were pooled across all sites for each species, and the percentage of the plants in each size class that was reproductively active was used to investigate reproductive activity within developmental stages for each species. To test if there were significant changes between the 1998 and 2018 census years in the percentage of reproductively active plants across the size distribution, chi-squared tests were undertaken in Excel.
We tracked individual plants between years to determine species longevity, seedling production and growth, based on the combination of mapped locations and plant size data. In some cases we could determine these, but in most cases the time gap was too long to be able to confidently develop demographic growth models.
We obtained rainfall records for the period 1997–2019 from KBFSC (IBER) in order to obtain relevant climate information that might explain the data over the time period. We analysed the total monthly rainfall data over the years to see if there was a significant correlation between increasing years and rainfall. We used the slope of the regression line to determine what the average rate of rainfall increase had been over the time period. We also investigated the monthly rainfall over the time period (1997–2019) and tested if specific months’ rainfall increased or decreased over time by using the Pearson’s correlation coefficient in Excel. Mean monthly rainfall was plotted along with the standard deviation in monthly rainfall and the maximum and minimum monthly rainfall over the time period to determine extreme events.
Results
There was a significant difference (P < 0.05) among the five Pinanga species in their abundance (N1998 and N2018), density (D 1998 and D 2018) and percentage of multi-stemmed plants (MS1998 and MS2018: Table 1). However, there was no consistent pattern of increase or decline in species abundance across the five Pinanga species studied over the 20 years. Species growth rates ranged from R = 0.22 to R = 2.05 (Table 1). While three of the five species (P. dumetosa, P tenella var. tenella and P. veitchii) increased in overall abundance (R > 1), only P tenella var. tenella showed a significant increase in population size (N) since 1998 (P < 0.05; Table 1). Two species (P. aristata and P. brevipes) declined overall (R < 1); however, only P. brevipes significantly declined in abundance (N) across the sites studied (P = 0.009; R = 0.22: Table 1). For example, the P. brevipes plant recorded in the Earthwatch plot in 1998 was no longer present in 2018 (Figure 2). This species was the least abundant of all species studied in 1998 and 2018, often only occurring as occasional plants and significantly (P < 0.05) less frequently exhibiting a multi-stemmed form (Table 1). Variation among species in overall growth rate (R) between 1998 and 2018 was significantly and strongly correlated with the percentage of plants in the species that were multi-stemmed (MS) (Spearman’s Rho = 0.900; P = 0.037) and also correlated with density (D, Pearson’s Rho = 0.979; P < 0.005) as measured in both 1998 and 2018 (Table 1). Over the 20-year period, there has been considerable variation in rainfall between years. Overall the slope of the regression line indicated an increase of 22 mm per year. but the weak positive correlation was not significant (Pearson’s Rho = 0.2; P = 0.354; Figure 3).
Table 1. Summary of Pinanga demographic data for each study species at each site where N is the population size, D is the density of plants (plants per Ha), MS is the percentage of plants that are multi-stemmed, % Rep is the percentage of plants with evidence of reproductive activity and R is the finite rate of growth over the period 1998–2018. The river that each site is located on is also indicated (B = Belalong and T = Temburong). Significant differences among species are indicated in the column heading (ANOVA P < 0.05*), and species that are significantly different (Tukey’s and Dunnets post hoc tests) are indicated with species initial superscript beside the total/mean value. Whereas, demographic values were significantly (P < 0.05) different within a species between the 2 years (paired t test) this is indicated as* beside the total/mean values for this parameter for the species


Figure 2. Comparison of the relative location of each Pinanga plant within the 100m x 100 m KBFSC Earthwatch permanent plot, shown within the 10-m grid system in 1998 and 2018. PA = P. aristata; PB = P. brevipies; PD = P. dumetosa symbols for each species as shown in legend.

Figure 3. (Top) Annual rainfall data at KBFSC from 1997 to 2019. There is a slight but non-significant (P > 0.05) increase in total annual rainfall (correlation 0.24). A regression line of best fit is shown with a slope of 22.2 mm per year increase. (Bottom) Mean monthly rainfall at KBFSC with standard deviation is shown (error bars) over the time from 1997 to 2019, and the highest and lowest monthly totals recorded are also indicated (see legend).
The population growth rate varied considerably among sites within species, even in P. tennella var. tenella, which was significantly (P < 0.05) more abundant than all other species and doubled in abundance between 1998 and 2018 (R = 2.04: Table 1). However, this species completely disappeared from Sg Babi (Table 1). Populations of P. veitchii were highly variable over time. It declined in abundance at three sites most notably at Engkiang (R = 0.11) while increasing in abundance at two sites most notably Sg Esu (R = 2.69: Table 1). There was a significant increase between years in the percentage of plants that were multi-stemmed in this species, and this was seen at the sites with substantial population increase (Table 1). Both increases and decreases in population size were also recorded in P. aristata and P. dumetosa. There was no evidence of a consistent difference in population growth between the two rivers or at particular sites (Table 1). However, the population growth rates of P. aristata and P. dumetosa were negatively correlated (Rho = -0.6), although this was not significant (P = 0.2; Table 1). Similar to other sites, P. dumetosa and P aristata within the Earthwatch plot have been dynamic in their spatial locations over the 20-year time period (Figure 2).
The percentage of plants engaged in reproduction was highly variable and significantly different among species (P < 0.05) in 1998 (Table 1). A significantly (P < 0.05) higher percentage of plants were reproductive in P. tenella var. tenella compared to other species and significantly more in 1998 compared to 2018 (P = 0.005: Table 1). Few plants demonstrated evidence of reproductive activity in P. aristata, P. brevipes, P. dumestosa and P. veitchii (1998 and 2018). Reproductive activity was also highly variable among sites (Table 1). The percentage of reproductively active plants (% Rep) was not significantly (P > 0.05) correlated with variation in the population growth (R) rate among species.
Pinanga brevipes, P. aristata, P. dumetosa and P. tenella var. tenella had pulsed rather than continuous regeneration of seedlings (Figure 4). In contrast, most plants of P. veitchii are in the smallest sizes, suggesting a more continuous production of seedlings (Figure 4; Supplementary Information 2). Pinanga brevipes size distribution was significantly different in 2018 compared to 1998 (P < 0.005) with significantly (P < 0.05) more seedlings (< 1 cm diam) and larger-sized plants (2 cm diam and greater) in 1998 and significantly more medium-sized plants (1–2 cm diam) in 2018 (Figure 4). The detailed mapping suggests that within 20 years, there is considerable turnover and that few of the larger-sized P. brevipes plants located in 1998 have persisted. This was for instance observed in the Earthwatch plot, where the unique plant observed in 1998 could not be found in 2018 (Figure 2). The results indicate that P. aristata plants do not begin to reproduce until they are greater than 1 cm diameter, but most reproduction takes place when the diameter is greater than 2 cm (Figure 4). There was also a significant difference in the overall population structure of P. aristata between 1998 and 2018 (chi-squared P < 0.005), with a significantly (P < 0.05) larger percentage of the smallest sized (< 1 cm diam) in 2018 (Figure 4; Supplementary Information 1). Similar to P. brevipes, the larger diameter sized P. aristata plants (3 cm+) were significantly (P < 0.05) more common in 1998 (Figure 4; Supplementary Information 1). The P. aristata sites where the growth rate was less than 1 had no plants recorded in the smallest diameter class in 1998 (Table 1; Supplementary Information 1). The data suggest that over 20 years there has been a high turnover of individuals, and that plants that are 3 cm diameter will not survive a further 20 years (Supplementary Information 1).

Figure 4. Left-hand side histograms show a comparison between study years of the overall size distribution of Pinanga aristata and P. brevipes, plotted as the percentage plants in each diameter class, and for P. dumetosa, P. tenella var. tenella and P. veitchii the percentage plants in each height class are plotted. The years are indicated in the legend. Right-hand side histograms illustrate a comparison of the percentage plants in each size class that were reproductively active for each Pinanga species between survey years based on the pooled sample for each species across all study sites. There is no plot for P brevipes due to lack of reproductive data size class distributions that were significantly different (chi-squared P < 0.05) between 1998 and 2018 and are indicated as *.
There was no significant difference (P > 0.05) in the P. dumetosa size structure between years (Figure 4; Supplementary Information 2). P. dumestosa plants start reproducing after they are at least 0.5 m tall (Figure 4). The pulsed size distribution was similar between years in P. tenella var. tenella overall (P > 0.05) (Figure 4 Supplementary Information 2). For Pinanga tenella var. tenella, the percentage of reproductively active plants gradually increases as size increases in this species (Figure 4). We recorded plants that appear to have persisted on site over the 20-year period, with 34 plants now having greater than 50 canes/stems, whereas in 1998 the largest plant recorded had 36 canes/stems. Despite considerable variation among sites, Pinanga veitchii had similar pooled (P > 0.05) size structure across sites between 1998 and 2018 (Figure 4; Supplementary Information 2). Like other species, there appears considerable turnover of plants over the 20-year period; however, we recorded some plants that have persisted on site with the narrow canes growing to 4 m long, while the majority of reproductively active plants are in the largest size class (Figure 4)
Annual rainfall was variable over the 20 years with both wetter and drier years recorded and slightly increasing overall (Figure 3). However, there was a very high variation in monthly rainfall between years and over the time period, and there have been both episodic flood and drought events, with January being the month with the greatest variation in rainfall recorded (Figure 3). Two episodic flood events are indicated as extreme highest monthly rainfall outliers (Figure 3). These took place in January (2014) and August (1998) just after the 1998 field work was completed. The pulsed regeneration patterns observed in Pinanga species could reflect past extreme events either directly or indirectly. At KBFSC, monthly rainfall was weakly (P > 0.05) positively increasing over time in the wettest months (December, January, April, May and June) with the largest positive correlations in April (Pearson’s Rho = 0.24) and December (Pearson’s Rho = 0.27). Conversely, there was a small but non-significant (P > 0.05) trend for a decline in rainfall in the drier months (February, July, August and September) with the largest effect in July (Rho = -0.133).
Discussion
There have been contrasting predictions regarding changes in precipitation for SE Asia and Borneo with both decreases (Kumagai et al. Reference Kumagai, Kanamori and Yasunari2013; McAlpine et al. Reference McAlpine, Johnson, Salazar, Syktus, Wilson, Meijaard, Seabrook, Dargusch, Nordin and Sheil2018) and increases predicted (Deb et al. Reference Deb, Phinn, Butt and McAlpine2018). The results we obtained from KBFSC found a slightly increasing trend in precipitation since 1997, with high variability among years. This seems consistent with predictions by the Intergovernmental Panel on Climate Change (IPCC) which also predicts that increased seasonality is expected in some parts of SE Asia (Hijioka et al. Reference Hijioka, Lin, Pereira, Corlett, Cui, Insarov, Lasco, Lindgren, Surjan, Barros, Field, Dokken, Mastrandrea, Mach, Bilir, Chatterjee, Ebi, Estrada, Genova, Girma, Kissel, Levy, MacCracken, Mastrandrea and White2014). This may be expected to affect related species of palms differently depending on their physiology (Costa et al. Reference Costa, Guillaumet, Lima and Pereira2009; Emilio et al. Reference Emilio, Quesada, Costa, Magnusson, Schietti, Feldpausch, Brienen, Timothy, Chave and Álvarez2014; Muscarella et al. Reference Muscarella, Emilio, Phillips, Lewis, Slik, Baker, Couvreur, Eiserhardt, Svenning and Affum-Baffoe2020). We found only slight overall increase in annual rainfall and seasonal differences at KBFSC over the 20-year period. However, we found significant differences in population growth of Pinanga species, with one species (P. brevipes) significantly declining in abundance and another (P. tenella var. tenella) significantly increasing in abundance. These results seem similar to the assessment made over an 18-year period in Colombia where few palm species were found to have declined and some had expanded (Bernal & Galeano Reference Bernal and Galeano2006). An increased frequency of extreme events has been predicted consistently (Garcia et al. Reference Garcia, Cabeza, Rahbek and Araújo2014; Hijioka et al. Reference Hijioka, Lin, Pereira, Corlett, Cui, Insarov, Lasco, Lindgren, Surjan, Barros, Field, Dokken, Mastrandrea, Mach, Bilir, Chatterjee, Ebi, Estrada, Genova, Girma, Kissel, Levy, MacCracken, Mastrandrea and White2014; Deb et al. Reference Deb, Phinn, Butt and McAlpine2018). Kumagai et al. (Reference Kumagai, Kanamori and Yasunari2013) and Margrove et al. (Reference Margrove, Burslem, Ghazoul, Khoo, Kettle and Maycock2015) documented impacts of extreme events in Borneo in 1997–1998 and 2014. The results we obtained from KBFSC indicate episodic extreme rainfall events in 1998, post-drought associated with El Niňo and in 2014 associated with the onset of El Niňo. Pinanga tenella var. tenella is rheophytic and so most likely to be impacted by extreme flood events, and at one site this species completely disappeared (Dransfield Reference Dransfield1992).
In our study, two species declined in overall abundance over the 20 years, P. brevipes and P. aristata. Pinanga brevipes was the least abundant and lowest density species. Due to their small distribution ranges, many Pinanga species are likely threatened. Currently, seven species are listed as Critically Endangered (CR) and one species is listed as Endangered (Fernando Reference Fernando1994; Fernando & Cereno Reference Fernando and Cereno2000; Nair et al. Reference Nair, Mathew and Mohandas2001; Randi et al. Reference Randi, Hikmat and Heatubun2019; Zulkarnaen et al. Reference Zulkarnaen, Nisyawati and Witono2019; Bellot et al. Reference Bellot, Odufuwa, Dransfield, Eiserhardt, Sang, Pérez-Escobar, Petoe, Usher and Baker2020; IUCN 2021). Pinanga species small size and attractive foliage are making them an increasing target for horticultural collections. The previous genetic study of P. brevipes found moderate to low genetic diversity (Shapcott Reference Shapcott1999). The low density of the species populations combined with its monoecious reproductive mode makes this species potentially vulnerable to Allee effects that could further reduce its already small population size even if it is protected in reserves (Le Cadre et al. Reference Le Cadre, Tully, Mazer, Ferdy, Moret and Machon2008).
Understorey palm species have been shown to be sensitive to local conditions and local disturbance regimes that may impact demographic growth and lead to variation among populations and among years (Svenning Reference Svenning2001; Cibrián-Jaramillo Reference Cibrián-Jaramillo, Bacon, Garwood, Bateman, Thomas, Russell, Bailey, Hahn, Bridgewater and DeSalle2009; Sampaio & Scariot Reference Sampaio and Scariot2010; Widyatmoko Reference Widyatmoko2010; de Souza et al. Reference de Souza, Portela and de Mattos2018; Jansen et al. Reference Jansen, Zuidema, van Ast, Bongers, Malosetti, Martínez-Ramos, Núñez-Farfán and Anten2019). We found that population growth rates were variable among species and sites and were significantly positively correlated with the percentage of multi-stemmed plants. The ability of palms to clonally form multi-stemmed plants has been linked to longevity and enhanced population growth (Gamba-Trimiño et al. Reference Gamba-Trimiño, Bernal and Bittner2011).
Four of the five Pinanga species studied had evidence of pulsed population structures. The pulsed population structure and variability in growth rates observed may reflect local site variability. The formation of canopy gaps can lead to pulses of understory palm regeneration (Capers et al. Reference Capers, Chazdon, Redondo Brenes and Vilchez Alvarado2005; Martínez-Ramos et al. Reference Martínez-Ramos, Ortiz-Rodríguez, Piñero, Dirzo and Sarukhán2016). There was evidence of considerable canopy change observed during this study since 1998, such as loss of canopy trees, some of which may have been attributable to climatic fluctuations between drought and episodic rainfall events (Small et al. Reference Small, Martin, Kitching and Wong2004; Sukri et al. Reference Sukri, Wahab, Abu Salim and Burslem2012; Margrove et al. Reference Margrove, Burslem, Ghazoul, Khoo, Kettle and Maycock2015; Heckenhauer et al. Reference Heckenhauer, Abu Salim, Chase, Dexter, Pennington, Tan, Kay and Samuel2017). Other studies have documented evidence of episodic recruitment events in understory palms following the 1997–1998 ENSO event (Martinez-Ramos et al. Reference Martínez-Ramos, Anten and Ackerly2009; Gamba-Trimiño et al. Reference Gamba-Trimiño, Bernal and Bittner2011). The pulsed population structure found in these Pinanga species, however, contrasts with many other understory palms which have larger proportions of seedlings (Svenning Reference Svenning2001; Maschinski & Duqesnel Reference Maschinski and Duquesnel2006; Cibrián-Jaramillo Reference Cibrián-Jaramillo, Bacon, Garwood, Bateman, Thomas, Russell, Bailey, Hahn, Bridgewater and DeSalle2009; Sampaio & Scariot Reference Sampaio and Scariot2010). The populations of P. veitchii were the most variable among sites, and it differed from the other species in having a higher proportion of smaller sized plants. The population structure of P. veitchii was more similar to that found for P. javana by Zulkarnaen et al. (Reference Zulkarnaen, Nisyawati and Witono2019). Jansen et al. (Reference Jansen, Zuidema, Niels, Anten and Martínez-Ramos2012) found that persistent differences among individuals predicted differential growth and reproductive output in an understory palm. In our study, some individuals of P. veitchii, for example, have been both persistent between study years and contributed more to offspring as evidenced by local smaller plant clustering around these adult plants. The high levels of inbreeding in P. veitchii and other Pinanga species (Shapcott Reference Shapcott1999) support the concept of formation of family clusters from a few fertile individuals (Shapcott et al. Reference Shapcott, Quinn, Rakotoarinivo and Dransfield2012).
This study found evidence of spatial and temporal fluctuations of individuals within Pinanga palm populations over the 20-year period at local scales within sites suggesting some dispersal. The low reproductive output found in these Pinanga species contrasts with large fruit output reported for other understory palm species (Galetti et al. Reference Galetti, Donatti, Piries, Guimaräes and Jordano2006; Pizo & Almedia-Neto Reference Pizo and Almedia-Neto2009) but was within the range found for wild P. coronata populations (Kimura & Simbolon Reference Kimura and Simbolon2002). Berry et al. (Reference Berry, Gorchov, Endress and Stevens2008) found that dispersal of an understory palm enabled populations to persist and led to overall population growth. Some Pinanga species have been reported to be dispersed by civets, which disperse seeds over a wide area (Nakashima et al. Reference Nakashima, Inoue, Inoue-Murayama and Sukor2010a; Nakashima et al. Reference Nakashima, Inoue, Inoue-Murayama and Sukor2010b; Zulkarnaen et al. Reference Zulkarnaen, Nisyawati and Witono2019). Negative density dependence of seed dispersal has been demonstrated for some understory palm species (Jansen et al. Reference Jansen, Visser, Wright, Rutten and Muller-Landau2014). The low density and low reproductive output in these Pinanga species may facilitate frugivore dispersal. However, Galetti et al. (Reference Galetti, Donatti, Piries, Guimaräes and Jordano2006) found reduced seedling and juvenile populations in understory palms where there were lower populations of fauna responsible for dispersal.
The study found that most Pinanga species have maintained their overall population size in the region, but there was considerable variation from site to site and species to species in population growth or decline, suggesting reserves may not protect against population decline. The observations of the species spatial and size distributions indicated spatial movement, individual turnover and regeneration over the 20-year period. Climate change has not significantly impacted on moisture availability, but extreme climate events and variability may have both positive and negative impacts on the persistence of these five species. The results suggest that there is considerable dynamics in understory palm species populations that may be responsive to local conditions and extreme events that impact canopies and the ability to maintain populations by vegetative means may assist with population persistence.
Supplementary material
To view supplementary material for this article, please visit https://doi.org/10.1017/S0266467422000256
Acknowledgements
The authors thank the Brunei Forestry Department for permission to conduct research at the Ulu Temburong National Park (Ref: JPH/FORM-7(291)), and Universiti Brunei Darussalam for permission to conduct research at KBFSC. We thank the Institute for Biodiversity and Environmental Research, UBD for rainfall data for KBFSC. For the original project in 1997/1998, we thank Dr Kamariah Binti Hj Abu Salim and Dr John Dransfield (RBG Kew). We would like to thank the manuscript reviewers for their useful comments.
Financial support
For support and assistance, we thank UBD, IBER and KBFSC staff, in particular Hajah Masnah Binti Haji Mirasan, Dr Colin Maycock Muhammad Saleh bin Abdullah Bat, Rodzay Bin Abd Wahab, Dr Salwana Md Jaafar, and many local Iban field guides and assistants, notably Jali who assisted in 1997–1998 and 2018–2019 and Sawai in 2019.
Conflicts of interest
The authors have no conflicts of interest.


