


Introduction
Personal protective equipment (PPE) used during infectious disease control is often impermeable in nature to reduce possible contamination from pathogens and is used in many field environments, including in high heat and humidity. One such case was the use of fluid resistant or impermeable gowns or coveralls recommended by the Centers for Disease Control and Prevention (Atlanta, Georgia USA) and the World Health Organization (Geneva, Switzerland) during the Ebola outbreak in West Africa in 2014 where ambient conditions reached 32°C and 92% relative humidity (RH). 1 - 3 The addition of such PPE in hot and humid environments poses an additional burden to health care workers (HCWs) as normal thermoregulatory homeostasis is disrupted by impeding the body’s cooling mechanisms via evaporation, convection, and radiation. In a hot environment, the human body’s most effective physiological cooling mechanism is sweating, and thus causes evaporative heat loss to the environment. The addition of impermeable PPE reduces the evaporative potential of the sweat that forms on the skin. Personal protective equipment also poses a significant physical burden to the HCWs through the added weight of the ensemble. As a result, wearing impermeable PPE while in a hot and humid environment causes high physiological burden to the HCWs and increases risk for heat-stress-related injuries.Reference Havenith, den Hartog and Martini 4 - Reference Coca, Quinn and Kim 7
It was reported during the Ebola outbreak in West Africa that HCWs were limited to approximately 40 minutes of working time before requiring a break for rest and cooling due to the thermoregulatory burden.Reference Chertow, Kleine and Edwards 8 , Reference Wolz 9 This limited work period required frequent breaks in work, increased number of donning and doffing periods, larger quantity of single use PPE, and more HCWs present at one time in order to provide adequate care in the hot and humid environment. All of these factors create a large financial and logistical burden on the emergency response and infectious disease control efforts; therefore, strategies to increase working time and reduce heat stress for HCWs wearing impermeable PPE in hot and humid environments would be greatly beneficial.
The use of personal cooling devices (PCDs) underneath impermeable PPE and during exercise has been previously shown to reduce thermoregulatory strain and subjective perceptions of effort, potentially increasing working time of the HCWs.Reference Coca, Quinn and Kim 7 , Reference Chou, Tochihara and Kim 10 - Reference Quinn, Kim and Strauch 13 In this text, a PCD refers to a vest that includes a cooling medium such as ice packs, phase change material (PCM) packs, or water circulation hoses designed to cool the user in heat stress situations. While the physiological evaluation of PCDs worn underneath impermeable PPE recommended for use during the Ebola outbreak has been previously described in human subjects,Reference Quinn, Kim and Strauch 13 it is important to be able to evaluate such devices on a sweating thermal manikin. The sweating thermal manikin models human physiological responses in order to control for variation introduced by heterogeneous human subject sampling, increasing the repeatability of data collected, and reducing subject burden to heat stress in potential future evaluations.
Sweating thermal manikins have been previously shown to accurately evaluate dry and evaporative heat loss while wearing clothing at various temperature and humidity conditions.Reference Holmer 14 - Reference Holmér 16 Additionally, previous investigations have shown that sweating thermal manikin modeling provides meaningful information regarding human thermal physiology during rest,Reference Bogerd, Psikuta and Daanen 17 exercise,Reference Bogerd, Psikuta and Daanen 17 while wearing PPE,Reference Coca, DiLeo and Kim 6 , Reference O’Brien, Blanchard and Cadarette 18 and while using a PCDReference Bogerd, Psikuta and Daanen 17 , Reference Dionne, Makris and Semeniuk 19 - Reference Lai, Wei and Lu 24 during heat stress. Thermal manikin testing has been used extensively to measure heat removal rate of personal cooling systems; 25 however, the use of thermal manikin modeling to evaluate the physiological impact of PCDs has been given less attention, especially with comparisons to human subject data. While using a thermal manikin to test physiological responses to PCD use may be quicker and more convenient than human testing, limitations to using thermal manikin modeling may exist. Previous research has been conducted; however, it is still unclear if thermal manikin modeling will provide similar thermoregulatory characteristic data as human physiological testing provides in the same environment while wearing a PCD and PPE.
Thus, the purpose of this study was to examine the thermoregulatory and perceptual impact of four different PCDs under impermeable PPE during low-intensity exercise in a hot and humid environment using thermal manikin modeling. Secondly, this study worked to compare the results from the sweating thermal manikin to human physiological testing under the same conditions.
Methods
Study Design
This study compared human testing and simulation testing of four different PCDs under impermeable PPE during low-intensity exercise in a hot and humid environment. The human testing utilized a within subjects, repeated measures design to examine the perceptual and physiological effects of PCD use under impermeable PPE. The thermal manikin modeling was completed in a descriptive fashion, replicating the conditions and PPE used in the human testing for the purpose of results comparison.
Personal Protective Equipment
For all testing on both human subjects and for thermal manikin modeling, a standard PPE ensemble that was recommended for use in West Africa during the Ebola outbreak was used.Reference Coca, DiLeo and Kim 6 , Reference Coca, Quinn and Kim 7 The PPE ensemble consisted of: medical scrubs; socks and rubber boots; Tychem QC highly impermeable coveralls (DuPont; Wilmington, Delaware USA); Médecins Sans Frontières (MSF; Geneva, Switzerland) custom-made Tyvek hood with integrated splash-resistant surgical mask; rubber surgical apron; splash-resistant goggles; surgical nitrile inner gloves; heavy duty nitrile outer gloves; duckbill N95 filtering facepiece respirator (Kimberly Clark, model 46828; Irving, Texas USA); and a fluid-resistant surgical cap (Kimberly Clark, KCH69240). All PCDs were worn underneath the PPE but over standard medical scrubs.
Personal Cooling Devices
Four different PCDs were tested. The four PCDs consisted of different cooling materials (ice, PCMs, or circulating water) housed in a torso vest. The PCDs tested were all size medium, which fit all test subjects and the thermal manikin appropriately.
∙ PCD1: cotton vest shell with a thermal liner, four pockets (two in front, two in back) for four PCM cooling packs (34.25 cm x 15.25 cm). The ready to use weight was 2.78 kg.
∙ PCD2: polyester vest outer shell, mesh inner shell, 22 pockets for 22 PCM cooling packs (12.75 cm x 7 cm). The ready to use weight was 2.24 kg.
∙ PCD3: cotton shell vest, five pockets for five gel ice packs (34.25 cm x 12.75 cm). The ready to use weight was 2.78 kg.
∙ PCD4: cotton shell vest, tubing routed throughout vest, backpack with pump, battery, and semi-frozen water supply; PCD4 used a battery-operated pump to deliver cold water from a partially frozen reservoir of water through tubing within vest. The ready to use weight was 7.15 kg.
Thermal Manikin Modeling
A Newton Sweating Thermal Manikin (Thermetrics; Seattle, Washington USA) with 34 heat/sweat zones was used to test physiological and subjective perception responses to wearing PPE and PCDs. The manikin is controlled via ThermDac software running a RadTherm finite difference thermal analysis program (ThermoAnalytics, Inc.; Calumet Township, Michigan USA) to perform a Fiala thermoregulation model.Reference Fiala, Lomas and Stohrer 26 , Reference Fiala, Lomas and Stohrer 27 The manikin creates metabolic heat via the regulation model, which is influenced by both the environmental conditions and the clothing. Heat production is translated as estimated core temperature (Tc) and skin temperatures (Tsk) of the manikin and is averaged every minute. Global heat sensation (HS) is calculated as a function of the local Tsk and Tc.Reference Rugh and Lustbader 28 , Reference Zhang, Arens and Huizenga 29 Maximum sweating rate of the manikin is set at 30 g/min (1.8L/h), which is approximately the same as the maximum sweating capacity for a human body exercising at light-intensity while wearing impermeable PPE.Reference Sawka and Montain 30
For each PCD test, the manikin was dressed with the standard PPE ensemble and one of the four PCDs underneath (PCD1, PCD2, PCD3, or PCD4) or no PCD for control (CON). For all tests, the thermal manikin was housed in an environmental chamber set at 32°C and 92% RH to mimic worst case scenario conditions in West Africa during the Ebola outbreak. At the beginning of each test, the manikin was first initialized to “thermoneutral” conditions and then the thermal model was started. The thermal model was performed continuously at three metabolic equivalents (METs) for 60 minutes. Core temperature, Tsk, sweat rate, and HS were averaged every minute. Heat sensation was reported on a 4 to -4 scale (4=Very Hot, 0=Neutral, -4=Very Cold). To compare manikin sweat rate with the human weight loss parameter, manikin sweat rate was calculated as total grams lost over the total 60 minutes.
Human Testing
Six healthy males (age=23.3 [SD=1.9] years, height=1.8 [SD=0.1] meters, weight=75.1 [SD=10.3] kg, and Body Mass Index=22.2 [SD=2.3]) underwent written and verbal informed consent and completed a physical health screening by a licensed physician prior to participation in the study. Each subject was instructed to abstain from alcohol, caffeine, and strenuous exercise for at least 24 hours prior to their test visit. The study was approved by the National Institute for Occupational Safety and Health’s (NIOSH; Washington, DC USA) Institutional Review Board.
Each subject reported to the laboratory on five separate occasions, once for each condition: PCD1, PCD2, PCD3, PCD4, and CON. For each of the five conditions, subjects walked on a treadmill wearing PPE for 60 minutes at three METs (2.5 mph, 0% grade) in the same environmental conditions as the manikin testing (32°C and 92% RH). This procedure was repeated for the five conditions, with each test separated by at least 48 hours. All subjects provided verbal confirmation that they were not acclimated to exercise in the heat prior to testing. If pre-determined termination criteria were met during exercise (rectal temperature≥39.5°C; heart rate [HR]≥95% HRmax>two minutes; volitional fatigue [rating of perceived exertion≥19]; or subject’s desire to stop), the testing was stopped immediately and the subject was asked to complete the testing protocol for that same PCD on the next visit. It is of importance to note that absolute workload of 2.5 mph and 0% grade was used for all subjects as an estimate of three METs.Reference Ainsworth 31 When comparing the human data to the thermal manikin modeling data, it must be considered that the thermal manikin produces exactly three METs continuously.
Semi-nude weight (grams) was measured both before and after exercise to evaluate sweating weight loss throughout testing. Core temperature was monitored using a rectal thermistor (Model: REF-4491, YSI Temperature; Dayton, Ohio USA) inserted 13 cm beyond the anal sphincter. Skin temperature was measured using 2.54 cm diameter T-type (copper/constantan) thermocouples (Concept Engineering; Old Saybrook, Connecticut USA) that were placed on four body sites (upper chest, scapula, calf, and anterior thigh) with transparent dressing film (Tegaderm, 3M; St. Paul, Minnesota USA). Average Tsk was calculated using the standard International Organization for Standardization (Geneva, Switzerland) body site weighting formula: Tsk=0.3(upper chest) x 0.3(scapula) x 0.2(anterior thigh) x 0.2(calf).Reference Ramanathan 32 Subjective measurement of HS was measured at the start and end of exercise; HS was measured on the same 4 to -4 scale as the thermal manikin. 33 For more specific information regarding the human subject data collection methods used in this study, please refer to the previously published study by Quinn, et al.Reference Quinn, Kim and Strauch 13
Statistical Analysis
Core temperature and Tsk were calculated for mean and standard deviation for three time periods: start of exercise, 30 minutes, and 60 minutes of exercise. Two time periods were used for HS: start and 60 minutes of exercise. Two-way repeated measures ANOVA was used to determine main effects of time and condition for both the manikin and human tests individually. Paired sampled t-tests were performed to evaluate individual differences across conditions at the end of exercise within human and manikin tests individually. Significant differences of mean weight loss across PCDs were tested using a paired samples t-test. End exercise values of Tc, Tsk, and HS were compared between human and manikin tests in each condition using independent samples t-test. The alpha level was set at P<.05 for all tests, and all data are presented as mean (standard deviation).
Results
Core Temperature
Both the thermal manikin modeling and human physiological testing characterized the cooling performance of the four PCDs and the CON condition similarly. Both human and manikin testing found a significant effect of time (human: P≤.001, manikin: P≤.001) and condition (human: P≤.001, manikin: P=.013) in Tc. As seen in Figure 1, the CON condition resulted in the highest end exercise Tc, followed by PCD2, PCD1, PCD3, and PCD4 in descending order, in both the manikin and human testing. Post-hoc analysis of the human data showed that 60-minute Tc was higher in CON (38.86° [SD=0.42]) compared to PCD1 (38.26° [SD=0.34]; P=.004), PCD2 (38.42° [SD= 0.37]; P=.012), PCD3 (37.93 ° [SD=0.43]; P≤.001), and PCD4 (37.87° [SD=0.43]; P≤.001). Additionally, the human data showed that 60-minute Tc in PCD1 and PCD2 was significantly higher than in PCD3 (P=.013 and P=.020, respectively) and PCD4 (P=.004 and P=.006, respectively). Similarly, the manikin analysis showed that 60-minute Tc was higher in CON (38.89° [SD=0.27]) compared to PCD4 (38.19° [SD=0.05]; P=.032) and that 60-minute Tc in PCD2 was significantly higher than in PCD3 (P=.029) and PCD4 (P=.011).
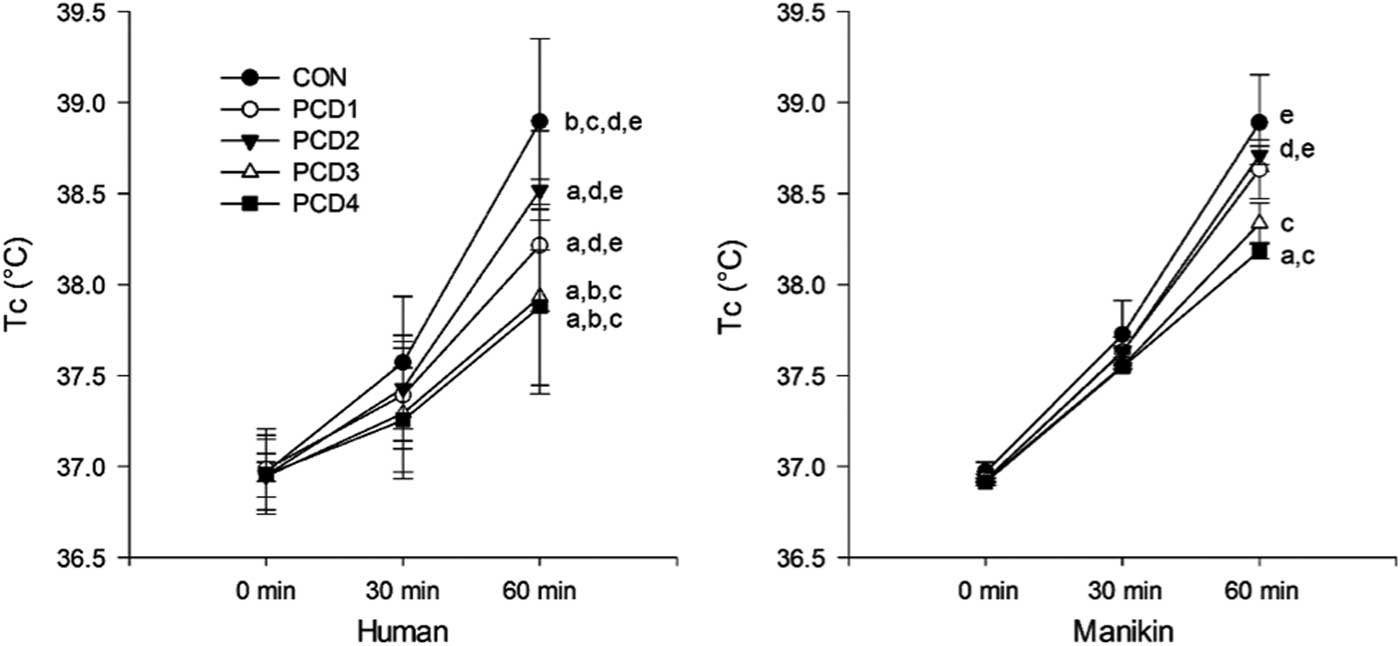
Figure 1 Core Temperature in Humans and Thermal Manikin. Note: Pairwise significance at end of exercise (P<.05); a=compared to Control, b=compared to PCD1, c=compared to PCD2, d=compared to PCD3, and e=compared to PCD4. Abbreviations: CON, control; PCD, personal cooling device; Tc, core temperature.
Table 1 shows a direct comparison of the end exercise Tc values between the humans and manikin to determine if the magnitude of Tc, as estimated by the manikin, is similar to that of the human measurements. Table 1 reveals that none of the end exercise values of Tc in any of the PCDs differed significantly at the end of exercise. It is important, however, to note that the non-significant difference between human and manikin values of Tc was consistently negative.
Table 1 End Exercise Comparison between Human and Manikin

Note: Data shown as mean (SD).
Abbreviations: CON, control; HS, heat sensation; PCD, personal cooling device; Tc, core temperature; Tsk, skin temperature.
a Difference column represents human minus manikin end exercise value.
b Significantly different than human.
Skin Temperature
In the measurement of Tsk, both the manikin and the human testing showed a significant main effect of time (human: P≤.001, manikin: P≤.001) but no effect of condition (human: P=.767, manikin: P=.075). Pairwise comparisons, shown in Figure 2, of the human data revealed that 60-minute Tsk in CON (36.70° [SD=1.05]) was higher than in PCD4 (35.260° [SD=0.84]; P=.048). Furthermore, end exercise Tsk in the humans was significantly higher in PCD2 (36.30° [SD=1.00]) and PCD3 (36.15° [SD=0.42]) than in PCD4 (P=.006 and P=.012, respectively). Post-hoc testing of the manikin data revealed that end exercise Tsk was higher in CON (38.07° [SD=0.15]) compared to PCD3 (37.33° [SD=0.15]; P=.014) and PCD4 (37.00° [SD=0.10]; P=.001). Additionally, with the manikin, Tsk was significantly higher in PCD2 (37.90° [SD=0.10]) compared to PCD4 (P=.016) and approached significance when compared to PCD3 (P=.051). Manikin Tsk at 60 minutes in PCD3 was significantly higher than in PCD4 (P=.038; Figure 2).
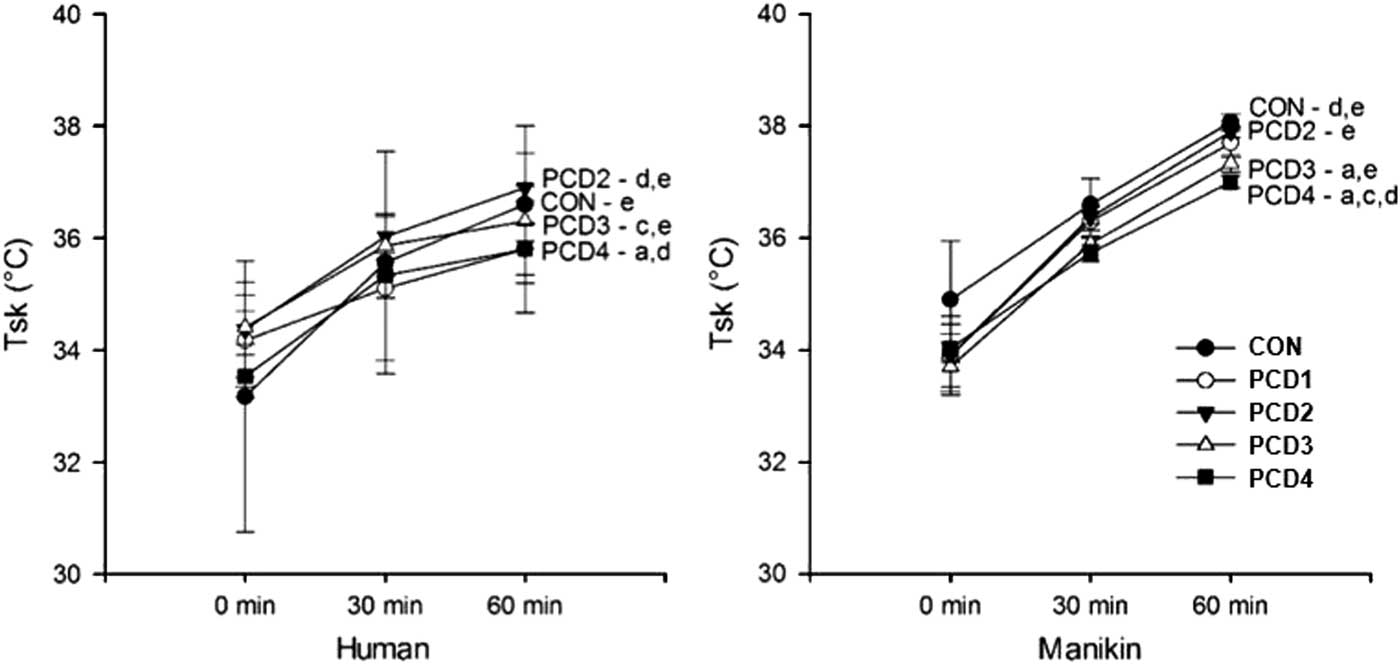
Figure 2 Skin Temperature in Humans and Thermal Manikin. Note: Pairwise significance at end of exercise (P<.05); a=compared to Control, b=compared to PCD1, c=compared to PCD2, d=compared to PCD3, and e=compared to PCD4.Abbreviations: CON, control; PCD, personal cooling device; Tsk, skin temperature.
The end exercise values shown in Table 1 show that the estimated end exercise Tsk from the manikin was significantly higher in all conditions compared to the human measurement (CON: P=.014, PCD1: P=.011, PCD2: P=.036, PCD3: P=.006, and PCD4: P=.014).
Heat Sensation
Figure 3 compares HS across all conditions in both manikin and human testing. Both the manikin and human testing were in agreement that HS increased over time (human: P≤.001, manikin: P=.021) and that HS was significantly affected by condition (human: P=.001, manikin: P=.024). Pairwise comparisons of the human data revealed that HS was significantly higher at the end of exercise in CON (3.83 [SD=0.41]) compared to PCD3 (2.67 [SD=0.52]; P=.013) and PCD4 (2.83 [SD=0.75]; P=.012). Additionally, 60-minute HS in humans during PCD1 (3.50 [SD=0.55]) and PCD2 (3.50 [SD=0.55]) was significantly higher than in PCD3 (P=.004 for both) and PCD4 (P=.025 for both). Similarly, in the manikin, end exercise HS was significantly higher in CON (1.57 [SD=0.23]) compared to PCD4 (3.53 [SD=0.25]; P=.009). Also, contrary to the human measurement, HS of the manikin at 60 minutes was significantly higher in PCD4 than in PCD2 (1.67 [SD=0.64]; P=.016) and PCD3 (1.97 [SD=0.45]; P=.019; Figure 3).

Figure 3 Heat Sensation in Humans and Thermal Manikin. Note: Pairwise significance at end of exercise (P<.05); a=compared to Control, b=compared to PCD1, c=compared to PCD2, d=compared to PCD3, and e=compared to PCD4. Abbreviations: CON, control; PCD, personal cooling device.
Table 1 directly compares the end exercise HS values between the manikin estimation and the human measurement during all conditions. Heat sensation was under-estimated in the CON condition (human: 3.8 [SD=0.4], manikin: 1.6 [SD=0.2]; P≤.001) and in PCD2 (human: 3.5 [SD=0.5], manikin: 1.7 [SD=0.6]; P=.003). However, end exercise HS did not differ in any other condition between the manikin and human testing (PCD1: P=.462, PCD3: P=.087, PCD4: P=.172).
Weight Loss
The comparison of weight loss between manikin and human testing across all conditions is shown in Figure 4. Paired samples t-tests revealed that, in the human testing, weight loss was significantly higher in CON (1338.3 [SD=361.2] grams) compared to PCD3 (1005.0 [SD=312.1] grams; P=.003) and PCD4 (906.7 [SD=260.8] grams; P=.012), with a difference approaching significance in PCD1 (1176.7 [SD=347.0] grams; P=.056). In the humans, weight loss in PCD1 and PCD2 (1255.0 [SD=310.9] grams) were both significantly higher than PCD3 (P=.039 and P=.003, respectively) and PCD4 (P=.040 and P=.004, respectively). The manikin data similarly revealed that CON (659.8 [SD=33.9] grams) had significantly higher weight loss than PCD1 (443.9 [SD=24.4] grams; P=.019) and PCD2 (492.2 [SD=49.4] grams; P=.017). However, no other significant differences in weight loss were found in the manikin testing, between conditions.

Figure 4 Weight Loss in Human and Thermal Manikin. Note: Pairwise significance at end of exercise (P<.05); a=compared to Control, b=compared to PCD1, c=compared to PCD2, d=compared to PCD3, and e=compared to PCD4. Abbreviations: CON, control; PCD, personal cooling device.
Table 1 compares weight loss between the manikin estimation and the human measurement. The manikin significantly under-estimated weight loss compared to the humans in CON (P=.016), PCD1 (P=.010), and PCD2 (P=.005). The manikin non-significantly under-estimated weight loss in PCD3 (P=.092) and PCD4 (P=.427). Furthermore, the characterization of the PCDs cooling effectiveness as measured by weight loss in the manikin differed compared to the human data.
Discussion
The current study worked to characterize the thermoregulatory and perceptual characteristics of four, commercially available, PCDs using both human physiological testing and thermal manikin modeling. Secondly, this analysis aimed to compare the human and manikin data to determine if the characteristics of PCDs could be similarly identified with both methods. Both the manikin modeling and human physiological testing provided similar results in Tc and HS in both magnitude and relationship. While the manikin and human data provided similar Tsk characterization, the magnitude of estimated Tsk by the manikin seems to be slightly over-estimated compared to the human measurement. Weight loss, as estimated by the thermal manikin modeling, was under-estimated when compared to the human measurement.
Both the manikin and human data are in agreement that all PCDs were effective in decreasing end exercise Tc as compared to wearing no cooling device. Additionally, the manikin and human data both show that the end exercise Tc is lowest in PCD4, with PCD3, PCD1, and PCD2 having higher end exercise Tc, written in ascending order. The manikin did not provide significant differences in 60-minute Tc when comparing PCD1 and PCD3 to the other conditions as seen in the human data. The manikin may not be as precise in determining smaller effects of PCD implementation on end exercise Tc. This result is of significance because it shows that thermal manikin modeling may provide an adequate estimation of Tc following exercise while wearing a PCD. Furthermore, the manikin model may provide valid information regarding which PCD may be most effective in mitigating an increase in Tc while working in a hot and humid environment and wearing impermeable PPE.
Previous research has shown that thermal manikin modeling provides an accurate estimation of Tc at 23.2°C ambient temperature with an agreement to humans within 0.6°C.Reference Rugh and Bharathan 34 Similar results comparing the manikin model to human data in 30.0°C were found with a more significant agreement of 0.1°C.Reference Rugh and Bharathan 34 While the previous study by Rugh, et al does not include use of a PCD, the results are comparable to this research which shows no difference in end exercise Tc between the humans and manikin with a maximum difference of 0.4°C. A slightly larger maximum difference of 0.4°C between the human and manikin data is shown in the current data compared to 0.1°C in previous work at 30.0°C.Reference Rugh and Bharathan 34 Previous conclusions suggest that higher temperature and humidity environments cause greater variability in Tc estimation by the manikin.Reference Rugh and Lustbader 28 These variations in the manikin data may exist due to either a delay in evaporative cooling compared to the programmed sweat rate or a software artifact caused by an irregularly rapid change in skin heat loss.Reference Rugh and Lustbader 28
Skin temperature, as estimated by the thermal manikin modeling, showed similar overall main effects of condition and time as the human measurement. Both the human and manikin data were in agreement that Tsk increased over time and that Tsk remained unaffected by PCD use. This finding is in conflict with a previous study that showed decreased Tsk with the use of a PCD.Reference Lai, Wei and Lu 24 However, a lighter activity level was tested and a different, hybrid-type PCD was used.Reference Lai, Wei and Lu 24 While the main effects in the two measurements were the same, end exercise Tsk values were consistently over-estimated by an average of 1.56°C compared to human measurement in all conditions. Skin temperature is an important determinant of heat stress in humans and is useful to accurately estimate the magnitude of Tsk increase in heat stress while wearing a PCD and impermeable PPE. When using a thermal manikin model to characterize PCDs, it must be considered that Tsk may be over-estimated.
The over-estimation of Tsk when using thermal manikin modeling has been previously reported in an ambient condition of 23.2°C with a maximum temperature deviation of 4.2°C.Reference Rugh and Lustbader 28 However, in a higher ambient temperature of 30°C, the manikin thermal model under-estimated Tsk.Reference Rugh and Lustbader 28 The current data are in agreement with the conclusions in an ambient condition of 23.2°C; however, the current data show a more mild maximum temperature deviation of 1.88°C. Interestingly, the current results disagree with the conclusion that the model may under-predict Tsk in higher ambient temperature conditions. Additional research was done using thermal modeling with a PCD which showed that Tsk responded as expected over time; however, the absolute magnitude of Tsk was inconsistent.Reference Rugh, King and Paul 22 This result is in agreement with the current findings as the manikin showed a similar pattern of Tsk over time compared to the humans; however, the magnitude of the Tsk was over-estimated in the current data. A previous publication has suggested that Tsk may be over-estimated in a thermal manikin model because the manikin is not walking, thus not creating wind while walking, as the humans were.Reference Rugh, King and Paul 22
The current study found that HS over time increased in both the manikin and human testing, with a significant difference by conditions. However, pairwise comparisons showed that HS in CON and PCD2 at the end of exercise were under-estimated. Of significance, the manikin greatly under-estimated HS in the CON condition. However, overall differences in HS values between the manikin and human testing seemed to show no distinct pattern of under- or over-estimation. Previous research has shown decreased HS with the addition of cooling onto the surface of the manikin when using the manikin modeling to determine thermal comfort with cooling car seats in a hot automobile.Reference Rugh and Lustbader 28 , Reference Rugh and Bharathan 34 The current results somewhat disagree with this conclusion as it seems that the current data are much less reliable in determining the magnitude of sensation change with the addition of the PCD and PPE in a hot environment. Another study showed that HS may be able to be measured accurately over time in a hot environment using thermal manikin modeling with no PCD.Reference Del Ferraro, Tombolini and Plebani 35 With these data taken together, it seems that the manikin modeling may be able to generally characterize HS changes over time with a PCD and PPE; however, highly precise differentiation in perceptual responses may not be as reliable.
Sweat rate in the current study was consistently under-estimated by the thermal manikin modeling compared to human measurement. Furthermore, the manikin was inaccurate in determining differences in weight loss between the PCDs. Pairwise comparisons revealed that the manikin showed a different pattern of weight loss characteristics across conditions compared to the human data. Determination of accurate weight loss from sweating is important when determining which PCD to use in a given situation as dehydration can negatively affect work performance and physical functioning. The finding of under-estimated sweat rate or weight loss with the manikin modeling is in agreement with the previous finding of Hepokoski, et al which concludes that thermal manikin modeling produces a lower overall sweat rate than humans.Reference Hepokoski, Gibbs, Curran and Coca 36
Overall, these data suggest that the effectiveness of differing types of PCDs in mitigating thermoregulatory and perceptual responses to heat stress can be accurately measured using both human physiological testing and thermal manikin modeling. However, several limitations to the estimated manikin values exist, including under-estimated sweat rate and over-estimated Tsk, as previously mentioned.
Different properties of the various PCDs tested allow for differing effective cooling times. While the effective cooling times were not tested in this investigation, future research should explore and quantify effective cooling times for various types of PCDs using thermal manikin modeling. Additionally, future investigations would benefit from utilizing longer testing times to mimic longer work shifts that are likely seen in actual occupational settings. Furthermore, future work needs to be done with the thermal manikin modeling software to allow better correlation of Tsk and sweat rate values between the thermal manikin model and human testing while using PCD. Steps are currently being taken with the manikin software company to correct the discrepancy in sweat rate.Reference Hepokoski, Gibbs, Curran and Coca 36
Strengths and Limitations
Strengths
This study showed several strengths that make it a worthwhile addition to the current body of literature in this field. First, the current study tested four different PCDs of various types to provide standardized and comparable information on a broad scale, considering the many commercially available PCD options. Secondly, this study provides a novel comparison of human data and thermal manikin modeling data using PCDs underneath PPE.
Limitations
The current study was limited in its external validity to translate these results to long work shifts as this test was only conducting for one hour in duration. Furthermore, this study design used an estimated three MET workload in humans derived from an absolute intensity to compare to an absolute intensity of three METs in the manikin. Third, the manikin was tested in a static posture while the humans were tested during treadmill walking. In this design, the manikin does not consider any changes in evaporation or heat loss due to air movement around the body. The manikin is also limited in its ability to consider the effect of weight differences in PCD and PPE configurations on energy expenditure.
Conclusions
Overall, these results demonstrate the effectiveness of PCDs worn in conjunction with impermeable PPE to mitigate increases in Tc, Tsk, HS, and weight loss. Differing characteristics of the PCD influence the magnitude of improvement in these variables. In high heat stress occupational settings, the use of a PCD under impermeable PPE may be effective in minimizing heat stress and reducing risk for heat-related injuries.
Evaluation of various types of PCDs worn under PPE can be effectively completed via human physiological testing and thermal manikin modeling. Thermal manikin modeling provides an accurate estimation of Tc and HS, while Tsk may be over-estimated and weight loss may be under-estimated. Physiological testing of differing types of PCDs in conjunction with PPE can be done more efficiently and economically with thermal manikin modeling to provide fast and accurate information to persons recommending or using PCDs.
Acknowledgements
The authors would like to acknowledge the study participants who generously volunteered their time to participate in this study.


