


INTRODUCTION
There are several radiation therapy options available to treat superficial lesions. In treatment of lesions <5 mm in depth, kilovoltage X-ray units were used and recently, high dose rate brachytherapy using either a low energy X-ray source (i.e., electronic brachytherapy) or a radionuclide has been prevailing. On the other hand, for deeper lesions (>5 mm in depth) such as localised skin cancer or boost volumes of breast or head and neck, electron beam therapy is a common option.Reference Das, Cheng and Healey 1
One approach to planning an electron beam treatment is to identify a target volume and to perform dose calculation on three-dimensional (3D) computed tomography (CT) images in a treatment planning system (TPS). Currently, most commercial TPSs use a pencil beam (PB) algorithm for electron dose calculation but PB algorithms are considered inaccurate for inhomogeneous tissues.Reference Gerbi, Antolak and Deibel 2 In contrast, stochastic algorithms such as a voxel-based Monte Carlo (MC) algorithm and a macro MC method show a great agreement with measurement, and have been implemented in commercial TPSs.Reference Gerbi, Antolak and Deibel 2 – Reference Xu, Walsh, Telivala, Meek and Yang 5 In treatment planning for electron beam therapy, energy and field size are usually chosen such that the target volume is encompassed within 90% of the prescribed dose or any other appropriate minimum dose.Reference Gerbi, Antolak and Deibel 2 The aimed target coverage can be ensured in accurately calculated 3D dose distributions. However, a stochastic dose calculation algorithm is not available in most clinics and those clinics, instead, use the approach to prescribing a treatment based on electron beam data in a clinical setup without 3D planning CT images.
Yet, target coverage in a clinical setup is not necessarily guaranteed. In current clinical practice of a clinical setup for skin cancer treatment, percent depth dose (PDD) curves are mainly used to determine electron beam energy and a prescribed depth. Field size is usually selected based on the size of a lesion on skin surface with an appropriate margin. For small or irregular shaped cutouts, output factors are measured and used for monitor unit (MU) calculations to take into account the change of dose at the central axis. On the other hand, isodose distribution and penumbra characteristics from profiles at the depth of interest, usually clinically relevant depths [i.e., R95 (distal depth of 95% maximum dose), R90, R85 and R80], are neglected and target coverage at those depths is not considered.
In low energy electron beams for skin cancer treatment, the surface dose is quite lower than maximum dose and thus, a tissue equivalent material such as bolus is commonly used to increase skin dose and consequently, to achieve target coverage in the treating lesion.Reference Khan, Doppke and Hogstrom 6 , Reference Demir, Okutan, Cakir, Gokel and Bilge 7 For example, at 6 MeV electron energy, the surface dose, defined at 0·5-mm depth on the central axis, usually ranges between 70 and 80% of maximum dose for 10×10 cm2 field size at 100 cm source-to-surface distance (SSD).Reference Gerbi, Antolak and Deibel 2 , Reference Demir, Okutan, Cakir, Gokel and Bilge 7 – Reference Arunkumar, Supe, Ravikumar, Sathiyan and Ganesh 9 With 0·5 cm bolus, the surface dose can be increased by >10% for the same energy.Reference Gerbi, Antolak and Deibel 2 , Reference Demir, Okutan, Cakir, Gokel and Bilge 7 To encompass a target volume within 90% isodose surface, therefore, bolus thickness should be considered in the selection of electron beam energy.
In this study, practical dosimetry lookup tables of electron beam PDDs and profiles were generated to ensure 3D target coverage in a clinical setup. Clinical application of these lookup tables was demonstrated for three skin cancer cases.
METHODS
Dosimetry lookup tables
Dosimetry lookup tables of electron beams for circular cutouts were created to treat relatively small lesions between 0·5 and 2·5 cm in depth in a standard SSD setup. First, PDD curves of 6 and 9 MeV electron beams were measured in water for a 10×10 cm2 open field at 100 cm SSD on TrilogyTM (Varian Medical System Inc., Palo Alto, CA, USA). Measurements were repeated for five cerrobend circular cutouts with diameters of 8, 7, 6, 5 and 4 cm in the 10×10 cm2 applicator. From the PDD data, dmax and four clinically relevant depths (R95, R90, R85 and R80) were determined for the 10×10 cm2 open field and each cutout. Second, cross-plane and in-plane profiles of 6 and 9 MeV electron beams were measured at the four clinically relevant depths. The cross-plane and in-plane are defined as the planes along a direction perpendicular to and parallel to the treatment couch, respectively.Reference Washington and Leaver 10 The width of isodose lines (IDLs) from profiles at the four depths was determined. Moreover, penumbra defined as the distance between 20 and 80% of maximum intensity was determined from each profile. The width of IDLs and penumbra were mean values taken from cross-plane and in-plane profiles at each depth. Lastly, at both electron energies, output factors for the five cutouts were measured in water as well as in solid water at dmax determined from the PDD curve for each cutout.
Case reviews
Clinical case reviews for skin cancer treatment were performed. Among skin cancer patients treated using electron beams in our institution, three patients who had suspicious inadequate target coverage were selected. For these three cases, detailed information of treatment such as type of tumour, tumour dimensions, prescribed dose, prescribed depth, energy, cutout size and bolus thickness were reviewed, and target coverage at the prescribed depths was evaluated based on dosimetry lookup tables created in this study.
RESULTS
Dosimetry lookup tables
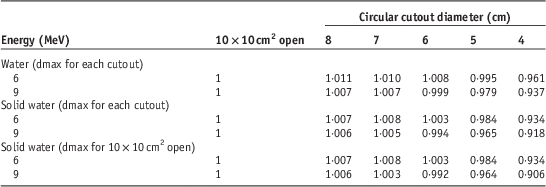
Dosimetry lookup tables created from electron beam data and cutout factors are shown in Tables 1–4. Table 1 lists PDD parameters (dmax, R95, R90, R85, R80, R50 and Rp) for the 10×10 cm2 open field and five circular cutouts for 6 and 9 MeV electron energies. Tables 2 and 3 list the width of IDLs and penumbra at four clinically relevant depths (R95, R90, R85 and R80), respectively. Table 4 shows output factors for the five cutouts measured in water and in solid water.
Table 1 Percent depth dose parameters (in centimeters) for a 10×10 cm2 open field and five circular cutouts for 6 and 9 MeV
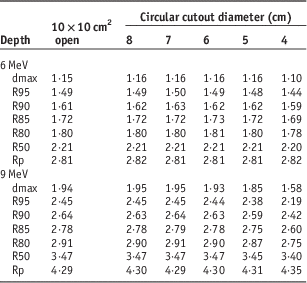
Table 2 Width of isodose lines (IDLs) (in centimeters) at clinically relevant depths for 6 and 9 MeV
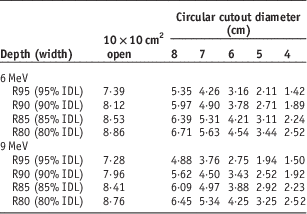
Table 3 Penumbra (in centimeters) at clinically relevant depths for 6 and 9 MeV
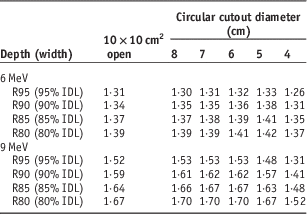
Note: Penumbra is defined as the distance between 20 and 80% of maximum intensity.
Abbreviation: IDL, isodose line.
Table 4 Output factors for five circular cutouts measured at dmax in water and in solid water at 6 and 9 MeV
Case reviews
For each clinical case, actual treatment and suggestion on target coverage based on the dosimetry lookup tables (Tables 1–3) are presented. All the patients were treated with a 6 MeV electron beam at 100 cm SSD in a clinical setup. Output factors measured in solid water at dmax determined from PDD data for the 10×10 cm2 open field were used for MU calculations.
Case no. 1
Treatment
Figure 1 shows squamous cell carcinoma (non-melanocytic skin cancer) with the largest dimension of 3 cm in scalp. A 4 cm circular cutout was selected, allowing for an about 0·5 cm lateral margin surrounding the lesion. A prescribed dose was 30 Gy in 5 fractions and 90% IDL was selected to treat the lesion up to 1 cm in depth from skin surface with 0·5 cm bolus. This prescription was based on PDD data for the 10×10 cm2 open field (Table 1) without taking into account isodose distributions at the depth of R90.
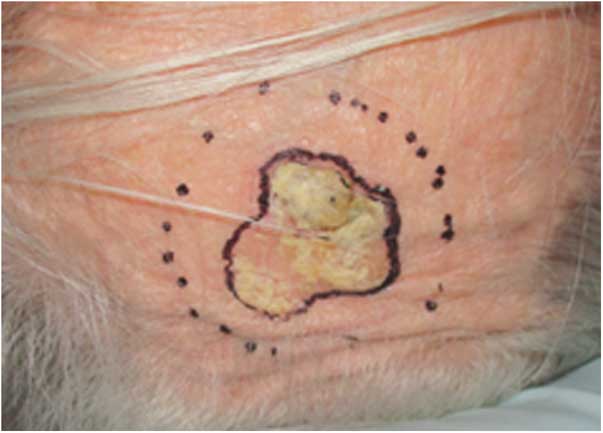
Figure 1 Squamous cell carcinoma in scalp treated with a 4-cm circular cutout using a 6 MeV electron beam.
Lookup table suggestion
For the 4 cm cutout, the depth covered by 90% IDL is 1·59 cm (Table 1), the width of 90% IDL at R90 is 1·89 cm (Table 2) and penumbra at R90 is 1·31 cm (Table 3). Hence, the treatment depth of 1·5 cm (1 cm of the lesion+0·5 cm of bolus) is fully covered by 90% IDL. However, at R90, the target including a 0·5 cm margin (i.e., 4 cm circular shape) is not fully encompassed within 90% IDL. To cover the target sufficiently at R90, a cutout with at least a 7-cm diameter should be used (Table 2).
Case #2
Treatment
A patient who had basal cell carcinoma (non-melanocytic skin cancer) of 3 cm in length and 1 cm in depth in left cheek was treated with 66 Gy in 33 fractions prescribed at 95% IDL. A 5 cm circular cutout and 0·5 cm bolus were used.
Lookup table suggestion
For the 5 cm circular cutout, the depth covered by 95% IDL is 1·48 cm (Table 1), the width of 95% IDL at R95 is 2·11 cm (Table 2) and penumbra at R95 is 1·33 cm (Table 3). Thus, the treatment depth of 1·5 cm (1 cm of the lesion+0·5 cm of bolus) is marginally covered by 95% IDL. In addition, the target including a 0·5 cm margin (i.e., 4 cm circular shape) is not fully enclosed by 95% IDL at the depth of R95. For sufficient target coverage at R95, a cutout with at least a 7 cm diameter should be used (Table 2).
Case no. 3
Treatment
A mycosis fungoides patient who had the largest dimension of 5 cm in left orbit was treated with 20 Gy in 10 fractions prescribed at 80% IDL. The lesion was about 1·3 cm in depth from skin surface. A 6 cm circular cutout and 0·5 cm bolus were used.
Lookup table suggestion
For the 6 cm cutout, the depth enclosed by 80% IDL is 1·81 cm (Table 1), the width of 80% IDL at R80 is 4·54 cm (Table 2) and penumbra at R80 is 1·41 cm (Table 3). Therefore, the treatment depth of 1·8 cm (1·3 cm of the lesion+0·5 cm of bolus) is enclosed by 80% IDL but the target with a 0·5 cm margin (i.e., 6 cm circular shape) is not fully encompassed within 80% IDL at R80. A cutout with at least an 8-cm diameter should be used (Table 2).
DISCUSSION
Current clinical practice of a clinical setup for electron beam therapy poses a challenge in ensuring target coverage. In a clinical setup for skin cancer treatment, IDL-based prescription is fairly common to deliver a prescribed dose or higher between skin surface and the depth of interest. As shown in the clinical case reviews performed in this study, however, conventional prescription based on PDD data only does not guarantee adequate target coverage at the prescribed depth. For all the reviewed cases, relatively small cutout sizes (4–6 cm) were used, and even the longest dimensions of gross tumour volumes (GTVs) were not fully covered by prescribed IDLs and part of the GTVs fell into penumbra regions (Figure 2). In general, the region encompassed by 80–90% IDLs is significantly narrower than the volume enclosed by the geometric field size defined by an electron cone or applicator due to reduction of lateral scatter.Reference Das, Cheng and Healey 1 This effect becomes prominent for small fields because the degree of electronic equilibrium decreases with decreasing field size.Reference Das, Cheng and Healey 1 , Reference Khan, Doppke and Hogstrom 6 , Reference Podgorsak 11 In addition, the width of IDLs decreases as depth becomes shallower because a higher IDL at a shallower depth encloses a smaller volume (Table 2 and Figure 2). Therefore, PDD data are not sufficient to ensure target coverage at the depth of interest.
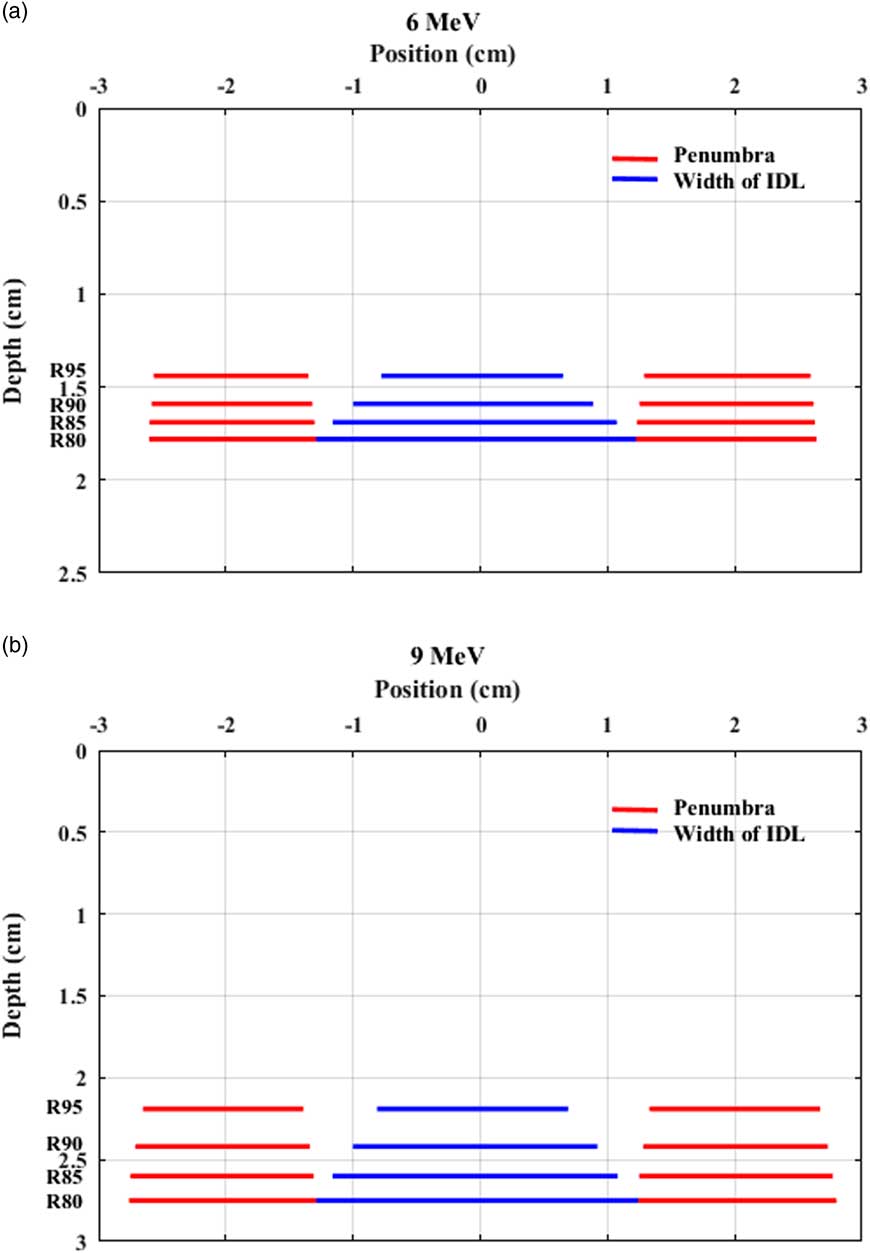
Figure 2 Width of isodose lines (IDLs) and penumbra at clinically relevant depths for a 4 cm cutout for (a) 6 MeV and (b) 9 MeV. The area enclosed by an IDL is the region to receive the prescribed dose or higher.
Dosimetry lookup tables for a clinical setup should contain profile parameters as well as PDD parameters. The American Association of Physicists in Medicine Task Group 70 recommends that outputs, central axis PDDs and profiles at dmax as well as at a clinically relevant depth be measured to ensure adequate tumour coverage especially for small and restricted fields.Reference Gerbi, Antolak and Deibel 2 It would be cumbersome to measure PDDs and profiles for each customised cutout. However, circular cutouts are commonly used for skin cancer electron therapy and therefore, outputs, PDDs and profiles at depths such as R80 and R90 for circular cutouts are usually measured during electron beam commissioning.Reference Zhang, Liengsawangwong and Lindsay 12 Nevertheless, dosimetry lookup tables commonly used for a clinical setup usually contain PDD parameters and output factors for standard field sizes, but do not include profile parameters. The generation of profile parameters at clinically relevant depths from commissioning data would not be a difficult task and lookup tables containing profile parameters can be converted to graphs (Figure 2) which are also conveniently used in clinic. As profiles at all clinically relevant depths or profiles at all extended SSDs are not necessarily acquired during electron beam commissioning,Reference Zhang, Liengsawangwong and Lindsay 12 , Reference Cygler, Li, Ding and Lawrence 13 additional data might need to be acquired if necessary.
Output factors measured in water at dmax determined for each cutout need to be included in dosimetry lookup tables. In current clinical practice, output factors are usually measured in solid water at dmax determined for a reference open field (e.g., 10×10 cm2). In this study, first, output factors measured in water at dmax for each cutout were compared with those measured in solid water at dmax for each cutout. Output factors in water were higher than those in solid water but the difference was <3% (Table 4). Although the difference was ≤0·5% for cutout size ≥6 cm at both energies, the differences were increased to 1·1% (6 MeV) and 1·4% (9 MeV) for the 5 cm cutout, and 2·8% (6 MeV) and 2·0% (9 MeV) for the 4 cm cutout. Second, output factors measured in solid water at dmax for each cutout were compared with those measured in solid water at dmax for the 10×10 cm2 open field. At 6 MeV, the change of dmax was <1 mm for all the cutouts (Table 1) and thus, the output factors measured at dmax for the 10×10 cm2 open field were the same as those at dmax for each cutout (Table 4). At 9 MeV, the change of dmax was <1 mm for the cutouts ≥5 cm but dmax shifted towards the surface by 3·6 mm for the 4 cm cutout (Table 1). Hence, output factors differed by <0·2% for the cutouts ≥5 cm, whereas for the 4 cm cutout, the difference was 1·3% (0·918 versus 0·906 in Table 4). When the output factor (0·937) measured in water at dmax for the 4 cm cutout was compared with that (0·906) measured in solid water at dmax for the 10×10 cm2 open field, the difference was larger (3·3%) (Table 4). As a rule of thumb, the minimum radius of a circular field to achieve lateral scatter equilibrium within 2% at all depths is
 $0.88\sqrt {\overline{{E_{0} }} } $
where
$0.88\sqrt {\overline{{E_{0} }} } $
where
 $\overline{{E_{0} }} $
(mean energy in MeV at the surface of the phantom) is
$\overline{{E_{0} }} $
(mean energy in MeV at the surface of the phantom) is
 $\overline{{E_{0} }} {\equals} 0.656{\plus}2.059R_{{50}} {\plus}0.022R_{{50}}^{2} $
and R
50 (cm) is the depth of 50% maximum dose.Reference Gerbi, Antolak and Deibel
2
,
Reference Khan, Higgins, Gerbi, Deibel, Sethi and Mihailidis
14
From R50 data in Table 1, the mean energies at surface for 6 and 9 MeV are 5·3 and 8·1 MeV, respectively, and the corresponding minimum radii (diameters) to achieve lateral scatter equilibrium are about 2 cm (4 cm) and 2·5 cm (5 cm). If small cutouts (<4 cm at 6 MeV and <5 cm at 9 MeV) are used, therefore, caution should be taken in prescribing a treatment using PDD data and in measuring output factors. The best clinical practice would be to measure output factors in water at dmax determined for each cutout during electron beam commissioning, to generate lookup tables and to use them for MU calculations.
$\overline{{E_{0} }} {\equals} 0.656{\plus}2.059R_{{50}} {\plus}0.022R_{{50}}^{2} $
and R
50 (cm) is the depth of 50% maximum dose.Reference Gerbi, Antolak and Deibel
2
,
Reference Khan, Higgins, Gerbi, Deibel, Sethi and Mihailidis
14
From R50 data in Table 1, the mean energies at surface for 6 and 9 MeV are 5·3 and 8·1 MeV, respectively, and the corresponding minimum radii (diameters) to achieve lateral scatter equilibrium are about 2 cm (4 cm) and 2·5 cm (5 cm). If small cutouts (<4 cm at 6 MeV and <5 cm at 9 MeV) are used, therefore, caution should be taken in prescribing a treatment using PDD data and in measuring output factors. The best clinical practice would be to measure output factors in water at dmax determined for each cutout during electron beam commissioning, to generate lookup tables and to use them for MU calculations.
Lookup tables containing PDD and profile parameters should be provided to clinicians. The lookup tables will allow clinicians to prescribe a treatment correctly, to accurately determine clinically useful field width at the depth of interest for a clinical setup, and consequently, to ensure 3D target coverage. Especially the clinics, which do not have a stochastic dose calculation algorithm and prefer a clinical setup without 3D dose calculations, will benefit from these simple and practical dosimetry lookup tables.
CONCLUSIONS
Retrospective case reviews on skin cancer electron therapy revealed that current clinical practice using PDD data only in prescribing a treatment for a clinical setup does not guarantee adequate target coverage on the transverse plane at the depth of interest. To ensure target coverage in a clinical setup without an accurate 3D dose calculation algorithm, isodose distribution and penumbra characteristics from profiles at clinically relevant depths (R95–R80) should be included in dosimetry lookup tables.
Acknowledgements
None.
Financial support
None.
Conflicts of Interest
None.


