


1. INTRODUCTION AND BACKGROUND
The advent of Automated Identification System (AIS) data collection allows for the analysis of the navigational characteristics of vessels, both individually and in aggregate, and has been made possible by the development of methods, procedures, and technologies as described in AISM-IALA (2004). Many recent studies have used AIS data for the analysis of marine safety including Chen et al. (Reference Chen, Lu and Peng2015); Copping et al. (Reference Copping, Breithaupt, Whiting, Grear, Tagestad and Shelton2015); Rawson and Rogers (Reference Rawson and Rogers2015); Rong et al. (Reference Rong, Teixeira and Guedes Soares2015); Shelmerdine (Reference Shelmerdine2015); Xiao et al. (Reference Xiao, Ligteringen, van Gulijk and Ale2015); and Zhang et al. (Reference Zhang, Goerlandt, Montewka and Kujala2015). The AISM-IALA guidelines include static and dynamic data fields that are either automatically provided, such as the ship's position and date-time stamp, or are input by ship masters for each voyage, such as the ship's draught and destination (AISM-IALA, 2004).
Examination of AIS data that extend over large areas is challenging due to the large size of the data sets. AIS data from the US collected over a three year period (2010–2012) totalled approximately 25 × 109 individual AIS records. The examination and analysis of AIS data has used two general methods: density methods and trajectory methods. Shelmerdine (Reference Shelmerdine2015) demonstrated the density method by examining vessel activity using density plots of AIS locations (called heat maps). The trajectory method was used in Goerlandt and Kujala (Reference Goerlandt and Kujala2011), Goerlandt et al. (Reference Goerlandt, Montewka, Ravn, Hänninen and Mazaheri2012) and Kujala et al. (Reference Kujala, Hanninen, Arola and Ylitalo2009) for analysis of vessel activity. While heat map data can provide useful information on vessel locations and intensity of activity, analyses of vessel routes is best served by vessel trajectory analyses, since both direction and intensity of activity can be determined. The trajectory approach is followed in this study.
AIS data may contain individual records that are incorrect or missing (Kujala et al., Reference Kujala, Hanninen, Arola and Ylitalo2009), or the data may require cleaning prior to analysis (Van Dorp and Merrick, Reference Van Dorp and Merrick2011; Goerlandt and Kujala, Reference Goerlandt and Kujala2011; Copping et al., Reference Copping, Breithaupt, Whiting, Grear, Tagestad and Shelton2015; Rong et al., Reference Rong, Teixeira and Guedes Soares2015). The authors of this study noted both issues with AIS data when examining the 2010 through 2012 AIS data from the Atlantic coast of the US. Gaps in the time series of AIS data for individual vessels presented a particularly vexing problem; we attributed these gaps either to a vessel being out of range of AIS transceivers or shipboard AIS transmitters being switched off by vessel masters. Considerable effort was needed to address the missing data and time gaps to compile a useful dataset for analysis.
This study was initiated by concerns for maritime traffic and safety, due to the potential installation of offshore wind farms planned for development along the Atlantic coast of the US as presented in Copping et al. (Reference Copping, Breithaupt, Whiting, Grear, Tagestad and Shelton2015). This paper focusses on the route delineation component of that work. Wind Energy Areas (WEAs) have been proposed in the Atlantic by the US Department of Interior to focus development of wind farms on the Outer Continental Shelf; several WEAs lie in close proximity to traditional vessel traffic routes along the coast. The usage, designation, and process for establishing WEAs can be found at: http://www.boem.gov/Renewable-Energy-Program/Renewable-Energy-Guide/Offshore-Wind-Energy.aspx.
This study used guidance on route definition from the UK as provided in DTI (2005), which states “…as a minimum the route width should accommodate 95% of all traffic transiting each route…” DTI (2005) also recommends that the route width encompass +/-2 standard deviations of the traffic between two locations, which implies that a known distribution (such as a normal distribution) is appropriate to describe the transverse positions of vessels. This is shown in this study to be inappropriate, at least for uncontrolled regions. Consequently, the 95% boundary was utilised to delineate route boundaries in this study.
This study presents the methods, results, and analysis of commercial vessel routes delineated along the Atlantic Coast with a focus on cargo vessels and on routes between ports along the Atlantic coast of the US. It also examines a few key characteristics of the delineated routes and the transverse distribution of vessels across a route. A brief discussion of uncertainties in the analysis is provided to indicate possible directions of future data needs and research.
2. RELEVANT LITERATURE
While there are challenges to handling large sets of AIS data that contain errors in individual AIS data records, the collection and availability of AIS data makes the scientific analysis of vessel traffic possible. This study used the aggregation of individual vessel trajectories for route delineation and analysis. Similar approaches to AIS data analysis have been used in several recent studies of marine vessel safety. In the Gulf of Finland, Montewka et al. (Reference Montewka, Krata, Goerlandt, Mazaheri and Kujala2011), Goerlandt and Kujala (Reference Goerlandt and Kujala2011) and Montewka et al. (Reference Montewka, Goerlandt and Kujala2012) analysed AIS to determine traffic lanes. Goerlandt and Kujala (Reference Goerlandt and Kujala2011) examined one year of AIS data (2006) and grouped vessel trajectories from similar departure and arrival harbours into routes. Chen et al. (Reference Chen, Lu and Peng2015) analysed AIS data to develop fairway boundaries in the Taiwan Strait and included an examination of seasonal variation in spatial usage of the fairways.
Analysis of spatial distributions of vessels within route boundaries generated from AIS data is frequently reported in studies of marine safety (Christensen, Reference Christensen2006; Goerlandt and Kujala, Reference Goerlandt and Kujala2011; Shu et al., Reference Shu, Daamen, Ligteringen and Hoogendoon2012; Silveira et al, Reference Silveira, Teixeira and Guedes Soares2013; Rong et al, Reference Rong, Teixeira and Guedes Soares2015; Rawson and Rogers, Reference Rawson and Rogers2015; Xiao et al, Reference Xiao, Ligteringen, van Gulijk and Ale2015). In these studies, lateral distributions were generally found to fit or be approximated by normal distributions. Shelmerdine (Reference Shelmerdine2015) used AIS data from a single land-based receiver on the Shetland Islands, determined point data density and vessel track densities from GIS analyses, and examined the seasonal variability of point densities.
The study of marine safety has been made via simulation methods using randomized paths from AIS delineated routes (Goerlandt and Kujala, Reference Goerlandt and Kujala2011; Van Dorp and Merrick, Reference Van Dorp and Merrick2011; Qu and Meng, Reference Qu and Meng2012; Sormunen et al., Reference Sormunen, Goerlandt, Häkkinen, Posti, Hänninen, Montewka, Ståhlberg and Kujala2013; Goerlandt and Kujala, Reference Goerlandt and Kujala2014). Other studies have used direct examination of collision potential from AIS data (Debnath and Chin, Reference Debnath and Chin2010; Weng, et al, Reference Weng, Meng and Qu2012; Goerlandt and Kujala, Reference Goerlandt and Kujala2014; Mulyadi et al., Reference Mulyadi, Kobayashi, Wakabayashi and Pitana2014; Zhang et al., Reference Zhang, Goerlandt, Montewka and Kujala2015), which would be expected to reduce randomisation errors in routes with complex configurations. However, direct examination does not readily allow for predictions in scenarios with route modifications, as might occur with the placement of WEAs in existing routes.
An important issue not frequently discussed is the inclusion of uncertainty in safety analyses (Sormunen et al., Reference Sormunen, Goerlandt, Häkkinen, Posti, Hänninen, Montewka, Ståhlberg and Kujala2013; Goerlandt and Kujala, Reference Goerlandt and Kujala2014). Goerlandt and Kujala (Reference Goerlandt and Kujala2014) expressed concern about the validity of safety analyses if the uncertainties are not understood and ultimately quantified. In this paper, uncertainties in the analysis are discussed.
3. METHODS OF ANALYSIS
The AIS data analysed in this study were obtained from the US Coast Guard (USCG) for all commercial vessels that travelled the waters of the US over the period 2010 through 2012. Note that only data associated with cargo vessels are discussed in this study. Based on our examination, the AIS data were found to have been collected at a minimum time interval of <1 minute, though frequently longer intervals were evident. This study focused on the development and examination of three primary sets of data: individual vessel voyages; vessel voyages in aggregate to delineate typical routes; and transverse vessel distributions in delineated routes.
For route delineation, this study used a vessel voyage analysis approach, which de-convoluted the vessel tracks generated from the AIS data. Figure 1 summarises the methods used in this study. The details are provided in the following subsections. A vessel voyage was defined as the collection of AIS points obtained from a single vessel track that were ordered by time and which indicated the spatial path that the vessel travelled as it made its way from one location to another. The computation of the route boundaries for a particular combination of ports of origin and destination used the 95% boundary definition in DTI (2005). The transverse distribution of vessels across a route was also examined.

Figure 1. Flow chart summarising the route delineation analyses. Only cargo vessels were examined in this study.
3.1. Initial analysis of AIS data
The first step in the route delineation analysis was the processing of AIS data. The USCG provided raw AIS data for the years 2010–2012, with data from military vessels removed, for all coastal and inland US waters.
The AIS data were processed into individual vessel tracks that were aggregated into seven vessel types (cargo, tanker, towing, passenger, fishing, other, and unknown). No AIS ship type was provided in the 2010 and 2011 data, so the vessel type was determined from the USCG AVIS database in combination with AIS identifiers (Maritime Mobile Service Identity, MMSI), International Maritime Organization number, call sign, and name). The AIS data from 2012 were provided with AIS ship type identifiers so no additional processing was needed to categorise the vessel type.
The focus of this study was the Atlantic coast of the US, so the spatial domain extended from the southern tip of Florida to the US-Canada border; AIS data outside the region were eliminated. AIS records for individual vessel tracks were processed to filter out data at time intervals shorter than one-minute (Figure 1). A one-minute interval was chosen to provide a reasonably accurate representation of vessel motion while reducing the volume of the AIS data. The resulting tracks for cargo vessels illustrate the complex and visually chaotic nature of maritime traffic off the Mid-Atlantic US coast (Figure 2). Following generation of vessel tracks, the AIS records landward of the mouths of the Atlantic ports were also eliminated, so that only seaward AIS data were included in the route delineation analysis.

Figure 2. Cargo vessel tracks following the processing of raw AIS data and aggregation by vessel type during the period 2010 through 2012 along the Mid-Atlantic coast of the US.
3.2. Sampling of AIS vessel tracks
The AIS cargo vessel tracks (Figure 2) were sampled at transects (Figure 3) developed for this study to aid the analysis of route delineation. Transects were first placed across entrances to bays, harbours, and port entrances leading to major ports. For the purpose of this study 25 ports and port entrances were identified. A partial list is provided in Table 2. Next, additional transects were placed radiating concentrically around the entrances to form a sampling web. Third, transects were added further out at sea to sample tracks of vessel transiting between ports while the vessels followed essentially direct paths typically without significant deviations. Where a vessel track intersected a transect, the intersection was considered as a sample for that vessel, with the transect identification and vessel location, heading, and velocity stored for later analysis of vessel voyages and to compute vessel routes.

Figure 3. Transects used for sampling AIS vessel tracks along the Atlantic coast. The inset shows a concentric web of transects around the entrance to Chesapeake Bay. Specific transects discussed in this study are identified.
3.3. Vessel voyage analysis
The vessel track data were parsed into three voyage categories: (1) two-port voyages (port-to-port), (2) one-port voyages, and (3) no-port voyages. Generally the categorisation was based on the presence (or lack) of an AIS data sample at port entrance transects. We categorised a voyage as a two-port voyage if a sample was available from port entrance transects at both endpoints of the voyage. We categorised a voyage as one-port if it began or terminated with a sample at only one port entrance transect, with the other end terminating at some arbitrary location. A voyage was categorised as no-port if no samples were available at port entrance transects.
As previously noted, time gaps in the vessel track data were identified and attributed to vessels leaving the domain, turning off their AIS systems, entering a port, or losing contact with a receiver. For this study, we specified that a time gap in a voyage lasting less than 24 hours was considered only a break in a voyage, while for longer time gaps (>24 hours) we specified the location of the end of the gap as the starting location of a new voyage. Because voyages were started and/or stopped when a vessel track crossed a port entrance, even short port calls (less than 24 hours) would not be misidentified and included as a continuous voyage. We also found that some vessels lie at anchor at locations seaward of busy port entrances, as identified in vessel tracks rotating about a fixed point. If a vessel spent longer than 24 hours at anchor near a port entrance, we assumed the voyage was terminated at the port entrance. Following time-gap and anchor-time processing, we were left with a clean set of voyage data, which were used for further analyses.
3.4. Route boundary delineation
A primary goal of this study was to delineate the vessel routes between ports along the US Atlantic coast. Following the guidance of DTI (2005), we computed route boundaries that encompassed 95% of the vessel traffic of the port-to-port voyage data. Use of the one-port voyages and the no-port voyages was problematic for this purpose, because there was no clear port of origin and/or destination. The first step of the analysis was to arrange the sampled points in a consistent spatial order along each transect. Then the 2·5-percentile and 97·5-percentile sample points (bracketing 95% of the sampled vessels and defining the route boundary points of the transect) were found using a computer algorithm that processed all transects. It should be emphasised that these 95% route boundary points did not represent a confidence interval but indicated the width within which 95% of the vessels travelled along that portion of the route.
To create a polygon bounding a port-to-port route, ArcGIS was used to connect the 95% route boundary points of all the relevant transects via a concave hull function. Figure 4 shows examples of 95% route boundary polygons for two heavily travelled routes. The development of the polygons is discussed in more detail in Section 4.1.

Figure 4. Example routes with large number of voyages and 95% boundaries during the period 2010 through 2012. (a): Chesapeake - Newark/New York (4,660 voyages); (b) Newark/New York – Charleston (930 voyages).
To compute the 95% route boundary points, at least 20 vessel voyage sample points were needed from the three years of available AIS data. If 25% of the transects within a route had between 10 and 20 sample points, a 90% route boundary was calculated instead using the same procedures to find the 5-percentile and 95-percentile sample points. Routes with any transects that had fewer than ten sample points were eliminated from further analysis.
4. RESULTS AND DISCUSSION
The analysis of AIS vessel tracks focuses on two areas: route delineation and transverse vessel distribution across selected routes. As discussed in Section 3.4, the route delineation was based on 95% (or 90%) boundary polygons. The transverse vessel distributions were derived from the sampling of vessel tracks at individual transects.
4.1. Route delineation
From the initial track aggregation (Figure 1), we obtained the number of active commercial vessels, which were found to be similar during each of the three years (Table 1) with cargo vessels, which are the focus of this study, making up almost half the commercial vessel traffic. We noted that the duration for which a vessel was active in the offshore waters of the Atlantic coast was highly variable, with some individual vessels represented in the AIS data for only a short period of time, while other vessels appeared multiple times during a year.
Table 1. Number of active commercial vessels identified from AIS data.

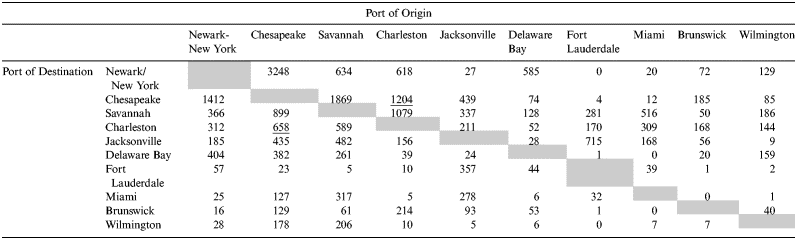
Examination of the number of voyages originating and terminating at each port entrance indicated the traffic flow between ports (Table 2). Table 2 shows cargo vessel voyage counts at port entrances with a minimum of 500 or more cargo vessel voyages to all ports during the 2010 through 2012 period. Ports with smaller traffic volumes are not provided. The traffic between Charleston and Chesapeake is an example of a moderate level of traffic, with 1,204 cargo vessels traveling from Charleston to Chesapeake Bay during the analysis period, and 658 traveling the reverse direction from Chesapeake Bay to Charleston during the same period. This was a combined vessel travel between Charleston and Chesapeake of 1,862 vessel voyages. The most heavily travelled route for cargo vessels was between Newark/New York and Chesapeake Bay, with a total of 4,660 cargo voyages.
Table 2. Counts of cargo vessel voyages between ports with more than 500 vessel voyages originating at a port entrance during the period 2010 through 2012. The grey cells would be for voyages that originate and terminate at a single port, which are not included in the analysis. The table is sorted by the port of destination from the largest total count (not shown) of cargo traffic to the smallest. Underlined values correspond to the example discussed in the text.
As previously noted, routes with large numbers of vessel voyages were best suited for route delineation based on 95% of the vessel traffic. The results for two routes with large cargo traffic volumes are presented here: Chesapeake - Newark/New York (Figure 4(a)) and Newark/New York – Charleston (Figure 4(b)). As seen in Figures 4(a) and 4(b), the 95% boundaries encompass the bulk of the vessel traffic, with a number of vessel voyages outside the boundary, as expected. For the Chesapeake - Newark/New York route 233 voyages (5% of 4,660 total vessel voyages) fell outside the 95% boundary. For the Newark/New York - Charleston route 46 voyages (5% of 930 total vessel voyages) fell outside the 95% boundary. The widths of both these routes are in the order of 50 nm, which is relevant when considering the placement of offshore structures, like windfarms. Within the Newark/New York route boundary, the track densities were greater than 100 per km2 (Figure 4(a)), while within the Newark/New York - Charleston route boundary, the track densities were generally in the range of 20 to 50 per km2 (Figure 4(b)).
For routes with traffic volumes that only allowed a computation of the 90% route boundary, the track densities were low, in the order of two tracks per km2 or less. Examples included the Palm Beach – Jacksonville (Figure 5(a)) and Newark/New York – Port Canaveral (Figure 5(b)) routes. (Note; data for Figure 5(b) was interpolated for a portion of the route because of a lack of AIS data along the south Atlantic Coast). The Newark/New York - Port Canaveral had 11 voyages total, just meeting the minimum criteria for route delineation.

Figure 5. Example routes with small number of voyages and 90% boundaries during the period 2010 through 2012. (a): Palm Beach - Jacksonville (14 voyages); (b) Newark/New York - Port Canaveral (11 voyages). Because there were fewer than 100 cargo voyages that originated along the Newark/New York – Port Canaveral route, it was not included in Table 2.
The de-convolution of the AIS data into vessel voyages using the approach shown in Figure 1 facilitated the examination of individual routes between ports. It was expected that the route delineation results should reproduce (or at least approximate) the complexity of the original data prior to processing. The overlay of all the delineated cargo vessel routes (Figure 6) shows the essential complexity of the marine traffic along the mid-Atlantic Coast is maintained when compared with individual vessel tracks as shown in Figure 2. In comparison with the apparent chaos of the vessel tracks (Figure 2) the routing analysis provided a partitioned set of routes for analysis of the marine transportation system and provides a clearer picture where vessels generally travel between pairs of ports (e.g., Figures 4 and 5).

Figure 6. Overlay of delineated cargo vessel routes (concave hull boundaries) along the Atlantic coast of the US that originate or end at the following ports during the period 2010 through 2012: (a) Newark-New York. (b) Delaware Bay. (c) Chesapeake Bay. The shading for each route indicates the count of vessels found in the route delineation analyses.
4.2. Transverse vessel distributions within routes
The transverse distributions of vessels in delineated routes can provide insight into navigational characteristics along the route, especially for routes with large volumes of traffic (such as the examples in Figure 4). Traffic analyses have used a normal distribution across traffic lanes (e.g., Christensen, Reference Christensen2006; Kujala et al., Reference Kujala, Hanninen, Arola and Ylitalo2009; Goerlandt and Kujala Reference Goerlandt and Kujala2011). Visual examination of Figure 4(a) suggested that vessel distributions along the Chesapeake - Newark/New York route may not be normally distributed. To ascertain the general shape of the transverse distributions, we examined the distribution at selected sampling transects for the Chesapeake - Newark/New York route and the Charleston - Newark/New York route. Samples from transects at the Newark/New York entrance and at Mid-Atlantic 13 (Figure 3) were used in the analysis of both routes, which allowed comparison between the two routes. For the Chesapeake - Newark/New York route, we also examined the Chesapeake 005 and the Chesapeake port entrance transects, while for the Charleston - Newark/New York route, we also examined the South Atlantic 040 and the Charleston port entrance transects.
The distributions for both routes are shown in Figures 7 and 8 and include the total distribution as well as the two directional distributions. The Newark/New York entrance transects were found to have similar widths (total, inbound, and outbound) and positioning of inbound and outbound maximums, for both routes (Figures 7(a) and 8(a)), which is expected because the Traffic Separation Scheme (TSS) enforced a traffic pattern for vessels entering and exiting the port entrance. However, looking at the transect Mid-Atlantic 13 (Figures 7(b) and 8(b)), the distributions of the two routes become more dispersed, less similar in shape, and multi-modal. Note that because the Mid-Atlantic 13 transect is the same for both routes, there is some overlap of the transverse distributions (Figure 7(b) and 8(b)).

Figure 7. Cargo vessel distributions along the Newark/New York – Chesapeake route. (a) Newark/New York entrance transect (4,645 voyages). (b) Mid-Atlantic 13 transect (4,667 voyages). (c) Chesapeake 005 transect (4,223 voyages). (d) Chesapeake entrance transect (4,755 voyages).

Figure 8. Cargo vessel distributions along the Newark/New York - Charleston route. (a) Newark/New York entrance transect (931 voyages). (b) Mid-Atlantic 13 transect (912 voyages). (c) South Atlantic 040 transect (592 voyage). (d) Charleston entrance transect (932 voyages).
The multimodal distributions for transects located in the open ocean (Figures 7(b),(c) and 8(b),(c)) suggested there were preferred vessel trajectories followed by vessels once they leave the vicinity of the coast. For the Newark/New York to Chesapeake route, these preferred vessel trajectories were not associated with the direction of travel (Figures 7(b),(c)) since they were evident for both directions. However, for the Newark/New York - Charleston route there was a clear separation between the directions (Figure 8(b),(c)), with the trajectories of the Charleston-bound vessels lying to the west of the Newark/New York bound vessels. From these findings, we note that an assumption of normal distribution may be correct in controlled regions (port entrances for example), but when vessels travelled the open ocean, the distributions were clearly not normal (Figures 7(b),(c) and 8(b),(c)).
5. CONCLUSION
The AIS data and vessel tracks along the Atlantic coast of the US exhibit a high degree of complexity reflecting the transit of open ocean water by approximately 15,000 vessels annually between multiple ports of call. Using vessel trajectory methods, we processed the AIS data into individual vessel tracks, sampled the tracks to obtain vessel voyages, separated out the port-to-port voyages, and re-aggregated the relevant sets of voyage data to compute and delineate route boundaries. An important factor in the route delineation analysis was the volume of vessel traffic between ports. Of the 625 possible combinations, we found that 295 routes had enough cargo vessel traffic to delineate a route boundary using the 95% (or 90%) criteria. For this study, the route delineation results support a better understanding of the vessel utilisation of the regions of the ocean between ports. Future offshore wind power infrastructure needs to consider the effect of the installation and operation of wind farms on marine traffic, especially if farms are placed near or within existing marine traffic routes.
Route boundaries were calculated based on the sample data from transects placed along the Atlantic Coast of the US. This approach resulted in boundaries that were continuous but not smooth, and in some cases had boundary lines changing abruptly at transects. Further refining of the analysis method might be helpful in smoothing the vessel route boundaries. A possible analytic method could be an iterative, transect-sampling analysis, in which the first iteration identifies all the tracks for each port-to-port combination, and subsequent iterations increase the number of transects to improve the resolution of route boundaries. The method might also be improved to smooth the boundaries by utilising two-dimensional analytical methods. However, the 2D methods investigated for this study tended to rely on point or track density and no clear method was found for use in the development of a boundary that encompassed 95% of the vessel traffic.
The transect-based sampling of AIS vessel tracks provided a straightforward approach to evaluate the transverse distributions of vessels across routes. For the routes examined, we found the distribution of vessel tracks closely approximated a normal distribution at port entrances, with inbound and outbound vessel traffic separated. However, for the Chesapeake Entrance, we found the inbound distribution to be bimodal, though the reason cannot be readily determined from the sampled data.
A particular striking feature of transverse distributions along transects in the open ocean was their multi-modal character, indicating a preference for separate lanes (locations with higher occurrence of cargo vessels) within individual routes. Lanes of traffic within the Chesapeake-Newark/New York route appeared to have a greater width than found in the Charleston-Newark/New York route, which might reflect the greater volume of traffic. For the Chesapeake-Newark/New York route, the distribution of vessels was independent of the direction of travel, that is, the vessels were comingled with no separation based on travel direction. For the Charleston- Newark/New York route, the distribution of vessels in the open ocean was clearly separated by direction of travel, and relatively narrow traffic lanes were apparent.
It might be expected that the transverse distributions in the open ocean would be uniform with no preference shown for particular lanes of travel, or that the distribution might be normal with some degree of skew towards either edge of the route. However, the presence of lanes of travel within the routes suggests a preference for repeatedly travelling along the same course/trajectory, especially since the distributions were developed from three years of data with several hundred to several thousand voyages. The lanes of travel may be due to the presence of bathymetric (shoals) or surface (light/buoys) features, or may indicate the preferences of ship masters to follow a particular course as the shortest course between ports. Maritime risk analyses using simulation methods and randomised vessel voyages derived from within delineated routes must be cognizant of bathymetric and/or surface features within the delineated routes to prevent unrealistic vessel trajectories. Rather than conduct simulations, another approach taken by is to directly utilise the AIS track data for marine risk analyses as was done by Goerlandt and Kujala (Reference Goerlandt and Kujala2014), Weng et al. (Reference Weng, Meng and Qu2012), Debnath and Chin (Reference Debnath and Chin2010), and Zhang et al. (Reference Zhang, Goerlandt, Montewka and Kujala2015).
With the presence of these preferred lanes of travel within a route, a general assumption that vessel distributions across routes is normally distributed is probably invalid, except perhaps in well controlled TSSs, port entrances, or defined channels within harbours. The significance of this comes into play when trying to understand the potential responses by ships' masters to wind energy infrastructure as offshore wind farms encroach into traditional routes. Additional research could help in understanding the formation of the lanes and elucidate what might happen in the presence of offshore wind farms that force vessel traffic patterns shoreward or seaward.
The importance of estimating uncertainty of inputs and methods on vessel safety analyses has been noted by Sormunen et al. (Reference Sormunen, Goerlandt, Häkkinen, Posti, Hänninen, Montewka, Ståhlberg and Kujala2013) and Goerlandt and Kujala (Reference Goerlandt and Kujala2014). Several uncertainties have been acknowledged in this study. The first of these is the limitations of AIS data, including vessels missing from the AIS data set, intermittent or sparse coverage, and the presence and handling of time gaps in vessel voyages. In this study, missing voyages (one-port and no-port) from the route delineation analyses, due to limitations in the AIS data, is a component of uncertainty. The AIS data can be considered a sample of the actual vessel activity along the Atlantic coast. Another type of uncertainty pertains to the methods (essentially route definitions) used to delineate route boundaries, which could encompass 95%, 90%, or ±2 standard deviations of the vessel routes. As noted, these uncertainties are areas for further research. However, even with uncertainty in the analyses, the results from these route delineation analyses can still provide useful information, since one gains understanding of the system and provides a direction into which additional research is needed.
ACKNOWLEDGEMENTS
This work was supported by the US Bureau of Ocean Energy Management (BOEM) (contract number M14PS00036). We wish to acknowledge the US Coast Guard and BOEM for providing AIS and AVIS data and the valuable assistance of Molly Grear of PNNL in data processing.


