
The development of markets is often seen as a harbinger of modern economic growth or specifically the Industrial Revolution (Chilosi and Federico Reference Galor2015; Christopoulos and Tsionas Reference Jacks2004; Epstein Reference Epstein2000; Jacks Reference Jacks2005; Keller and Shiue Reference Keller and Shiue2007; Persson Reference Persson2010; Rodrik, Subramanian, and Trebbi Reference Jacks2004; among others). China diverges from Europe in this regard, which presents a puzzle. By the early-to-mid-eighteenth century, while market performance in China appeared to be at least comparable to that in Western Europe, English markets outperformed even the most advanced areas of China (Pomeranz Reference Pomeranz2000a; Shiue and Keller Reference Bochove2007). But by extending the panel of data observations beyond 1800 to cover a period of 175 years (c. 1736–1910), there is evidence for a robust U-shaped pattern of market integration in China.Footnote 1 We use the speed at which markets adjusted to shocks, estimated with a Band Threshold Autoregressive (Band-TAR) model, as our main measure of integration, finding that, after peaking around the mid-to-late eighteenth century, China’s grain market began to disintegrate, and it remained so for well over a century until around the mid-to-late nineteenth century, when markets trended toward greater integration. This helps resolve, to a certain extent, the puzzle of why Europe experienced an overall trend toward a more integrated market in its march toward the Industrial Revolution (e.g., Chilosi et al. 2013), whereas China simply ran out of steam.Footnote 2
While conventional studies of market integration have seldom considered population dynamics to be an important determinant, the fact that China’s grain markets began to resume their integration only after the largest demographic catastrophe (viz. the Taiping Rebellion of 1851– 1864)Footnote 3 left 73 million people dead suggests that the relationship between population growth and market integration deserves closer examination. Using a fixed-effects model, we find that the relationship between population growth and market integration as covered in our period (1736– 1910), is on the whole negative. Specifically, a 100 percent increase in population density for a prefecture will lead to a 0.025–0.027 reduction in the distance-weighted average speed of adjustment for that prefecture, which then is translated into 39.7–40.2 percent when evaluated at the mean of market integration in late imperial China. Given that the population actually increased by approximately 200 percent during 1741–1851, this would mean that market integration fell by a colossal 80 percent. Our result is robust to the alternative regression using gaps in grain price between pairs of trading prefectures as the dependent variable for market integration and their differences in average population growth as the independent variable.Footnote 4 Our regressions also include controls for alternative drivers of market integration, including transport and communications changes, weather shocks, war, and the introduction of transit taxes.
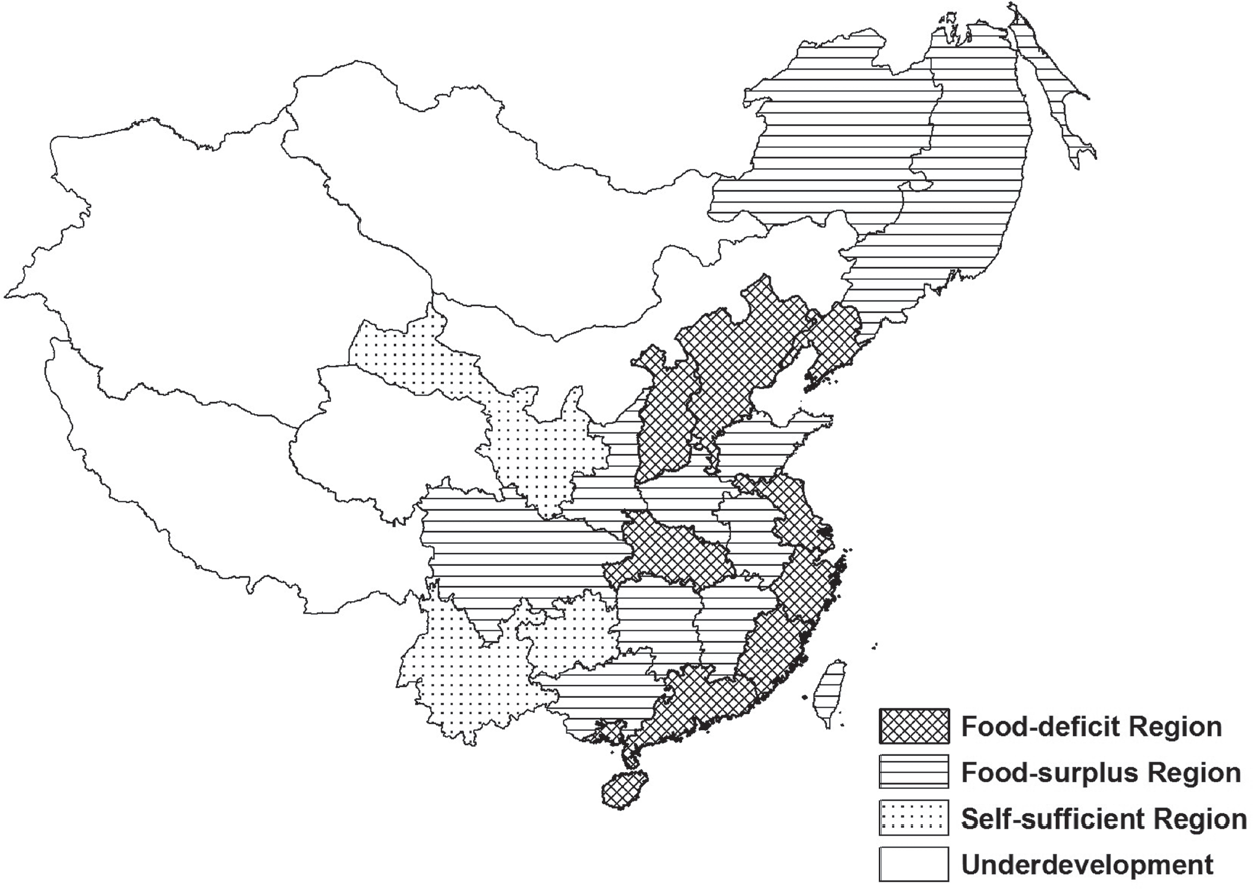
We explain that under a Malthusian regime, unchecked population growth would likely reduce the grain surplus available for trade, thereby retarding the development of markets. To look into this mechanism, we divide late imperial China into three distinct regions according to whether they were deficient in grain, self-sufficient, or able to produce a surplus based on grain prices and other historical considerations. Doing so reveals that the negative relationship is significant only for the grain-surplus region, which is consistent with Pomeranz’s (Reference Pomeranz2000b) conjecture that this kind of region may have experienced a higher rate of population growth and thus led to a notable decline in the grain trade. Pomeranz’s conjecture is consistent with our finding that the bottleneck lay squarely on the supply side. Moreover, to ensure that regions previously producing a grain surplus would also export it accordingly, we use a panel data set to examine the role of population growth in grain trade between and within the provinces, using grain price to identify the importers and exporters. Consistently, we find that only population growth in the exporting prefectures has a significantly negative effect on market integration, regardless of whether it was long-distance trade between the provinces or shortdistance trade within the same province. Our finding is supported by the conjecture made by Pomeranz (Reference Pomeranz2000b) and others (e.g., Skinner Reference Skinner and William Skinner1977a, 1977b; von Glahn Reference Von Glahn2016) that the more developed lower Yangtze region and its middle and upper counterparts experienced a decline in grain trade between them from around the mid-eighteenth century onwards.
Our focus on the role of population growth in determining market integration does not imply that other factors are unimportant. In fact, we do find that both technological progress and the decline of political trade barriers had a positive effect on market integration, as many others have also found (e.g., Andrabi and Kuehlwein 2010; Findlay and O’Rourke Reference Findlay, O’Rourke, Michael, Alan and Jeffrey2003; Jacks Reference Jacks2006; Keller and Shiue Reference Keller and Shiue2014). In particular, the introduction of the steamboat, which was widely adopted in domestic trade (Yan Reference Yan1955), had significantly improved market integration in the second half of the nineteenth century, whereas the likin tax—a political barrier of sorts, had wittingly led to a decrease in market integration after the Taiping rebellion.Footnote 5 Both of these factors are, however, secondary to the pivotal role played by population dynamics in affecting the way the grain markets in China developed.
Our study contributes to studies of market integration. First, the identification of a U-shaped pattern between population growth and market integration in late imperial China inspires us to incorporate the role played by population dynamics—rather than the costs of transportation and institutions—in market integration. By focusing on the relationship between population dynamics and market integration, our study provides fresh empirical evidence with which to contrast the European experience that markets continued to integrate into the march toward the Industrial Revolution, thereby shedding new light on the differing trajectories between China and Europe from the perspective of market performance. While Europe also experienced population growth in the sixteenth and seventeenth centuries, it continued to develop along the Smithian path, whereby the population increase had the virtuous effect of deepening specialization instead of disintegrating markets. The difference between China and Europe in this regard might be due to the varying degrees of population growth, but this comparative analysis goes beyond our present scope. Second, the fresh empirical evidence presented by our study supports the theory that in a Malthusian world, “positive checks” (i.e., events that shortens the human life span) such as the Taiping Rebellion are an effective means to restrict population growth (see, e.g., Clark Reference Clark2007; Galor Reference Galor2011; Galor and Weil Reference Galor and Weil2000).
The remainder of this paper is organized as follows. We begin in the second section by introducing the data on grain prices, followed by examining the patterns of market integration in late imperial China for the extended period 1736–1910 using the Band-TAR model. Additionally, we also calculate the coefficients of correlation to test for price co-movements and Weir’s (1989) R index to test for price variance. In the third section, we analyze the association between population growth and market integration. In the fourth section, we examine the underlying mechanism through which population growth influenced market integration in late imperial China. The fifth section provides a brief conclusion.
MEASURING MARKET INTEGRATION IN HISTORICAL CHINA
Grain Price Data
Following other studies of market integration, we similarly use monthly grain price to estimate market integration in late imperial China, which we obtain from two sources. The first is based on a data set on grain prices in the Qing Dynasty, published by the Institute of Modern History in Taiwan (Wang Reference Gu2009). This particular source contains monthly grain prices at the prefectural level—a level of administration between the province and the county—from 1736 to 1911. Our second data source comes from the Grain Price Series of 1821–1911 (Qingdai Daoguang Zhi Xuantong Jian Liangjiabiao) edited by the Chinese Academy of Social Science (2010). Both sources are based on the same grain price reporting system put in place by the Qing emperors, and so the two are compatible. These price data are based largely on the same high-quality sources as in Keller, Shiue, and Wang (Reference Albers, Pfister and Uebele2018), who showed diverging capital market integration over time. We then constructed a data series of monthly grain prices covering a total of 226 prefectures in 17 provinces from 1736 to 1910 (Table 1).Footnote 6 This is a highly representative sample, as it covers approximately 90 percent of the total population in China during the eighteenth and nineteenth centuries with broad geographic coverage (Figure 1). Merging the two data sets provides us with approximately 400,000 observations, with each prefecture consisting of an average of 1,652–1,959 observations.Footnote 7 A summary of China’s grain price data for the period 1736–1911 is provided in Table 1. Wheat and rice (including indica rice) are the two main staple crops in China. Footnote 8 To ensure comparability, we use caloric content as the weight to calculate a weighted average of the grain price in each prefecture. For example, using the price of firstgrade rice as numeraire, wheat has a caloric content of 317 kilocalories per 100 grams, rice 346, and indica rice 328. We then employ the average price of these various grain crops for calculating the grain price index.

Figure 1 SAMPLE SELECTION
Note: Map of China in 1820.
Data Source: CHGIS, Version 4 Cambridge: Harvard Yenching Institute, January 2007.
Table 1 SUMMARY OF CHINA’S GRAIN PRICE DATASET, 1736–1911

Notes: 1Grain prices for Yunnan during 1858–1878 are missing. 2Grain prices in Shaanxi during 1836-1909 are missing. 3Only five prefectures in Zhili province, namely Chengde, Hejian, Yizhou, Xuanhuan, and Zhunhua, have observations before 1764.
Sources: Wang (2009); the Chinese Academy of Social Science (2010).
Empirical Results Based on the BAND-TAR Model
Economic historians study market integration from two perspectives. The first is price convergence, which assumes that prices must be equal everywhere in perfectly integrated markets. It is believed that the degree of price convergence depends on the decline in transaction costs resulting from improvements in transportation, such as the development of railroads and steamboats. The other is market efficiency, which captures the speed of adjustment to shocks. Efficiency is a function of the degree of market transparency, the state of information technology (such as telegraph), market structure, and so forth. In this paper, we focus on the second perspective, primarily because in China technological improvements such as those in transportation came rather late—either towards the end of the Qing dynasty in the case of steamboats (Xu Reference Xu1992) or after its collapse in the case of railroads (Yan Reference Yan1955).
According to Federico (Reference Dobado-Gonzãlez, Garciã-Hiernaux and Guerrero2012), market efficiency can be measured by co-integration tests, co-movement tests, and variance tests. In particular, co-integration tests allow us to test whether arbitrage in the market can return the price differential between markets to its equilibrium level after a shock hits. A common approach employed in co-integration tests is an error-correction-mechanism (ECM) specification, which provides valuable information about the process of price adjustment. However, the ECM specification fails to satisfy the condition that transaction costs are positive. Hence, to the extent that price differentials are lower than transaction costs, prices will move freely within the bands without any arbitrage between markets. The ECM specification will thus cause a negative bias in estimating the speed of adjustment, with the size of the bias increasing with the size of the commodity price band. The Band-TAR model can more realistically measure the speed of price adjustment as well as yielding an estimate of transaction costs.Footnote 9 Given this advantage, the Band-TAR model has become a popular method for examining market efficiency in co-integration tests—a method we will employ in our analysis that follows.Footnote 10 To briefly summarize, the Band-TAR model estimates a set of coefficients capturing the speed of adjustment to a market shock. The absolute value of their sum will equal zero in the case of no integration and one (or less) in the case of perfect integration. A higher value suggests a more rapid adjustment of prices and a higher degree of integration between the two markets.
Additionally, we will also employ both price co-movement and variance tests to check robustness. To test for price co-movements, we use the first difference of grain prices to calculate the coefficients of correlation. This “detrending” exercise is important for reducing the upward bias in the estimate of market efficiency because, even for perfectly disjoint grain markets, shared monetary trends (be it inflation or deflation) will create positive correlations among them (Weir Reference Weir, Walter and Schofield1989). We thus use Weir’s (1989) R index, which is formulated for exactly that purpose:
 $\[R = \frac{{\frac{{Var(national)}}{{\sum {_iVar({p_i})/{n^2}} }} - 1}}{{(n - 1)}},\]$
where Var(national) is the variance of the detrended series of national prices, which we obtained by taking the simple average of all (prefecturallevel) grain prices, Var(pi) represents the variance of the i-th detrended series of prices, and n is the number of markets. Weir (Reference Weir, Walter and Schofield1989) argues that, under conditions of perfect market integration, prices will synchronize across markets, which means that the variance in price across markets would converge to the variance of a single national price. In short, the R index would be equal to one. In contrast, where the market is not integrated, the R index would be equal to zero. Thus, the higher the R index is, the higher the degree of market integration would be.
We begin by employing the Band-TAR model to estimate the speed of grain price adjustment between pairs of Chinese prefectures in the 23 subperiods each of a 15-year duration (e.g., 1736–1750, 1751–1765, and so on) for the entire 1736–1910 period. Figure 2 reports the average half-life by distance, which can be interpreted as the average time taken for grain price to get adjusted toward the equilibrium price after experiencing a shock. The higher the half-life, the slower the speed of price adjustment. We include distance because the longer distance would not only decrease arbitrage opportunities due to higher transport costs, it also increases the time to transport grain from the exporters to importers, thereby decreasing the speed of price adjustment. As Figure 2 indeed shows, China’s grain market became less integrated from the eighteenth century onwards (as indicated along the vertical axis), a trend that continued into the early nineteenth century. Having reached its nadir around the 1820s–1840s, grain markets in China rebounded and resumed their forces of integration, so much so that by the second half of the nineteenth century, market integration climbed back to the level it attained around 1736. In other words, China experienced a robust U-shaped pattern of market integration during 1736–1910.
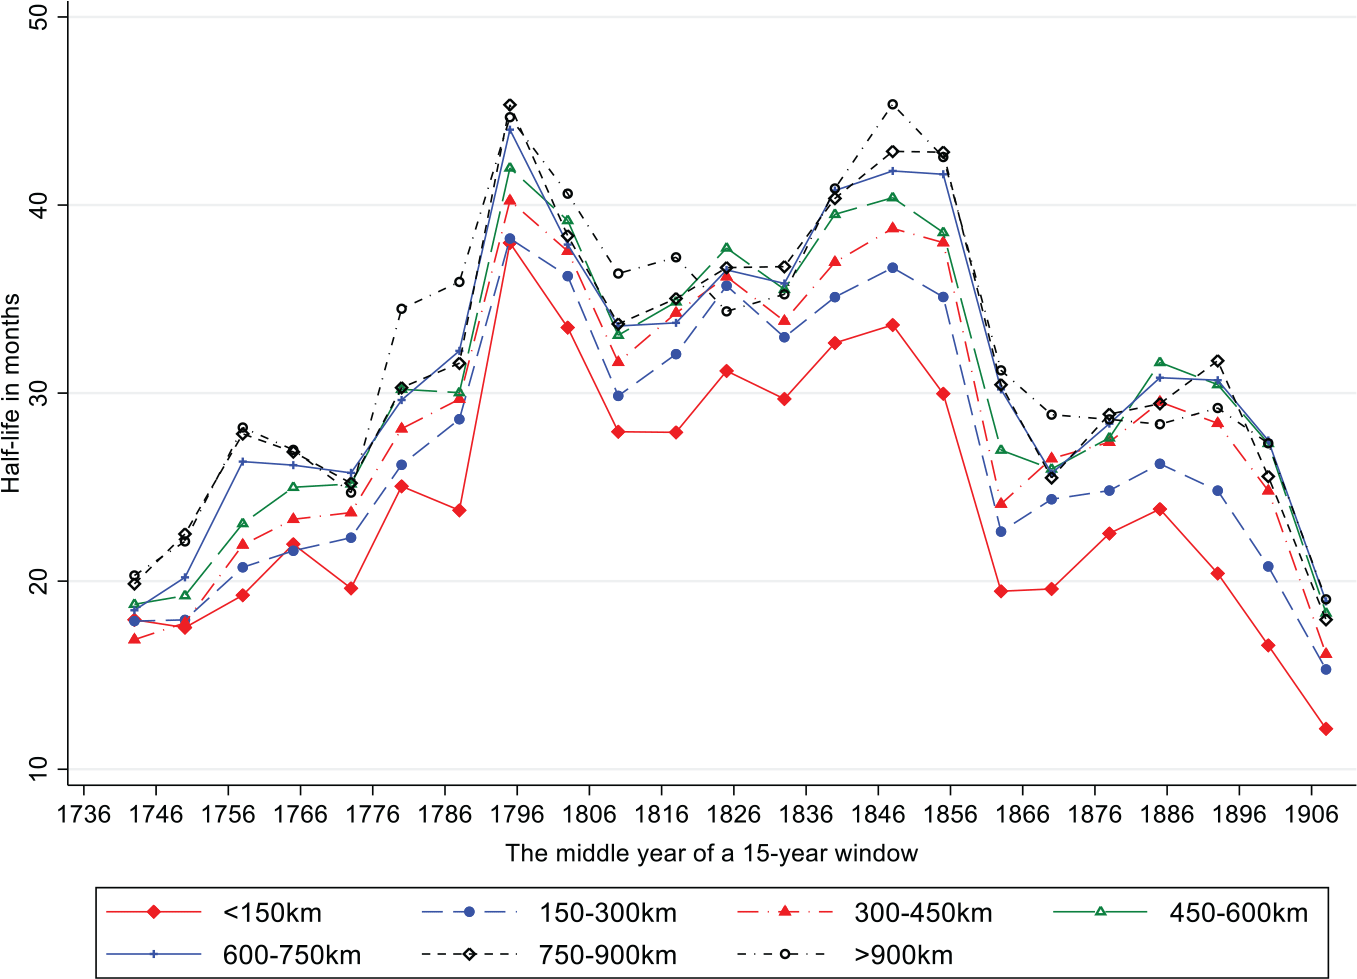
Figure 2 AVERAGE SPEED OF PRICE ADJUSTMENT IN CHINA’S GRAIN MARKET, BY DISTANCE, 1736–1910
Notes: The half-life of a shock is calculated based on the following formula: λ = ln(0.5)/ln(1 + ρ), where ρ is the coefficient of the Band-TAR model shown in Online Appendix A, and ρ ∈ (.1,0). If prices are not cointegrated between prefectures, ρ would be 0, with half-life tend towards infinity. We therefore report the half-life of only those prefecture-pairs whose prices are cointegrated. The larger the half-life, the slower the speed of grain price adjustment, and vice versa.
Sources: Authors’ own construction based on grain price data collected by Wang (2009) and the Chinese Academy of Social Science (2010).
To check the robustness of this finding, we also examine the average speed of price adjustment from the middle to the lower Yangtze region— a region most active in the grain trade. By one estimate, the middle Yangtze region (represented by the provinces of Anhui, Jiangxi, and Hunan) exported around 0.9–1.5 billion kilograms of rice to the lower Yangtze region (represented by the provinces of Fujian, Jiangsu, and Zhejiang), which accounted for 80 percent of the total grain imports in this latter region (Chuan and Kraus Reference Chuan and Kraus1975). Given that half-lives are a decreasing function of the rho parameter estimated from the BAND-TAR model, from now on, we will only report rho. Figure 3 shows both the TAR-Band estimates and the LOWESS smoothed curve of the average speed of price adjustment between the two regions. Consistent with the historical narrative of a sharp decline in the volumes of grain shipped from the middle to the lower Yangtze region since 1780 (Cheung Reference Cheung2008; Deng Reference Deng1994; Jiang Reference Jiang1992; Rowe Reference Rowe1984), Figure 3 shows that the average speed of price adjustments decreased rapidly to a nadir around the 1780s, but bounced back in the 1840s. This finding is in line with Figure 2.

Figure 3 AVERAGE SPEED OF PRICE ADJUSTMENT FROM THE MIDDLE TO THE LOWER YANGZI REGION, 1736–1910
Notes: The average speed of the price adjustment is measured by the mean of the absolute value of ρ, where ρ is the coefficient of the Band-TAR model as shown in Online Appendix A.
Sources: Authors’ own construction based on grain price data collected by Wang (2009) and the Chinese Academy of Social Science (2010).
We then use the coefficient of correlation of the first-differenced grain prices to test the price co-movement and Weir’s R index to examine the price variance. Together, Figures 4 and 5 show the coefficient of correlation (a co-movement test) and Weir’s R index (a variance test), respectively. In line with the finding from using the Band-TAR model, both the coefficient of correlation and Weir’s R index declined from the eighteenth century to the first half of the nineteenth century, before rising again in the second half of the nineteenth century. Summing up, regardless of the method used, China’s grain market exhibited a U-shaped pattern during the entire period of 1736–1910.

Figure 4 COEFFICIENT OF CORRELATION OF THE FIRST-DIFFERENCED GRAIN PRICES, 1736–1910
Notes: The coefficient of correlation of the first-differenced grain prices is calculated according to the formula  $\[{\rm{CV}} = \frac{{{\mathop{\rm cov}} ({p_i},{p_j})}}{{\sqrt {{\mathop{\rm var}} ({p_i}){\mathop{\rm var}} ({p_j})} }}\]$, where p is the first-differenced grain price, i indicates prefecture i, and j indicates prefecture j.
Sources: Authors’ own construction based on grain price data collected by Wang (2009) and the Chinese Academy of Social Science (2010).

Figure 5 WEIR’S R INDEX, 1736–1910
Notes: Weir’s R index is calculated according to Equation (1). The figure reports the average of Weir’s R index by year.
Sources: Authors’ own construction based on grain price data collected by Wang (2009) and the Chinese Academy of Social Science (2010).
THE ASSOCIATION BETWEEN POPULATION GROWTH AND MARKET INTEGRATION
Save for a few case studies (e.g., Jacks Reference Jacks2004), population dynamics or specifically the Malthusian model has not figured importantly in studies of market integration, which conventionally depend on broadly defined costs of transportation and institutions. However, our estimates imply that market integration went into a gradual decline amid sustained population growth surged after a Malthusian positive check, the Taiping Rebellion, significantly reduced the population. This data pattern suggests that there might be an “equilibrium” point beyond which unchecked population growth would prevent the grain market from further developing. From this particular vantage point, our primary task is to examine the overall relationship between population growth and market integration for the entire period of 1736–1910. We will also identify the conventional determinants of market integration such as railroads and steamships as they are potentially confounding factors. In order to pin down the mechanism of this relationship more specifically, we divide China into regions characterized by the varying degrees of grain self-sufficiency, and as a corollary, their corresponding role in the grain trade. Our classification is based on Wang and Huang (1989), who divide Qing China into three regions depending on whether they were able to produce a surplus (which enabled them to export), just self-sufficient, or were deficient (and hence needed import from regions with a surplus) (Figure 6). By using grain price as a check, we will demonstrate later that this classification is not endogenous to population growth (see the fourth section).

Figure 6 MAP OF THE DEMAND AND SUPPLY OF GRAIN IN EIGHTEENTH-CENTURY CHINA
Data Source: Wang and Huang (1989).
Data Sources and Variables Definition
KEY VARIABLES OF INTEREST
Degree of market integration. Given that our key independent variable, population density, has only five data points, we construct a balanced panel of 226 prefectures and estimate market integration for the periods of 1769– 1783, 1813–1827, 1844–1858, 1873–1887, and 1886–1910, respectively.
Given that transport costs are likely an increasing function of distance, it can significantly bear upon market integration (Keller and Shiue Reference Keller and Shiue2007; Shiue Reference Shiue2002). For this reason, we use the distance between two prefectures to calculate the mean adjustment speed of each prefecture as our dependent variable using the following equation,
 $\[M{I_{it}} = \sum\nolimits_{j = 1,j \ne i}^{226} {{d_{ij}}*spee{d_{ijt}}/\sum\nolimits_{j = 1,j \ne i}^{226} {{d_{ij}},} } \]$
where MIit is the distance weighted mean of the price adjustments between prefecture i and all other prefectures in period t; dij is the distance between prefecture i and j; speedijt is the price adjustment between prefecture i and prefecture j in period t, and is seen as the measure of market integration between prefecture i and prefecture j ranging from 0, which indicates no market at all, to 1, indicating a perfectly functioning market. The mean and standard deviations of the speed of adjustment, alongside other variables of interest, are reported in Table 2.
Table 2 SUMMARY STATISTICS OF VARIABLES OF INTEREST

Notes: aCalculated as the differences in population density between 1851 and 1880; bCalculated as the differences between the predicted and actual population density in 1880.
Data Sources: A: Authors’ estimation based on Wang (Reference Gu2009) and the Institute of Economics, Chinese Academy of Social Science (2010); B: Cao (Reference Pomeranz2000); C: Various local gazetteers; D: Wang et al. (Reference Bochove2007); E: CAMS (1981); F: Chen (1986); G: Nie (Reference Nie1983); Nie and Zhu (Reference Gaez2002); H: Huenemann (1984); I: Luo (1936).
Population density. Constructed by Cao (Reference Cao2000) at the prefectural level and available for only five data points (1776, 1820, 1851, 1880, and 1910), the key independent variable is population density for the Qing dynasty. According to Cao, the average population density for China as a whole exhibited an increasing trend prior to the Taiping Rebellion and other natural calamities that occurred during the late nineteenth century but declined thereafter, before it gradually recovered during 1880–1910.
CONTROL VARIABLES
Steamboats and Waterways. Inland water networks and trade routes expanded considerably (by more than 50,000 km) during the eighteenth century, leading to a significant reduction in the cost of water transport and, accordingly, an unprecedented expansion of China’s grain trade, especially large-scale and long-distance grain trade.Footnote 11
To measure the effect of technological progress in water transport on China’s grain trade, we employ the number of steamboats introduced during the second half of the nineteenth century as a proxy. Records on the number of steamboats used in domestic and foreign trade in China by country of origin during 1864–1910 are provided by the Chinese customs and documented in the Historical Materials of Ship Transport in Modern China, Volume 1 & 2 (Nie 1983; Nie and Zhu 2002). Data on steamboat usage at the prefectural level are not available, but the available data reveal that on average 41,893 steamboats were deployed a year for the period of 1872–1911. Due to this limitation, we assign the value of 1 to prefectures with waterways and zero to those without one and interact steamboat with this dummy variable to measure it. The geography of waterways in China is shown in Figure A1 in Online Appendix A.
Duration of railway. While in China grain was mostly shipped by boats, we do not rule out the effect that improvements over railway may have on grain trade. To capture that effect, we employ the specific year in which a rail network was constructed in a prefecture relative to the fivetime points of data on population density to proxy for its duration. The data on the railway are obtained from Huenemann (Reference Huenemann1984).
Telegraph. By speeding up the transmission of information, the telegraph could effectively improve market efficiency by leaps and bounds (Ejrnæs and Persson Reference Persson2010; Federico Reference Federico2007; Hoag Reference Hoag2006). As a Qing government-controlled corporation, the Imperial Chinese Telegraph Administration was established in 1881, but its diffusion was lackluster. For example, even by 1912, only 700 telegraph stations were available for use in China, which paled in comparison with Japan (4,657) and even Brazil (2,114), let alone Germany (46,444) and the United States (32,000) (Gu Reference Gu2009). Moreover, government officials had priority in using the equipment; only when they did not need it were ordinary citizens and private businesses granted access, and at a high cost. We employ the dummy variable of whether a prefecture had ever adopted the telegraph—even though it was still a long way from becoming a popular means of communications in late Qing China—to proxy for its possible effect on market integration (Yoon Reference Yoon2015). The data on telegraph adoption are collected from various local gazetteers.Footnote 12
Multiple Levies of Likin Tax. The early Qing dynasty adopted a highly centralized fiscal system, whereby nearly all revenues had to be submitted to the central coffers. But the Taiping Rebellion changed this. To suppress the rebels, the central government relied heavily on the initiatives of provincial governments to recruit their own armies, which in turn required a thorough decentralization of fiscal powers to the province chiefs to collect their own revenues. Specifically, since 1853 provinces were given the authority to collect a commodity circulation tax, known in Chinese as likin tax, of which they were allowed to retain up to 80 percent and the discretion to deploy them in ways as they saw fit (Fairbank and Liu 1980; Luo Reference Luo1936). Unsurprisingly, this measure became the most important source of revenue for the provincial governments, thereby providing unprecedentedly strong incentives for them to levy taxes (Shen Reference Shen2011). Imposed on both shop inventories (the in situ likin or zuoli) and transported commodities (the transit likin or xingli), likin increased the costs of doing business; we thus expect it to be negatively associated with trade and as a corollary market integration.Footnote 13 While the effective tax rates of likin would be an ideal measure of this local tax, such data are not available. Thankfully, we are still able to differentiate the intensity of this tax based on whether it was collected just once (as in the case of Hunan Province) or multiple times (as in the case of Jiangsu Province). Given that commodity trade was more vulnerable in provinces employing multiple levies, we assign the value of 1 to provinces using a multiple-levy approach and zero to those using a single-levy tax.Footnote 14
New World crops. The introduction of New World crops in the eighteenth and nineteenth centuries had allegedly led to a substantial increase in population and total grain output (e.g., Ho Reference Ho1959), and which may thus have increased the volume of tradable grain. It is, therefore, necessary to control for the effect of New World crops on market integration. Evidence suggests that maize was likely the most popular New World crop the Chinese had adopted (the other two were the potato and sweet potato)—a crop that had contributed to an increase of nearly 19 percent of the Chinese population during the period of the crop’s diffusion (1776–1900) (Chen and Kung 2016). We thus control for the adoption of maize to proxy for the effect of New World crops on market integration in late imperial China. Moreover, given that maize adoption depended on the suitability of land and other characteristics, it is necessary to control also for the interaction of land suitability for growing maize and the time since maize was adopted in a prefecture to capture its time-varying effect.
The data on crop suitability for growing maize are obtained from the Global Agro Ecological Zones (GAEZ) 2002 database provided by the Food and Agriculture Organization (FAO) (Gaez Reference Gaez2002).Footnote 15 The duration of cultivation is measured by deducting the year of adoption from the years of the available population estimates, namely 1776, 1820, 1851, 1880, and 1910. The timing of adopting maize at the prefectural level is provided in Chen and Kung (2016).
War. It is also necessary to control for the possible effects of war, which typically are associated with a significant loss of lives, the destruction of cultivated land, and damage to transport and storage infrastructure, all of which are likely to affect market integration (Jacks Reference Jacks2006). The data on war is obtained from the Chronology of Warfare and Natural Calamity in Dynastic China (zhongguo lidai tianzai renhuo biao) (Chen 1986). Based on various historical records, Chen (1986) systematically collected information on wars (including their intensities) from 246 bc to 1911 ad. Based on this information, we first calculate the incidence of war in a prefecture during each of the five periods of market integration, namely 1769–1783, 1813–1827, 1844–1858, 1873–1887, and 1886–1910, and then divide this number by 15 (the interval) to obtain an average measure.
Weather extremities and temperature. We control for the effect of climate on market integration, given that climate could bear directly upon agricultural output and, therefore, grain supply. To proxy for the effect of climate, we use two measures—respectively, deviations from the average precipitation and temperature. The data on rainfall are obtained from the Yearly Charts of Dryness/Wetness in China for the Last 500-years Period (zhongguo jin wubainian hanlao fenbu tuji), compiled by the Chinese Academy of Meteorological Science (CAMS 1981) based on more than 2,200 issues of local annals. The CAMS data measures rainfall using an ordinal scale ranging from 1 (indicating extreme flood) to 5 (indicating extreme drought); we adopt the midpoint, 3, to indicate normal rainfall. We further construct two variables to proxy for the extremes in precipitation, namely flood and drought, based on rainfall records that deviate from the midpoint or normal rainfall. We then calculate the average extent of flood and drought during each of the five periods and use these figures to construct the proxy for precipitation extremes for each prefecture that correspond to the sub-periods of market integration.
In the case of temperature, the extreme temperature is constructed using Temperature Reconstruction in China for the Past 1000 Years (Wang et al. Reference Bochove2007), where, as with precipitation, the extreme temperature is measured based on deviations from the average temperature of the previous one thousand years. Given that extreme temperature is calculated at the (larger) regional level and on a decadal basis, to match with our data on market integration, which is based on prefecture and 15 years, we reconstruct the pertinent data ourselves (details of the reconstruction are provided in Online Appendix B and Figure B1 in Online Appendix B).
Treaty ports. Last but not least, we control for the effect of economic openness on market integration. After the First Opium War (1840–1842), China was forced to sign a number of treaties allowing foreigners to enter via the so-called treaty ports. A total of 112 treaty ports had been opened by the time the Qing dynasty (1644–1911) came to an end. Limited evidence suggests that treaty ports had led to considerable growth in domestic trade (Keller, Andrés-Santiago, and Shiue 2017) and developed faster after 1978 (Jia Reference Jia2014). To control for the effect of economic openness on market integration, we use the dummy variable of whether a prefecture became a treaty port in a specific year as a proxy.
Table 2 summarizes the descriptive statistics of the variables of interest.
Baseline Estimation
We begin by demonstrating the negative correlation between population and market integration in the aggregate.Footnote 16 Figure 7 shows the relationship between the total population in China and the speed of grain price adjustment estimated using the Band-Tar model across all prefecture pairs (refer to Online Appendix A for details). The negative relationship provides suggestive evidence, but to precisely show this, we turn to regression estimates. The association between population density and market integration in late imperial China is estimated using a fixedeffects model, in which we control for a number of observable characteristics that may be correlated with market integration:
 $\[M{I_{it}} = \beta *popde{n_{it}} + {X_{it}}*\gamma + {\alpha _i} + {\delta _t} + tren{d_{pt}} + {\varepsilon _{it}},\]$
where i denotes a prefecture and t indexes the time periods of 1776, 1820, 1851, 1880, and 1910, respectively. The dependent variable, MIit, denotes the degree of market integration, which is measured by the average speed of price adjustment between prefecture i and all other prefectures in period t. The key explanatory variable of interest, popdenit, stands for population density in prefecture i in period t. In addition to population density, other factors such as economic openness, technical progress, political and climatic disruptions (including warfare) may all bear upon market integration significantly and therefore should be accounted for in the regression analysis. Denoted by Xit, we employ treaty ports as a proxy for economic openness; the adoption of maize (a New World crop), the total number of steamboats (and its interaction with waterways) and railroads, as proxies for technical progress; the likin tax as a proxy for political barriers; the incidence of warfare as a proxy for possible disruptions due to war; and droughts and floods and deviations from average temperature as proxies for extreme weather, respectively. In addition, we control for the time-invariant, prefecture-specific fixed effects (denoted by α) such as land quality and topography, as they may be correlated with population density. We also include period fixed effects, denoted by δt, to control for all period-varying factors that may affect market integration. Finally, we also control for the effect of prefecture-specific time trend, trendpt, in one of the regressions to account for the possibility that the market may have developed across prefectures in varying degrees. The error term is denoted by εit, and β is the parameter of interest.

Figure 7 POPULATION AND MARKET INTEGRATION IN LATE IMPERIAL CHINA, 1736–1910
Notes: Market integration is measured by the mean of the absolute value of ρ, where ρ is the coefficient of the Band-TAR model as shown in Online Appendix A.
Sources: Market integration is estimated by the authors based on grain price data collected by Wang (Reference Gu2009) and the Chinese Academy of Social Science (2010). The data on population is collected by Liang (Reference Liang1980).
Disproportionate population growth in some prefectures may directly affect their neighboring prefectures via trade, spillovers in price shock, migration, and so on. Omitting this spillover effect would yield biased estimates of the effect of population growth on market integration. To deal with this, we thus estimate standard errors robust to spatial correlation up to 200 km and 500 km based on Conley (Reference Conley1999). We will thus present both robust standard errors and spatially correlated standard errors in our main results.
Panel A of Table 3 reports the estimation results. Column (1) of Table 3 reveals that there is indeed a significantly negative association between population density and market integration. In terms of magnitude, a 100 percent increase in population density will lead to a 0.025 decrease in market integration, which is about 40.2 percent (0.025/0.063) when evaluated at the mean of market integration in Qing China. In the light of the two-fold increase in population during 1741–1851, market integration in this period decreased by roughly 80.4 percent. To further facilitate interpretation, we report standardized (beta) coefficients in row 2. We find that a one standard deviation increase in population density will lead to a 0.6 decrease in standard deviation in market integration.
Table 3 DETERMINANTS OF MARKET INTEGRATION IN CHINA, 1776–1910

Notes: Robust Standard errors in parentheses; *** p < 0:01, ** p < 0:05, *p < 0:1; Constant terms are not reported. Both prefecture and period fixed effects, and prefecture-specific time trend are controlled for.
Source: See the text.
We then control for the effect of economic openness (treaty ports) and technological progress (steamboat and its interaction with waterways, railroads, and telegraph) (Column (2)).Footnote 17 Both the level of significance and the magnitude of population density remains stable. Consistent with Perkins (Reference Perkins1969), increasing use of the steamboat, as anticipated, leads to an increase in market integration; this appears to be especially the case in prefectures well served by waterways.
For both Europe and India, railroad expansion in the nineteenth century improved market integration considerably (Andrabi and Kuehlwein Reference Persson2010; Burgess and Donaldson Reference Keller, Andrés-Santiago and Shiue2017, Jacks Reference Jacks2006). However, the same does not apply to late imperial China, as the railway had yet to become a major mode of transport (for grain at least) even during the final years of the dynastic rule (Yan Reference Yan1955).Footnote 18
Measured by whether a prefecture is a designated treaty port, economic openness has no significant effect on market integration. While Columns (2)–(5) show that there is a (marginally) significantly negative relationship between treaty ports and market integration (at the 10 percent level), it disappears after we control for the multiple levies of likin tax in Column (6), which is not unreasonable given that grain trade accounted for a mere 5.9 percent of the total value of imported commodities during the last few decades of Qing China (Yan Reference Yan1955).
Columns (3)–(5) further control for the effect of maize adoption, weather conditions (flood, drought, and temperature), and wars on market integration. Again, both the level of significance and magnitude of population density remains stable, whereas maize adoption has no direct effect on market integration.Footnote 19
Column (6) examines the hypothesized negative effect of the likin tax. As this tax was implemented in 1853, we interact it with a time dummy of post-1853. Compared to regions where the likin tax is collected just once, the multiple levying of this tax has the effect of reducing market integration by 0.018 after 1853 (significant at the 1 percent level), which, when evaluated at the mean of market integration, amounts to a sizeable 27.8 percent. However, the inclusion of this variable in the model increases the magnitude of population density from –0.025 to –0.023, which decreases the overall effect of population density on market integration from 40.2 to 36.5 percent. But since the method of levying likin tax is not clearly known in some provinces such as Henan, Shanxi, Yunnan, and Zhili, we drop those provinces from our sample, and the number of observations is thus reduced from 1,112 in Column (5) to 867 in Column (6). To address the issue of sample selection bias caused by missing observations of likin in these provinces, Column (7) re-estimates the relationship between population density and market integration using the smaller sample in Column (6) and obtains basically the same result. The coefficient of population density remains statistically significant at the 1 percent level and with a similar magnitude in the estimates for which all covariates are controlled. Overall, the findings in Table 3 confirm that the association between population density and market integration is not only statistically significant but also economic meaningful; a 100 percent increase in population density will lead to a 0.023–0.025 reduction in market integration, which is about 36.5–40.2 percent when evaluated at the mean of market integration in late imperial China.
To exclude the possible reverse causality of better-integrated markets leading to increased population density (Albers, Pfister, and Uebele Reference Albers, Pfister and Uebele2018), we use the lagged term of population density as our independent variable to re-examine the relationship. In other words, the log of the 1820 population is used in the 1851 panel. Note that we must drop the 1776 panel as there is no estimate for the prefecture-level population before then. As reported in Panel B of Table 3, the result of a negative coefficient remains consistent, although the coefficient for the population is now smaller in magnitude.Footnote 20
In addition to reverse causality, one may also be concerned that the summary measure of market integration incorporates the distance between two trading prefectures, which is highly correlated with transportation costs. Moreover, there may also be the concern that there are only five data points for population, so we are unable to make use of the price data more fully in the regressions. To allay these concerns, we consider a different type of regression in which we make use of the price gap between prefecture pairs—specifically the importers and exporters—as the dependent variable and take the natural log (ln (pi,t/p j,t) or lnpi,t — lnp), where pjt and denote the prices respectively of importer i and exporter j in period t. According to the law of one price, prices for the same good sold in two different markets should be identical if those markets are well integrated. Even where there are transaction costs, the prices for the same good in the two markets will reach an equilibrium level after adjusting for temporary shocks. That is, in a set of perfectly integrated markets, ln (pi,t/pj,t) should be a positive constant; the smaller ln (pi,t/pj,t) is, the more integrated the markets are. As the dependent variable now assumes the form of prefecture pairs (of an importer pairing with an exporter), the independent variables in Equation (3) also take the form of prefecture pairs. Specifically, population density now refers to its average between the importer and exporter. To illustrate, if the population density is 200 people per square kilometer in an exporting prefecture and 100 in an importing prefecture, then the average between this particular pair is 150 people per square kilometer. Reported in Columns (1)–(7) of Table 4, the regression confirms a negative relationship between population density (measured by the average between pairs of importing and exporting prefectures) and market integration (measured by the log of the price gap between the importing and exporting prefectures), reaffirming our earlier finding.
Table 4 ALTERNATIVE MEASURE OF MARKET INTEGRATION, BY PREFECTURE PAIR

Notes: Robust standard errors in parentheses; *** p<0.01, ** p<0.05, * p<0.1; Constant terms not reported. Both prefecture pairs and period fixed effects are controlled for.
Source: See the text.
To verify the demographic role of the Taiping Rebellion in reversing the market integration, in Online Appendix C, we conduct a counterfactual analysis of how recovery from population loss may lead to more integrated grain markets by exploiting the historical context of China in late imperial times using a difference-in-differences (DID) analysis. We show that prefectures exposed to the Taiping Rebellion, and hence suffered population losses, ended up with a higher level of market integration. These results shown in Online Appendix C further imply that the Taiping Rebellion released the mounting population pressure built up beforehand.
THE MECHANISM BEHIND THE ASSOCIATION
We now examine the mechanism through which population growth halted market integration from around 1736 onwards by dividing China into regions based on whether or not they were able to produce a grain surplus and trade. The grain-surplus prefectures were heavily involved in grain crop production, whereas the grain-deficit prefectures were specialized in cash crop production; hence more commercialized and enjoyed a higher standard of living.Footnote 21 To ensure that the classification of prefectures is not correlated with, and thus endogenous to, population growth, we use grain price as a check. Specifically, we plot the grain price trend for the period in Figure D1 in Online Appendix D, which shows that grain price in the deficit prefectures was higher than that in the surplus prefectures; it was lowest in the self-sufficient regions and weakly correlated with those in the other two regions.
Regional Patterns of the Association between Population Growth and Market Integration
The results of the estimates, based on Equation (3) with sample restrictions based on Wang and Huang (1989), are reported in Table 5. Columns (4)–(6) of Table 5 control for the effect of likin tax (Multiplelevy*Post1853), whereas Columns (1)–(3) do not. The estimate in Column (1) suggests that a 100 percent increase in the population density within the grain-surplus regions will lead to a 0.030 decrease in market integration there, which is about 47.6 percent (0.030/0.063) when evaluated at the mean of market integration in these regions. The pertinent coefficient remains statistically significant after controlling for likin tax; the larger magnitude of –0.031 is now translated into a 49.2 percent decrease in market integration in the grain-surplus regions (Column (4)).
Table 5 EFFECT OF POPULATION GROWTH ON MARKET INTEGRATION IN CHINA, BY REGIONS, 1776–1910

Notes: 1Control variables include the total number of steamboats and its interaction with waterway, duration of railway, telegraph, maize adoption, flood, drought, temperature, war, prefecture, and period fixed effects, and prefecture-specific time trend. Robust standard errors in parentheses; *** p < 0.01, ** p < 0.05, *p < 0.1; Constant terms are not reported.
Source: See the text.
By contrast, the coefficient of population density in the grain-deficit regions is statistically insignificant (Column (3)), suggesting that population growth in these regions does not affect market integration, consistent with the above finding. And the result does not change even after we control for the likin tax (Column (6)). What this may imply is that although the demand for grain in the grain-deficit regions increased with population growth, they were constrained by the supply response from the grain-surplus regions.
As for the self-sufficient regions, the coefficient of population density is consistently negative, but whose association is rendered weaker after controlling for likin tax (compare Column (2) with Column (5)).Footnote 22 Given that the coefficients in Columns (2) and (5) are substantially larger than those in (1) and (4), we suspect the former estimates may be driven by extreme values. To find out, we remove those prefectures with the highest three values of the dependent variable one by one. After dropping those prefectures with the two highest values, we indeed find that the estimates become not only smaller but basically insignificant (Columns (3)–(4) of Table E1 in Online Appendix E), confirming that estimates for the selfsufficient regions are indeed driven by extreme values.
An important question concerning our finding of grain supply constraining trade is whether corroborating historical evidence exists. While the population in China was growing rapidly especially during the eighteenth century, grain production had also increased, thanks to the growing diffusion of New World crops, and accordingly, an expansion of cultivated land, intensified cropping patterns, increased fertilizer use, and other technological improvements associated with grain crop production (Perkins Reference Perkins1969). Nonetheless, existing evidence suggests that on balance, available supplies of food per person decreased despite production increases (Guo Reference Guo1994; Shi Reference Shi1989, 2011, 2012; Zhang Reference Zhang1991). According to one estimate, for example, although China’s total grain output rose by 44.7 percent between 1720 and 1850 (from 127.05 to 183.7 billion kilograms), grain output per capita dropped by 58.3 percent during the same period (from 977.5 to 408 kilograms) (Shi Reference Dobado-Gonzãlez, Garciã-Hiernaux and Guerrero2012). This overall decline in per capita grain supplies is further borne out by the notable decline in the long-distance grain trade in the same period along the major trade routes of the Yangtze River (in the south), the Huai River (in the north), and the Grand Canal (linking the north and the south) (Cheung Reference Cheung2008; Deng Reference Deng1994; Jiang Reference Jiang1992; Rowe Reference Rowe1984). Accordingly, customs revenues, collected based on long-distance trade, also declined in tandem during the 1788–1812 period (Fan Reference Fan1993).
Effect of Population Growth on Grain Trade
We now extend our analysis to examine how population growth in the importing and exporting regions, respectively, affected market integration. In particular, we want to verify that market integration should decline only in the grain-surplus regions. However, since data on the volume of the grain trade in late imperial China are not available, we can only employ data on the speed of grain price adjustment to be our dependent variable.
In addition to examining the effect of population growth on inter-provincial grain trade, we also examine its effect on short-distance or intra-provincial grain trade within a single province, given that shortdistance grain trade accounted for a significant share of overall grade trade according to one estimate (Wu and Xu 2000).Footnote 23 In this context, we thus examine four kinds of grain trade, viz., interprovincial grain trade between the grain-surplus and grain-deficit regions, and intra-provincial grain trade within the grain-surplus, grain-deficit, and self-sufficient regions, respectively, based on the following specification:Footnote 24
 $\[LN(spee{d_{ijt}}) = {\beta _i}*Ln(popde{n_{it}}) + {\beta _j}*Ln(popde{n_{jt}}) + {\gamma _i}*Ln({X_{it}}) + {\gamma _j}*Ln({X_{jt}}) + {\alpha _{ij}} + {\delta _t} + {\varepsilon _{it}},\]$
where speedijt denotes the speed of price adjustment from prefecture j to prefecture i in period t, and where prefecture j is a grain exporter and prefecture i a grain importer, respectively. To identify the importers and exporters we follow our strategy of identifying the grain-deficit and grainsurplus prefectures by defining prefectures with a higher and a lower grain price as importers and exporters, respectively; that is, pit > pjt. To proxy for the size of the market, we employ population density in prefecture i and that in prefecture j in period t (popdenit and popdenjt). In principle, as population in prefecture i grows, it will need to import more grain, in which instance the speed of price adjustment is expected to increase.Footnote 25 In contrast, population growth in prefecture j will reduce the volume of tradable grain, which will therefore reduce the speed of price adjustment between the two prefectures. The vectors of covariates for prefecture i and prefecture j are denoted by Xit and Xjt, respectively, which are essentially the same as in Equation (3); aij denotes prefecture-pair fixed effects, which are included to capture the time-invariant prefecture-pair characteristics that may be related to population density and the speed of grain adjustment such as distance and waterways; and δt captures the period fixed effects that may affect the adjustment of grain prices. As Equation (4) assumes a panel data structure, the distance variable (between two trading prefectures) is automatically dropped. The error term is denoted by εit. In Equation (4), the error term εit is spatially correlated since each pair-wise observation on the speed of price adjustment, speedijt, belongs to two distinct groups—the exporting prefecture j and the importing prefecture i. To overcome the problem of spatial correlation, we cluster the standard errors at each node of the pair using the two-way clustering of the standard errors proposed by Cameron, Gelbach, and Miller (2011). The parameters of our interest are βi and βj.
In Table 6, we estimate the effect of population density in both importing and exporting prefectures without controlling for the effect of the type of likin tax employed. In the case of interprovincial trade between the grain-surplus and grain-deficit regions, we assume that grain would be shipped from the surplus region to the deficit region, but not vice versa. Following this reasoning, importers are thus located in the grain-deficit regions, whereas exporters are in the grain-surplus regions, respectively (Columns (1)–(3)).
Table 6 THE EFFECT OF POPULATION GROWTH ON THE SPEED OF GRAIN PRICE ADJUSTMENT, 1776–1910

Notes: Dependent variable is the speed of price adjustment from exporting to importing prefectures. Control variables include the total number of steamboats and its interaction with waterway, duration of railway, flood, drought, temperature, war, maize adoption, and period and prefecture-pair fixed effects. 1The interprovincial trade subsample includes prefecture-pairs of the exporting provinces of Anhui, Hunan, Jiangxi, and Sichuan, and prefecture-pairs of the importing provinces of Fujian, Jiangsu, and Zhejiang. 2This subsample includes all interprovincial trade observations except for those in Column (2). Two-way clustered standard errors in parentheses; *** p < 0.01, ** p < 0.05, *p < 0.1; †p=0.105; Constant terms are not reported.
Source: See the text.
Column (1) examines the effect of the population density of the exporting and importing regions on the speed of price adjustment between the grain-surplus and grain-deficit regions. It shows that population growth in the exporting prefectures significantly reduces the speed of grain price adjustment between the two regions. In terms of magnitude, a 1 percent increase in the population density of the exporting prefectures will lead to approximately a 1.6 percent decrease in the speed of price adjustment between the grain-surplus and the grain-deficit regions. By contrast, population growth in the grain-deficit regions does not affect the speed of grain price adjustment. Together, these results suggest that population growth in the grain-deficit regions—which increases the demand for traded grain—is not a sufficient condition for markets to become more integrated into these regions, due presumably to the supply constraint in the grain-surplus regions.
To check robustness, we run the same regression on a smaller sample, based on the historical evidence that interprovincial grain trade was conducted primarily between the grain-surplus provinces of Anhui, Hunan, Jiangxi, and Sichuan, on the one hand, and the deficit provinces of Fujian, Jiangsu, and Zhejiang on the other (Fang et al. Reference Pomeranz2000; Jiang Reference Jiang1992; Wang Reference Wang1992), and obtain a similar result (Column (2)).Footnote 26
This finding is of particular importance against the backdrop of declining grain trade within the Yangtze region, as some historians have noted (e.g., Cheung Reference Cheung2008; Deng Reference Deng1994; Jiang Reference Jiang1992; Rowe Reference Rowe1984). By at least one account, the lower Yangtze region was actively engaged with the middle and upper regions in the long-distance trade of grain for manufactured goods such as cloth up until the middle of the eighteenth century. But with the population growing rapidly in the middle and upper Yangtze, the returns to agriculture were sharply diminishing, and the development of a proto-industry in sectors such as cloth, sugar, paper, and iron, intensified. This led to a noticeable decline in the middle and upper regions’ export of grain and other crops to, and their reduced import of manufactured goods from, the lower Yangtze during 1750–1850 (Pomeranz Reference Pomeranz2000a, 2000b).Footnote 27 While Skinner (Reference Skinner and William Skinner1977a, 1977b) sees the Chinese economy as only weakly integrated before the advent of railroads and steamships, von Glahn (Reference Von Glahn2016, p. 334) views China as having achieved an “impressive degree of interregional trade and market integration” already by the early Qing. Evidence based on grain market integration suggests that it did reach a peak in 1736 (roughly the first 100 years of the dynasty) before it went into decline. However, we diverge from his opinion that the reversal of a growing trend of market integration was caused by the “onset of political and economic crisis in the nineteenth century” (von Glahn Reference Von Glahn2016, pp. 334–35); instead, we argue that unchecked population growth was the root cause of these crises. What we are unable to further confirm, however, is whether the decline in trade was due largely to the growing demographic pressure or to the rising income opportunities brought about by family specialization and import substitution in the first place, as families in the grain-surplus regions shifted away from specialization in grain production and export. We leave this topic to future research.
To rule out the possibility that the significant effect of population density on grain trade between the grain-surplus and grain-deficit regions was confined to only the Yangtze region, we drop those observations associated with this sub-sample and run the regression again in Column (3), and confirm that only the coefficient of the exporting prefectures is significantly negative. Although it is statistically not as significant and its magnitude is smaller than that in Column (1) (–1.169 vs. –1.663), it reaffirms the result that the effect of population growth on market disintegration comes primarily from the supply side.
We now turn to examine the effects of population growth on short-distance or intra-provincial trade for reasons already mentioned. The estimates reported in Columns (4) through (6) show that only population growth within the grain-surplus regions has a significant effect on the speed of grain price adjustment within those regions. In terms of magnitude, an increase of population density by 1 percent in the importing prefectures within these regions will lead to approximately a 1.7 percent increase in the speed of price adjustment in these prefectures, whereas the same increase in the exporting prefectures will result in a decrease of 1.8 percent in the exporting prefectures. On balance, the two effects more or less cancel each other out. Our results are robust to the inclusion of the likin tax (refer to Table E2 in Online Appendix E for details).
The validity of our results hinges crucially on the accurate classification of the regions as grain-surplus, grain-deficit, and self-sufficient regions. With the exception of the provinces of Henan, Hubei, Shandong, and Shaanxi, Chinese historians basically agree as to whether a province was able to produce a surplus in the eighteenth century (refer to Table E3 of Online Appendix E for details). To check robustness anyway, we estimate the effect of population growth on the speed of grain price adjustment based on the classifications of other Chinese historians (e.g., Jiang Reference Jiang1992; Deng Reference Deng1994; Wu Reference Wu2001) and report the results in Panels A to C of Table 7. In Panel D, we exclude the four provinces over which a consensus is lacking and re-estimate again. Our earlier results continue to hold. One may still be concerned that such classification may change in response to population growth over time. To ensure that our results are robust, we employ an alternative classification based on the views of various economic historians summarized in Table E4 of Online Appendix E and find consistent results in Panel E of Table 7.
Table 7 ROBUSTNESS OF THE EFFECT OF POPULATION GROWTH ON THE SPEED OF GRAIN PRICE ADJUSTMENT, 1776–1910

Notes: Dependent variable is the speed of price adjustment from the exporting to the importing prefectures. Control variables include the total number of steamboats and its interaction with waterway, duration of railway, flood, drought, temperature, war, and maize adoption, and period and prefecture-pair fixed effects. Since there is no dispute in self-sufficient region, we here do not estimate the intra-provincial trade within self-sufficient regions. *** p < 0:01, ** p < 0:05, *p < 0:1; Constant terms are not reported.
Source: See the text.
CONCLUSION
Because of its close association with modern economic growth, the performance of markets in a Malthusian world remains an important topic for the history of economic growth. By extending the data on China’s grain prices to cover a longer period than previously analyzed (1736–1910 as opposed to 1742–1795), we find that, unlike Europe, the performance of China’s grain markets went through a U-shaped pattern. After having reached a peak around the mid-eighteenth century, it experienced a clear decline in tandem with explosive population growth— a period that lasted for about a century. The grain market resumed its growth momentum only after approximately one-sixth of the Chinese population was wiped out by Malthus’ “positive checks” in the context of the Taiping Rebellion. While the population also resumed its upward trend in the aftermath of this catastrophe, it grew from a much lower base, with the seeming effect of facilitating market integration.
By unveiling the unique pattern of market development in China and focusing on the role played by the population dynamics underlying such a pattern, our study sheds new light on the differing market performance trajectories between China and Europe. To the extent that the Industrial Revolution excluded China, our finding may thus be taken as a “clean” case demonstrating the tensions between population pressure and the development of markets inherent in a Malthusian or pre-industrial regime. Also, by dividing China into three distinct regions characterized by varying degrees of self-sufficiency in grain production and trade based on grain price, we show that the forces of disintegration came specifically from faster population growth in the grain-surplus-cum-exporting areas, which underpins the overall negative relationship between population growth and market integration for the entire period of our study.