Introduction
Cultivated sunflower (Helianthus annuus L.) represents one of the world's most important sources of edible oil, with a cultivated acreage of over 23 million ha (http://www.fao.org/; Bowers et al., Reference Bowers, Bachlava, Brunick, Rieseberg, Knapp and Burke2012).
Originally domesticated in central North America, sunflower became a well-established oil crop by the end of the 19th century when selection was practised by farmers in several parts of Russia (Skoric, Reference Skoric1992). By 1950, there was large-scale production in the Soviet Union and Argentina, where the crop first arrived via Jewish immigrants bringing small quantities of seeds from the south of Russia (Bertero de Romano and Vázquez, Reference Bertero de Romano and Vázquez2003). These initial populations gave rise to the first local commercial varieties (Klein, La Previsión and Massaux) and subsequently led to the development of several varieties at the Instituto Nacional de Tecnología Agropecuaria (INTA) by the introduction of early materials from Russia, Canada and Romania, as well as through introgression with wild Helianthus species. This diverse ensemble is collectively known as Argentinian germplasm; it has a distinct genetic constitution and is well adapted to local growing conditions. As in other sunflower-producing countries, hybrid seed had already gained wide acceptance among farmers by the mid-1970s, and they currently account for almost 80% of the total production of Argentina. Nowadays, Argentina is among the four largest sunflower producers worldwide and is the second oil exporter. Although the sunflower cultivated surface of the country has increased over the last 10 years, reaching at present ca. 2 million ha, its production has been shifted towards less favourable environments, emphasizing the need for the expansion of breeding efforts (De la Vega et al., Reference De la Vega, De Lacy and Chapman2007).
The Active Germplasm Bank of INTA Manfredi (AGB-IM) has been evaluating and preserving sunflower genetic resources for more than 50 years. It holds ca. 1000 accessions of cultivated sunflower, which encompass a broad range of geographic origins. Cultivated materials have been generated by diverse breeding methods, with open-pollinated populations (OPs), composite populations (CPs) and inbred lines (ILs) accounting for 51, 9.8 and 39.2% of the collection, respectively.
Knowledge of the levels and distribution of genetic diversity in germplasm collections is of great importance for the conservation and utilization of genetic resources. However, exploitation of genetic variability preserved in germplasm collections has yet to be fully achieved, with sunflower being no exception to this pattern. Even though molecular markers have been extensively used for the genetic characterization of cultivated sunflower (e.g. Burke et al., Reference Burke, Tang, Knapp and Rieseberg2002; Paniego et al., Reference Paniego, Echaide, Muñoz, Fernandez, Torales, Faccio, Fuxan, Carrera, Zandomeni, Syarez and Hopp2002; Garayalde et al., Reference Garayalde, Poverene, Cantamutto and Carrera2011; Mandel et al., Reference Mandel, Dechaine, Marek and Burke2011), the genetic diversity of Argentinian germplasm has been only poorly documented.
With the aim of uncovering the genetic diversity of sunflower OPs and CPs preserved at the INTA sunflower germplasm collection, this work intended to: (1) analyse its agro-morphological diversity based on 17 quantitative and qualitative traits; (2) assess its genetic diversity based on a set of microsatellite markers; (3) evaluate the relationship among the accessions; (4) define a set of highly informative microsatellites that can be routinely and efficiently applied in germplasm characterization.
Materials and methods
Plant material
The 14 OPs and CPs included in this study, hereafter the selected set, were chosen to represent historically important accessions that are currently used within the INTA sunflower breeding programme. The name of the accessions, breeding status, the country of origin and the number of individuals used for molecular analysis are presented in Table 1.
Table 1 Sunflower accessions from the Active Germplasm Bank of INTA Manfredi included in the present study
OP, open-pollinated population; CP, composite population.
Briefly, KLM 209 OP was obtained from KLM selection, which was a multiple cross between Klein × local cultivars (a pool of local varieties from the INTA EEA Pergamino breeding programme) × ‘Manfredi’ (a pool of varieties from the INTA EEA Manfredi breeding programme). IAC-Anhandy is a Brazilian OP selected due to its high oil content (OC) and good performance in local environments. The Canadian variety Sunrise was one of the main contributors to the genetic background of Guayacán INTA and was also involved in the origin of Forestal cambá. Jupiter is a German OP that shows extensive variation for diverse agronomical traits such as yield, resistance to abiotic stress, etc. Puntano × Smena was derived from a cross between Puntano (Manfredi, Argentina) and Smena (Russia). Puntano was developed from cultivated and wild species of Helianthus, showing resistance to Puccinia helianthi. VNIIMK 8931-1 is a Russian OP. This accession was used as the background for the HA89 IL, which is one of the parental lines of a reference population for quantitative trait loci (QTL) mapping of resistance to Sclerotinia sclerotiorum (Maringolo, 2007), and also has commercial use as oilseed maintainer (Paniego et al., Reference Paniego, Echaide, Muñoz, Fernandez, Torales, Faccio, Fuxan, Carrera, Zandomeni, Syarez and Hopp2002). Prao-Co was developed at INTA EEA Manfredi. It was created by intercrossing between a wide range of high-oleic commercial hybrids from Italy. Forestal cambá is a derivative of the variety ‘Pehuén INTA’, which was developed at INTA EEA Pergamino to obtain an early variety with a high OC and resistance to P. helianthi. HAR1 and HAR4 CP were derived from a genetic pool developed at the EEA Pergamino (INTA, Argentina) known as ‘Mezcla Precoz’ (Early Mix). The latter came from an intercross between lines from several Russian varieties and the wild species H. annuus ssp. annuus, Helianthus petiolaris and Helianthus argophyllus. The HAR1 and HAR4 lines derived from the respective CP are used as international differential lines for P. helianthi, and for P. helianthi and Plasmopara halstedii, respectively. HAR2 CP was derived from the variety Impira INTA (EEA Manfredi). The associated line HAR2, registered at the USDA, Fargo, ND (Gulya, Reference Gulya1985), was developed from this CP and is currently used as the international differential line for P. helianthi (Gulya and Maširevic, Reference Gulya and Masirevic1995). HAR3 CP was developed based on the ‘Charata INTA’ selection, which was obtained by interspecific crossings between Russian varieties and wild germplasm belonging to the species H. annuus ssp. annuus, H. petiolaris and H. argophyllus. ‘Charata INTA’ also showed resistance to P. halstedii. Comangir was derived from local germplasm and shows extensive variation for diverse agronomical traits such as yield and resistance to biotic stresses. Originally provided by Pioneer, it was subsequently developed at the INTA EEA Manfredi, Argentina. Colliguay is a Chilean accession that also shows extensive variation for agronomical traits and is well adapted to Argentinian growing conditions.
Furthermore, 309 accessions, hereafter the global set, were included in the study as a representative panel of the agro-morphological diversity of the AGB-IM.
Genomic DNA extraction and microsatellite genotyping
DNA was extracted from the young leaves of 5-week-old plants grown in the greenhouse, using the NucleoSpin Plant II (Macherey-Nagel, Germany) genomic extraction kit. Sixteen microsatellite loci (simple sequence repeat (SSR)) were selected from a preliminary survey of 35 based on reproducibility, straightforward interpretation, the frequency of null alleles and the distribution across different linkage groups (Paniego et al., Reference Paniego, Echaide, Muñoz, Fernandez, Torales, Faccio, Fuxan, Carrera, Zandomeni, Syarez and Hopp2002; Poormohammad Kiani et al., Reference Poormohammad Kiani, Talia, Maury, Grieu, Heinz, Perrault, Nishinakamasu, Hopp, Gentzbittel, Paniego and Sarrafi2007; Supplementary Table S1, available online only at http://journals.cambridge.org). PCR amplification and detection methods were performed as described previously (Poormohammad Kiani et al., Reference Poormohammad Kiani, Talia, Maury, Grieu, Heinz, Perrault, Nishinakamasu, Hopp, Gentzbittel, Paniego and Sarrafi2007, Talia et al., Reference Talia, Nishinakamasu, Hopp, Heinz and Paniego2010). A loading mix for capillary electrophoresis detection was prepared by multiplexing two SSR loci, as reported in Tang et al. (Reference Tang, Kishore and Knapp2003), based on allele fragment size compatibility, genotyping performance, allelic length range and map position. GeneMapper 4.0 software (Applied Biosystems, Foster City, CA, USA) was used to score SSR alleles.
Agro-morphological diversity analysis
Eight trial sets were conducted during 2002–2008 at five experimental locations (Manfredi, Córdoba (31°49′12″S; 63°46′00″W); Balcarce, Buenos Aires (37°83′33″S; 58°25′63″W); Pergamino, Buenos Aires (33°51′00″S; 60°33′00″W), Reconquista, Santa Fé (29°14′48″S; 59°64′35″W) and El Colorado, Formosa (26°03′00″S; 59°36′67″W) as part of the sunflower germplasm bank activity. The experimental design used was alpha lattice with three replications. Each plot consisted of two 5.10 m rows with 70 cm apart between the rows. Seventeen seeds were sown per row; passport data were recorded for each accession.
Data for 17 morphological and agronomical traits were retrieved from the AGB-IM evaluation records for the 14 accessions included in this study (selected set) and for 309 accessions representative of the agro-morphological diversity of the AGB-IM (global set). Nine quantitative traits were included in the data matrix: leaf width (LW); leaf length (LL); leaf area (LA); height to flowering (HF); head diameter (HD); stem diameter (StD); days to maturity (DM); weight of 100 seeds in g (100-SW); OC. Eight qualitative traits were also used for the analysis: leaf surface (LS); leaf shape (LSH); leaf margin (LM); head inclination or obliquity (HO), anthocyanin presence (AP); branching pattern (BP); seed colour (SC); seed stripes (SS). To account for the variation within the accessions, HO was decomposed into five binary characters according to the inclination angle of sunflower heads (ICD1 45°, ICD2 90°, ICD3 135°, ICD4 180°, ICD5 225°). Similarly, BP was divided into four binary characters (WB, without branching; BB, basal branching; AB, apical branching; TB, total branching). Agro-morphological diversity of the selected set of accessions was compared with that of the global set using descriptive statistics (i.e. mean, standard deviation, coefficient of variation) and principal component analysis (PCA) for quantitative traits, and the Shannon and Weaver (Reference Shannon and Weaver1963) diversity index and principal coordinate analysis (PCO) based on the simple matching index for qualitative traits. PCA and PCO were conducted using InfoGen (Balzarini et al., Reference Balzarini, Bruno, Peña, Teich and Di Rienzo2010). Affiliations among the accessions were also assessed using cluster analysis. Mean values were used for quantitative characters and standardization was applied to remove unequal weights imposed by the use of different scales of measurement. A taxonomic distance matrix and an unweighted pair group method with the arithmetic average (UPGMA) dendrogram were obtained using NTSYS-pc 2.11 software (Rohlf, Reference Rohlf2004).
Genetic diversity analysis
Allele frequencies, the mean number of alleles per locus (A), allelic richness (Rs) (El Mousadik and Petit, Reference El Mousadik and Petit1996) and gene diversity (He) (Nei, Reference Nei1972, 1987) were computed using FSTAT (Goudet, 2001). Estimates of observed heterozygosis (Ho) were obtained by direct count from the raw data matrix. The presence of private alleles was examined for each OP and CP. Null allele frequencies were estimated by direct count from raw data. Comparisons of genetic diversity indices between categories were conducted using the permutation test implemented in FSTAT.
To evaluate the discriminant power of our SSR panel, the probability of identity (PID) and the PID considering genetic similarity among siblings (PIDsib) were calculated across the complete data matrix, according to Waits et al. (Reference Waits, Luikart and Taberlet2001), using GenAlEx (Peakall and Smouse, Reference Peakall and Smouse2006). The polymorphism information content (PIC) (Anderson et al., Reference Anderson, Churchill, Autrique, Tanksley and Sorrells1993) was computed using PowerMarker 3.25 (Liu and Muse, Reference Liu and Muse2005).
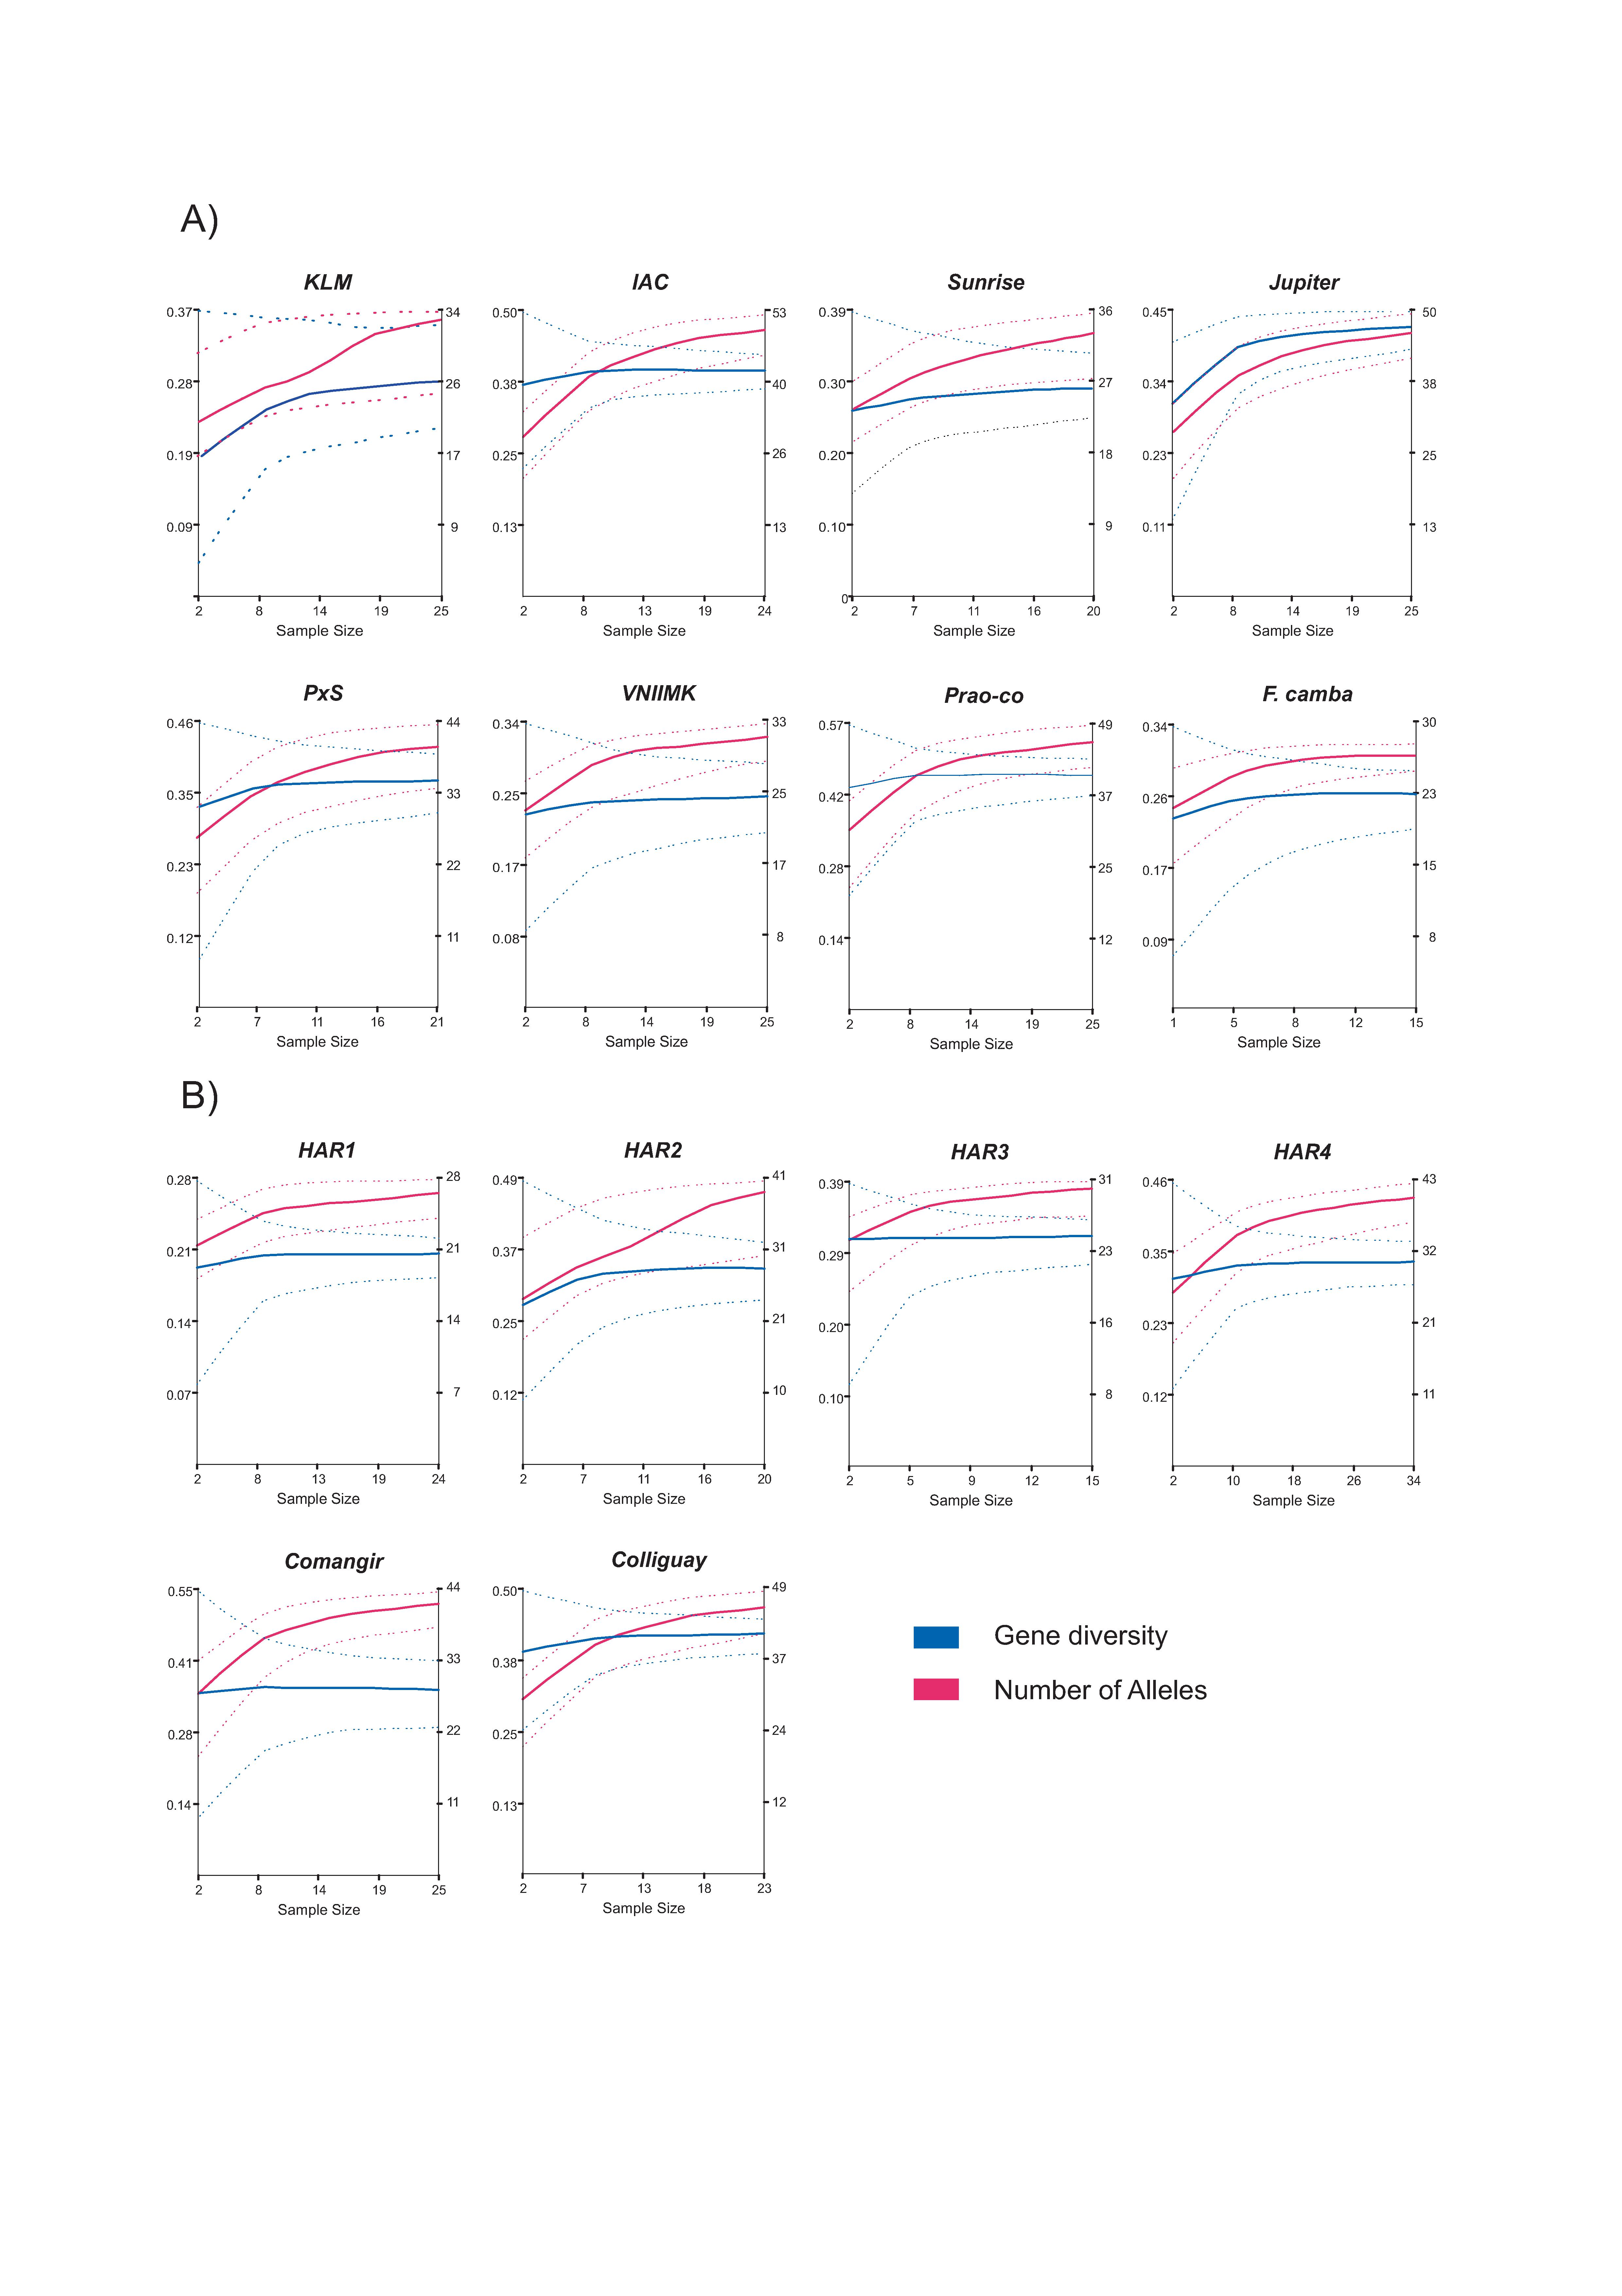
To assess whether our sampling intensity allowed accurate estimation of genetic variability within each OP and CP, rarefaction curves were constructed for the number of alleles and gene diversity indices using the bootstrap resampling procedure implemented in InfoGen (Balzarini et al., 2003) with 250 replicates per size category.
The relative contribution of each OP and CP to the pools of individuals maximizing genetic variation (i.e. the number of alleles) was estimated using the annealing algorithm implemented in the software PowerMarker 3.25 to build core sets of different sizes (10–50 individuals), with five repetitions and 1000 replicates for each size.
Population structure and genetic relationships
Estimates of Wright's (Reference Wright1978) fixation indices were obtained according to Weir and Cockerham (Reference Weir and Cockerham1984) using FSTAT software (Goudet, 2001). Significance was determined using the randomization test implemented in the same package. Departures from Hardy–Weinberg proportions (HW) at individual loci were tested within each accession.
The Bayesian model-based approach of Pritchard et al. (Reference Pritchard, Stephens and Donnelly2000) was used to infer population structure using the software Structure 2.2. The number of clusters evaluated ranged from 1 to 20. All simulations were run with a burn-in period length of 1 × 10⁵ and a run length of 5 × 10⁵ under the admixture model and correlated allele frequencies, with no prior information on the origin of individuals (Falush et al., Reference Falush, Stephens and Pritchard2003). Ten replicate runs were performed for each K to assess the variation of likelihood values. The most likely number of clusters was determined using the ad hoc criteria described in the software documentation (Pritchard and Wen, Reference Pritchard and Wen2003) and the ΔK method of Evanno et al. (Reference Evanno, Regnaut and Goudet2005).
Population structure was also examined by applying the discriminant analysis (DA) of principal components (DAPC; Jombart et al., Reference Jombart, Devillard and Balloux2010), a recently developed multivariate method designed to identify and describe clusters of genetically related individuals, which is free of assumptions about HW or linkage equilibrium, and thus more appropriate for the analysis of breeding materials. Briefly, the method relies on allele data transformation using PCA as a prior step to DA. DA defines a model in which genetic variation is partitioned into a ‘between-group’ and a ‘within-group’ component. Groups can be defined a priori (i.e. populations, collection sites, temporal affiliations, etc.) or can be inferred using first sequential K-means (Legendre and Legendre, Reference Legendre and Legendre1998) and model selection. DAPC was performed using the Adegenet package (Jombart, Reference Jombart2008) for R 2.10.1 software (R development Core Team, 2009). The function DAPC was executed using the clusters identified by K-means. The number of clusters was assessed using the function ‘find.clusters’, evaluating a range from 1 to 40. The optimal number of clusters was chosen on the basis of the lowest associated Bayesian information criterion. Three PCs were retained to construct discriminant functions.
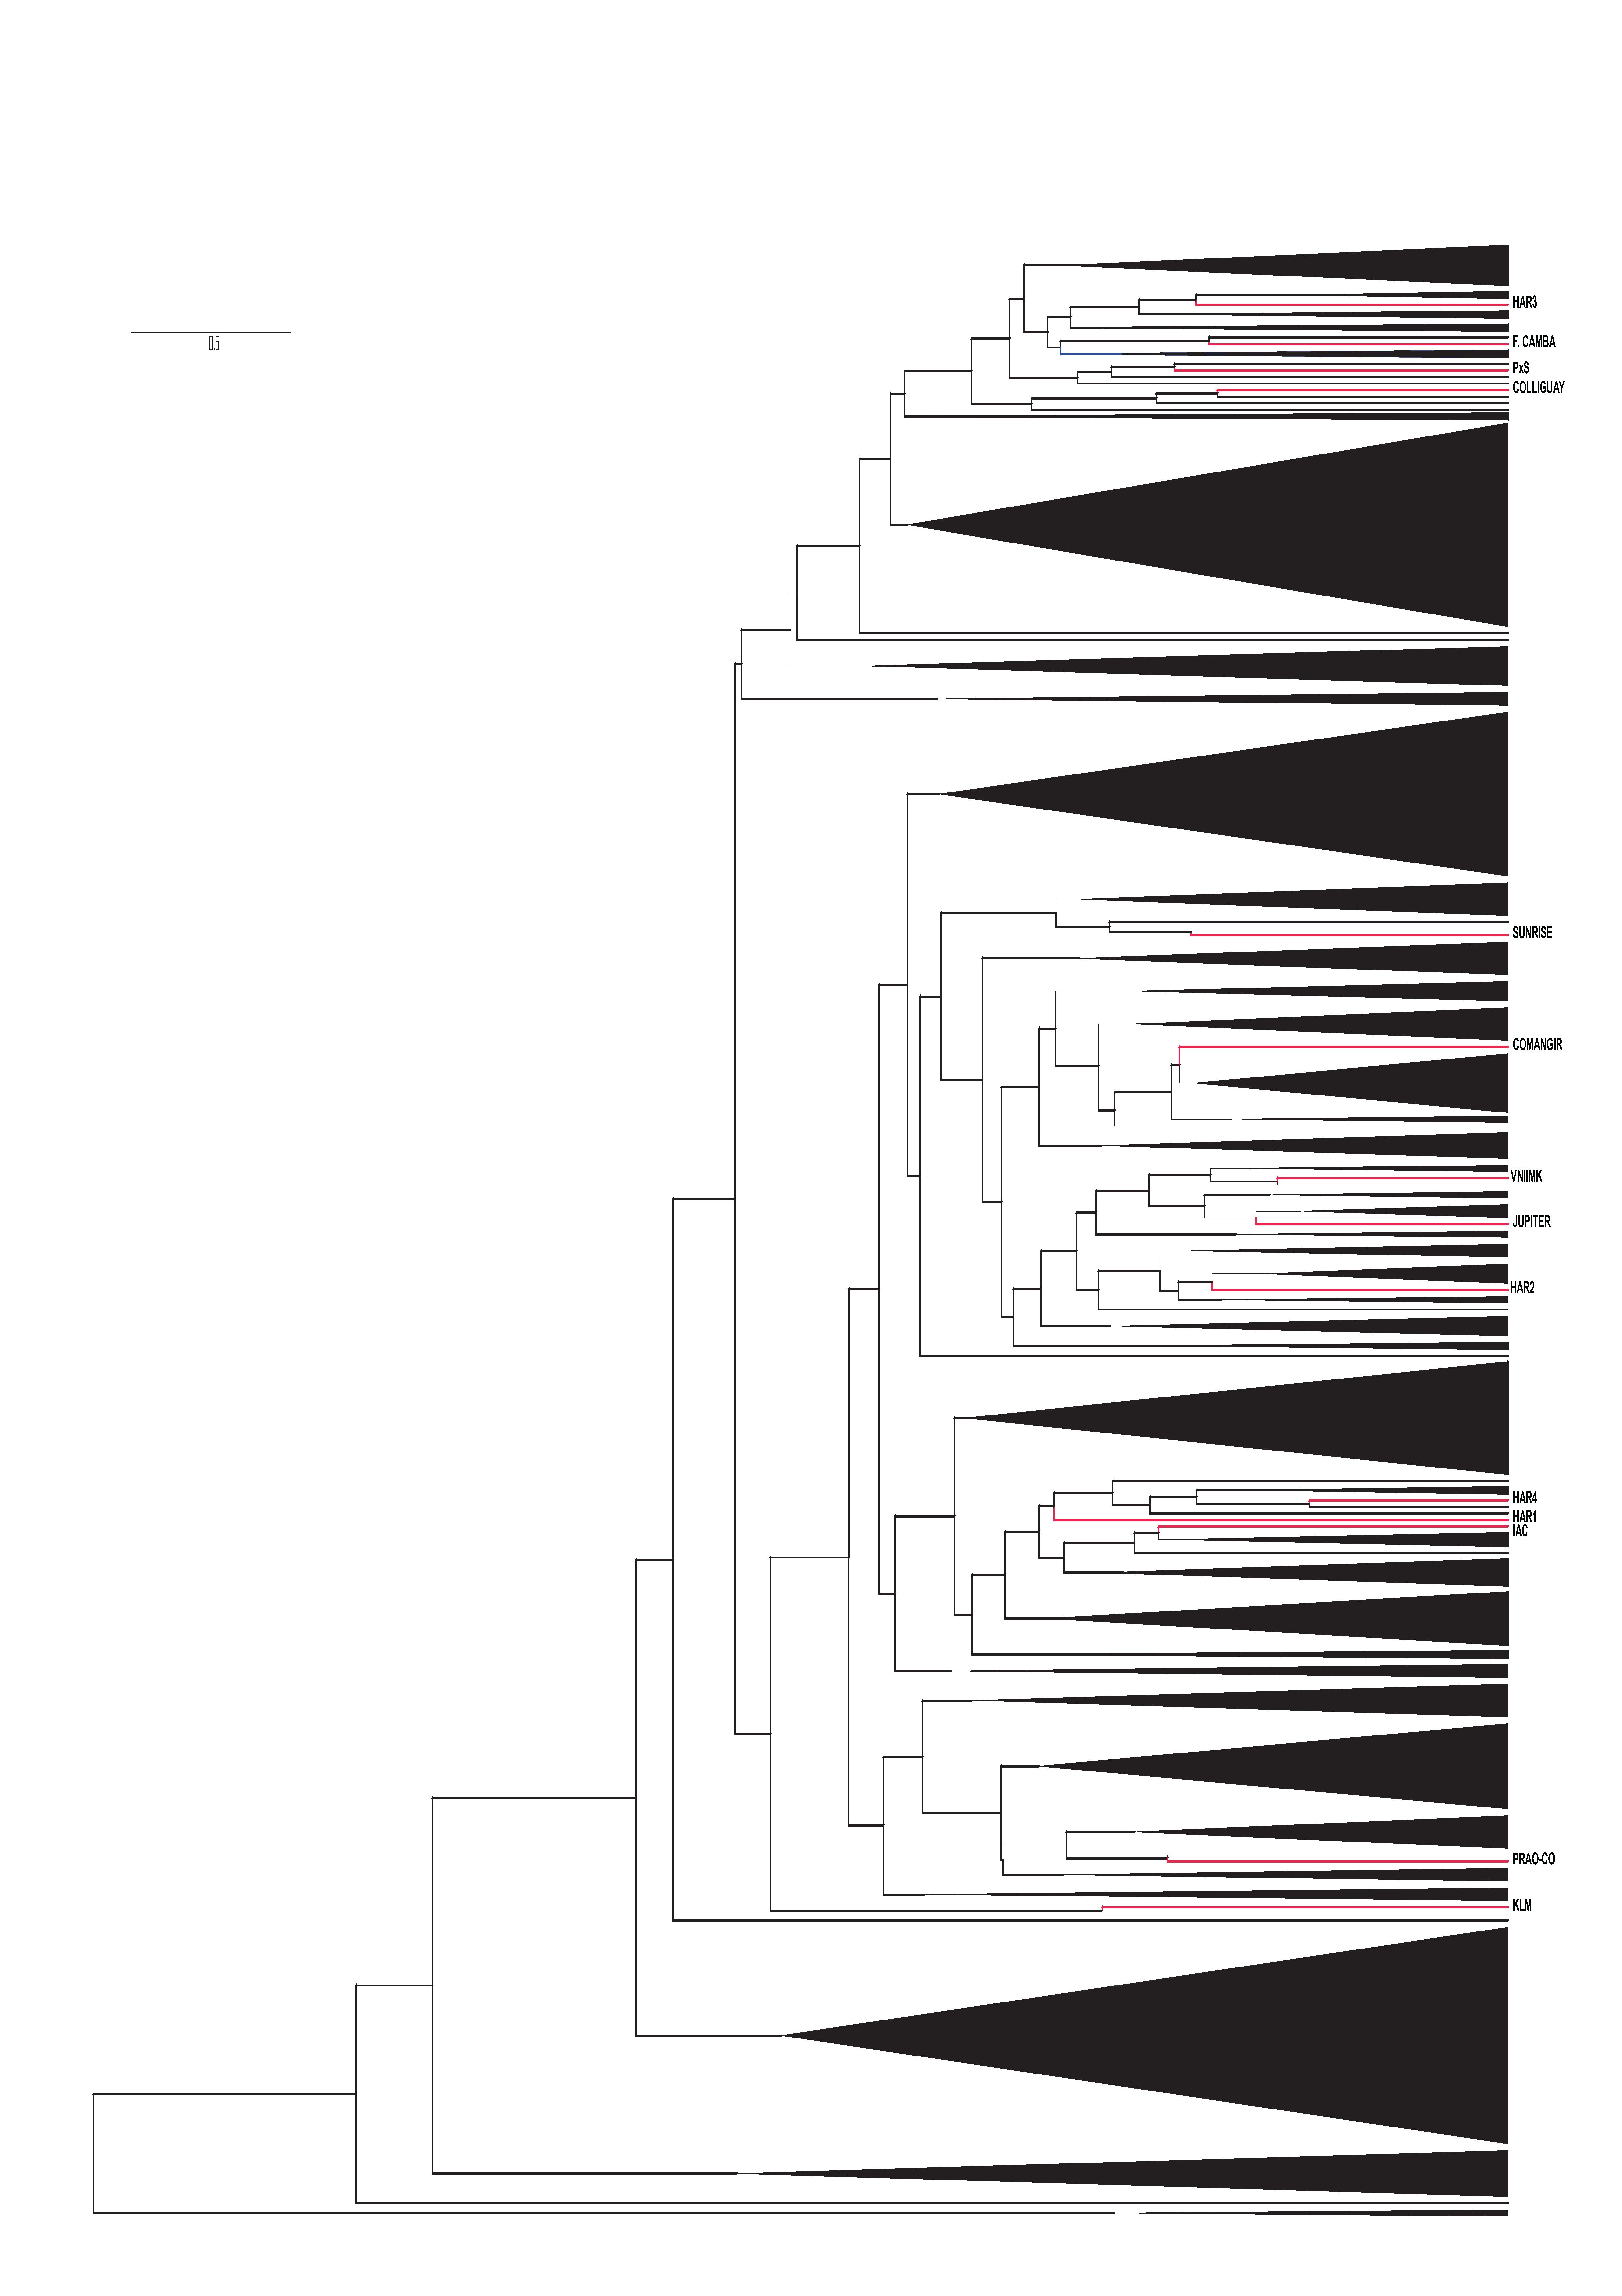
Genetic distances were calculated between pairs of accessions using Nei's genetic distance (Reference Nei1972, Reference Nei1987). A dendrogram was constructed using the neighbour-joining method (NJ; Saitou and Nei, Reference Saitou and Nei1987) and branch support was estimated by bootstrapping (1000 pseudoreplicates). Genetic distance calculations, cluster analyses and resampling were performed with PowerMarker 3.25. The resulting tree was visualized and edited with the program Fig-Tree v. 1.3.1 (Rambaut, 2006–2009).
Results
Agro-morphological variation
Descriptive statistics for the nine quantitative agro- morphological traits evaluated in this study are presented in Table 2. A large phenotypic variation was observed for all traits. The highest coefficients of variation were found for LA, 100-SW and HD. No statistically significant differences were detected between the selected and global sets of accessions in any of the evaluated traits (t-test, P>0.05). Mean values of the accessions included in the selected set are presented in Supplementary Table S2 (available online only at http://journals.cambridge.org).
Table 2 Quantitative trait diversity in the global and selected sets of accessions from the Active Germplasm Bank of INTA Manfredi

SD, standard deviation; CV, coefficient of variation; PC1, principal component 1; PC2, principal component 2; LW, leaf width; LL, leaf length; LA, leaf area; HF, height to flowering; HD, head diameter; StD, stem diameter; DM, days to maturity; 100-SW, weight of 100 seeds in g; OC, oil content; Ns, non-significant (P>0.05).
The Shannon–Weaver diversity index (H′) was used to measure phenotypic richness in qualitative characters. A low H′ indicates an extremely unbalanced frequency of classes for an individual trait and a lack of diversity. In the present study, most of the H′ values of the selected set were similar to those of the global set, with no statistical differences between the means of the two groups (Wilcoxon rank test, P>0.05; Table 3). The traits ICD1 and AB showed no variation in the selected set. Details of the qualitative trait variation for the selected set are given in Supplementary Table S3 (available online only at http://journals.cambridge.org).
Table 3 Shannon–Weaver diversity index (H′) for 15 qualitative descriptors in the global and selected sets of accessions
LS, leaf surface; LSH, leaf shape; LM, leaf margin; ICD1–ICD5, range of head obliquity; AP, anthocyanin presence; WB, without branching; BB, basal branching; AB, apical branching; TB, total branching; SC, seed colour; SS, seed stripes.
PCA revealed that the first three PCs accounted for 50.6, 13.7 and 11% of the total variability, respectively. The variation in PC1 was mainly associated with LW, LL, LA and OC, whereas the variation in PC2 was primarily determined by HD, DM and OC (Table 2). The PCA biplot showed no clear groupings, with the accessions included in the selected set being evenly distributed along both PCs (Fig. 1). The PCO of qualitative traits allowed discrimination of three main groups along the first axis. Again, the accessions of the selected set were interspersed along both axes and were represented in all the three groups.

Fig. 1 Morphological variation of the sunflower accessions from the AGB-IM. (a) PCA based on the nine quantitative traits. (b) PCO based on the eight qualitative traits. Accessions from the selected set are indicated by large black circles.
The UPGMA dendrogram also showed the accessions of the selected set to be scattered among the accessions of the global set (Supplementary Fig. S1, available online only at http://journals.cambridge.org).
Genetic diversity
A total of 311 sunflower individuals from the selected set were genotyped with 16 SSR markers, revealing the presence of 100 alleles. Missing data accounted for 4.86% of the data matrix. The average null allele frequency was 0.027 for OP and 0.020 for CP. Among the 100 alleles identified, 17 (17%) were private or exclusive of a given accession. The total number of alleles detected for OP and CP was 91 and 74, respectively. The average A across the whole set of individuals was 6.25 and the average He was 0.56. A summary of genetic diversity estimates per category and accession is presented in Table 4. The statistical comparison of genetic diversity indices (Rs, He and Ho) showed no significant differences between the OPs and CPs (P>0.05).
Table 4 Genetic diversity estimates in the open-pollinated populations and composite populations from the Active Germplasm Bank of INTA Manfredi
A, mean number of alleles per locus; Rs, allelic richness; He, gene diversity.
In order to evaluate the adequacy of our SSR panel for a reliable characterization of the AGB-IM collection, PIC, PID and PIDsib values were calculated across the complete data matrix. The PIC values varied from 0.80 (HA1848 and HA2077) to 0.20 (HA3581), with an average of 0.50 (Supplementary Table S1, available online only at http://journals.cambridge.org). The single-locus PID values ranged from 0.052 (HA1848) to 0.62 (HA3581), whereas the PIDsib values ranged from 0.358 (HA1848) to 0.795 (HA3581). The PID product over all loci was 4.2 × 10− 11 and PIDsib was 3.4 × 10− 5. Reducing the SSR panel to the ten loci with the highest PID values yielded cumulative PID and PIDsib values of 5.26 × 10− 9 and 3.9 × 10− 4, respectively.
Core sets of individuals capturing the maximum number of alleles for a given sample size were obtained in order to assess the relative contribution of each accession to the overall variation. The 100 alleles identified at the 16 loci used in this study were fully represented by 90 individuals (28.93%). Of the 14 accessions analysed here, seven contributed to the core sets of ten individuals. For the core sets having more than 40 individuals, the distribution of accessions was relatively even, except for HAR3 and VNIIMK, which showed only a minor contribution for core sets under 80 individuals (Supplementary Table S4, available online only at http://journals.cambridge.org).
Rarefaction curves were constructed to represent the number of alleles and gene diversity as a function of sampling effort within each accession (Supplementary Fig. S2, available online only at http://journals.cambridge.org). In all cases, the number of alleles showed an incremental tendency with the increase of sample size, although slopes were markedly different depending on the accession. The curves of the OP Prao-Co, Jupiter, IAC, P × S, VNIIMK and F. camba reached a plateau at a number of individuals that ranged from 5 to 13, whereas 5 to 17 individuals were needed to enter the curvilinear phase for the CP Comangir, Colliguay, HAR1, HAR3 and HAR4. For KLM, Sunrise and HAR2 a steady increment was still apparent for the sample sizes considered in this analysis. Rarefaction curves of genetic diversity showed that all accessions reached a plateau around five to ten individuals.
Population structure
Global fit to HW proportions was only observed for the composite HAR1. FIS values per locus and accession are presented in supplementary Table S5 (available online only at http://journals.cambridge.org). In most cases (KLM, IAC, HAR4, Colliguay, HAR3, P × S, Prao-Co, VNIIMK, Jupiter, Sunrise, Comangir, HAR2 and F. camba), deviations were detected under the alternative hypothesis of heterozygote defect, with HA2077 being the only locus showing an excess of heterozygotes (F IS= − 0.7388; P< 0.001; Supplementary Table S5, available online only at http://journals.cambridge.org).
Global estimates of F ST revealed a considerable and statistically significant degree of differentiation among accessions (F ST= 0.413; CI = 0.386–0.440). The largest pairwise F ST was found for VNIIMK-HAR1 (F ST 0.6394), whereas the least differentiated pair was Colliguay-Jupiter (F ST 0.1795) (Supplementary Table S6, available online only at http://journals.cambridge.org).
Bayesian analysis of population structure using the model-based Bayesian approach of Pritchard et al. (Reference Pritchard, Stephens and Donnelly2000) provided further support to the existence of genetic structure in the set of accessions examined here. The log-likelihood values, Ln P(D), reached a plateau at K= 14, suggesting that genetic diversity is structured into 14 subpopulations. The method of Evanno et al. (Reference Evanno, Regnaut and Goudet2005) was also applied as a criterion to infer the most likely K value. The maximum ΔK was detected at K= 2 (32.02), with a second maximum at K= 14 (1.55). Inspection of Structure outputs showed that at K= 2, the sample was divided into a group consisting of individuals from KLM, HAR4, HAR1 and HAR2, and a second group composed of individuals from the remaining accessions (Fig. 2). At K= 14, the groupings detected at K= 2 are further subdivided into different clusters, matching almost exactly the accessions of origin, with high average membership coefficients. As an exception to this pattern, HAR4 seems to have received contributions from two different gene pools, which are the main constituents of HAR1 and HAR2, respectively. Similarly, two different gene pools were detected for Jupiter, although none of them is present in the other accessions. Prao-Co was the only accession showing substantial levels of admixture.
Fig. 2 Bayesian inference of the population structure. Each individual is represented by a thin vertical segment which can be partitioned into K-coloured segments that represent the individual estimated membership to the K cluster.
The results from DAPC also revealed the presence of genetically distinct groups among the accessions studied. When clustering individuals into the 14 groups identified by the successive K-means algorithm, the eigenvalues of the analysis showed that the genetic structure was captured by the first three PCS. KLM (cluster 8), HAR1 (cluster 12), HAR2 (cluster 1) and HAR4 (clusters 3 and 13) were clearly differentiated from the remaining composite and OPs, whereas no such distinction was apparent for the remaining accessions (Supplementary Fig. S3, available online only at http://journals.cambridge.org). Clusters 5 and 6 received contributions from seven and six accessions, respectively. Jupiter, Prao-Co, P × S and Sunrise were the most heterogeneous in terms of cluster assignment, with individuals distributed in three to four clusters (Supplementary Fig. S3, available online only at http://journals.cambridge.org).
The NJ reticulum based on Nei's genetic distances showed one major partition (bootstrap 81%; Supplementary Fig. S4, available online only at http://journals.cambridge.org). The two resulting clusters are in complete agreement with the uppermost level of structure detected by Bayesian analysis.
Discussion
Argentina is one of the pioneers of sunflower production worldwide and has a long tradition of crop breeding. Over the years, valuable varieties, cultivars and ILs have been obtained and preserved at private and government institutions, among which the AGB-IM is a national active seed bank that holds both wild and cultivated sunflower accessions. As has been increasingly recognized for many crops, knowledge of the molecular and morphological diversity of germplasm collections is of fundamental importance for the efficient development of breeding programmes since it provides a reliable classification system and facilitates the identification of accessions with potential utility for specific traits (De la Vega et al., Reference De la Vega, De Lacy and Chapman2007; Prada, Reference Prada2009; Tanksley and McCouch, Reference Tanksley and McCouch1997).
The OPs and CPs included in the present work are an essential part of the INTA sunflower breeding programme and have contributed to the bank's diversity since its origins almost 50 years ago. Indeed, considerable levels of morphological variability were detected for the 14 accessions studied here. Moreover, comparison of quantitative and qualitative characters revealed no statistical differences between these accessions (selected set) and the global set of 309 accessions for which phenotypic data were available, suggesting that the former can be considered representative of a large proportion of the diversity spectrum of the entire collection. Consistent with this notion, the results from ordination and cluster analysis also showed the selected set to be evenly distributed among the remaining accessions (Table 2; Supplementary Fig. S1, available online only at http://journals.cambridge.org).
Most of the agro-morphological traits analysed here have been routinely included in many diversity surveys (i.e. Seiler, Reference Seiler1984; Alvarez et al., 1992a, b; Belhassen et al., Reference Belhassen, Augé, Ji, Billot, Fernandez-Martinez, Ruso and Vares1994, Nooryazdan et al., Reference Nooryazdan, Serieys, Baciliéri, David and Bervillé2010, Kholghi et al., Reference Kholghi, Bernousi, Darvishzadeh Maleki, Pirzad and Hatami Maleki2011). In agreement with previous reports for wild sunflower populations (Seiler, Reference Seiler1984; Nooryazdan et al., Reference Nooryazdan, Serieys, Baciliéri, David and Bervillé2010), LA, 100-SW and HD exhibited the highest coefficients of variation. Accordingly, Nooryazdan et al. (Reference Nooryazdan, Serieys, Baciliéri, David and Bervillé2010) also found LL and HD to be among the main determinants of the distribution of accessions along the first and second PCs, respectively, with similar levels of variability accounted for by the first three components (ca. 80%).
Molecular characterization of seed bank collections has become a fundamental tool for the evaluation of genetic resources. However, prior to the present study, no such information was available for the sunflower germplasm preserved at the INTA collection. The results from the SSR analysis revealed high levels of genetic diversity, particularly when considered in the context of variability estimates reported by Mandel et al. (Reference Mandel, Dechaine, Marek and Burke2011) for a much larger array of sunflower cultivars. The average number of alleles per locus and gene diversity estimates obtained here across 311 individuals from 14 OPs and CPs (A: 6.25; He: 0.56) are remarkably similar to those found by Mandel et al. (Reference Mandel, Dechaine, Marek and Burke2011) in the analysis of 1729 plants corresponding to 433 accessions from Europe and North America (A: 6.8; He:0.47). Although these figures might not be strictly comparable since they were derived from different sets of SSR, with the latter corresponding to expressed sequence tag (EST)-SSR which are expected to show lower levels of variation, they are still indicative of the allelic diversity of the OP and CP preserved at the AGB-IM.
In spite of their prominent role in most breeding programmes, little is known about the levels and distribution of genetic variation within OPs and CPs. The main difference between these categories lies in the degree of heterogeneity of the breeding materials used to generate them. While an OP might be the result of combining individuals from different varieties, races, ILs or even species, the production of a CP is often restricted to the use of highly homozygous individuals from different ILs, rendering them theoretically less diverse than an OP. Although the genetic diversity indices obtained for the OP studied here were indeed slightly higher than those of CP, no statistically significant differences were detected between categories, suggesting that lower or higher levels of allelic diversity are not an intrinsic attribute of the CP or OP, but rather depend on the divergence of the breeding materials used to generate them. In line with these observations, no detectable differences in allelic diversity were found among the 12 cultivar classes (HA-Non-Oil, HA-Oil, RHA-Non-Oil, RHA-Oil, etc.) delimited by Mandel et al. (Reference Mandel, Dechaine, Marek and Burke2011), in which accessions with different improvement status were also included. As mentioned earlier, the OP and CP constitute ca. 60% of the AGB-IM collection and are thus a main concern in the delineation of sampling strategies for future molecular characterization efforts, particularly in terms of the number of individuals that need to be screened to fully represent within-accession diversity. As evidenced by the rarefaction curves, the sample sizes used in this work were large enough to reach a plateau for both the number of alleles and gene diversity in most of the accessions analysed, with no differences being apparent between the OPs and CPs (Supplementary Fig. S2, available online only at http://journals.cambridge.org). A detailed inspection of the curves suggests that a number of individuals around 15 would suffice to capture most of the alleles present within accessions and that approximately ten individuals would be needed to reach maximum gene diversity. The difference in the number of individuals required to maximize the two genetic diversity estimates indicates that the frequencies of those alleles captured with sampling efforts larger than ten individuals are too low to produce noticeable increments in gene diversity. From a different perspective, core set analyses also suggest that a lower number of individuals per accession could be used in future studies of AGB-IM molecular diversity. Core sets including only 29% of the 311 individuals examined have been shown to harbour the same number of alleles as the total sample and 74% of the alleles were retrieved in the core sets of ten individuals. Furthermore, the distribution of accessions in the core sets of different sizes indicates that all of them have a fairly similar contribution to the overall variation.
Another relevant aspect of future molecular analyses is selecting a set of markers that allows for a rapid and cost-effective evaluation of large numbers of individuals. The average PIC value of the SSR included in this work (0.50) was similar to the estimates reported by Zhang et al. (Reference Zhang, Le Clerc, Li and Zhang2005) for 78 loci and 124 sunflower ILs (0.51) and by Paniego et al. (Reference Paniego, Echaide, Muñoz, Fernandez, Torales, Faccio, Fuxan, Carrera, Zandomeni, Syarez and Hopp2002) for 170 SSR and 16 ILs. This last congruence was not unexpected given that the SSR used in this study are a subset of those developed by Paniego et al. (Reference Paniego, Echaide, Muñoz, Fernandez, Torales, Faccio, Fuxan, Carrera, Zandomeni, Syarez and Hopp2002). Considering the 16 loci analysed here, the probability of two individuals having the same profile was less than one in 23 billion, with this probability rising to one in 30,000 under the extremely conservative assumptions of the PIDsib index. Interestingly, reducing the number of markers to ten by choosing the ones with the highest individual PID provided a discrimination power of one in 190 million when calculated from PID and of one in 2500 when calculated from PIDsib, which is largely within the range accepted in population genetic studies as an indication of the minimum number of loci required for reliable genetic tagging (Waits et al., Reference Waits, Luikart and Taberlet2001, Peakall and Smouse, Reference Peakall and Smouse2006). In sum, the ten SSR panel represents a fast and informative system to routinely characterize AGB-IM accessions in the context of applications such as fingerprinting, seed purity determination and contamination monitoring. From a broader perspective, the Working Group on Biochemical and Molecular Techniques and DNA-Profiling in Particular, from the International Union for the Protection of New Varieties of Plants, has been discussing the use of DNA-based techniques over the last 18 years and provided the guidelines for their utilization in the management of reference collections, variety identification and examination of essentially derived varieties. The SSR panel described here may also serve to fulfil any of these purposes.
Population structure analysis of the accessions included in this study was consistent with the morphological differentiation evidenced by ordination and cluster analyses. High levels of genetic differentiation among accessions were apparent from both global and pairwise F ST. The global F ST calculated here (0.43) almost doubles the estimate reported by Mandel et al. (Reference Mandel, Dechaine, Marek and Burke2011) in the comparison between wild and cultivated sunflower (0.22). Moreover, the pairwise F ST between the 12 broad categories recognized by these authors were also noticeably lower (range 0.016–0.183) than those found for the set of accessions examined here (range 0.1795–0.6394). High F ST values indicate large differences in the allelic frequencies of the entities being compared. Demographic processes, such as sudden population contractions often experienced by breeding materials, may lead to an increase of F ST estimates, which is generally accompanied by a reduction of genetic diversity. The remarkable population structure of the accessions included in this study does not seem to be the consequence of this type of phenomenon since genetic variability estimates were rather high and similar to those of previous studies showing lower F ST values (e.g. Mandel et al., Reference Mandel, Dechaine, Marek and Burke2011). In contrast, the observed pattern of differentiation is in agreement with the singularity of the so-called Argentinian germplasm and is most probably ascribed to its divergent origins, in both time and space.
In agreement with the observed levels of differentiation, Bayesian analysis of individual multilocus genotypes supported the existence of 14 ideal populations, matching almost exactly the original accessions. A more inclusive level of structure was also detected by the ad hoc procedure proposed by Evanno et al. (Reference Evanno, Regnaut and Goudet2005), revealing the presence of two main groups, which are completely concordant with the partition showing the highest bootstrap value in the NJ dendrogram. The first group is exclusively composed of accessions that are the product of local breeding programmes (KLM, HAR1, HAR2 and HAR4), whereas the second also includes germplasm of European and Canadian origin. Thus, no apparent geographic structure was discernable, neither were known pedigree relationships (Bertero de Romano and Vázquez, Reference Bertero de Romano and Vázquez2003). Because breeding populations often violate HW equilibrium, as demonstrated for the accessions included in this study, inferences drawn solely from model-based methods can be misleading. The results from DAPC were consistent with the existence of the two groups identified by Structure, although the DAPC approach provided a more detailed picture of within-group heterogeneity. The clusters representing the accessions KLM, HAR1, HAR2 and HAR4 were clearly differentiated along the scatterplot axes. In contrast, the accessions of the second group, although assigned to different clusters, were substantially overlapped, suggesting higher genetic similarity among them.
The availability of a genetically structured sunflower germplasm collection might be of relevance for many breeding applications. Recently, Reif et al. (Reference Reif, Zhao, Würschum, Gowda and Hahn2012) examined several strategies to predict hybrid performance using phenotypic and molecular data from two groups of sunflower lines adapted to Central Europe and their respective inter- and intra-group hybrids. They concluded that prediction of hybrid performance for crosses based on genetically distant parents remains challenging given that the association between heterosis and genetic distance was restricted to related lines, and that genomic selection methods failed to provide accurate predictions for crosses among unrelated lines. Considering the moderate genetic differentiation among the lines studied by Reif et al. (Reference Reif, Zhao, Würschum, Gowda and Hahn2012) and that population structure, i.e. the relative contribution of intra- and inter-group components to the overall genetic variation, can have a profound impact on hybrid performance predictions, the set of accessions examined here may provide a valuable resource to assess the generality of the findings presented by these authors.
In summary, the accessions included in this study have shown to harbour significant levels of morphological and genetic variation. The results presented here provide a reliable and discriminant set of markers for the cost-effective molecular characterization of sunflower collections and offer the guidelines for the delineation of sampling strategies for OPs and CPs, thus aiding the efficient management and exploitation of these valuable genetic resources. Further efforts to integrate molecular and morphological data are currently underway to help establish a baseline for quality standards of sunflower germplasm collections based on objective indicators of genotypic and phenotypic diversity.
Acknowledgements
The authors wish to thank Ing. Diego Cordes for technical assistance and two anonymous reviewers for their valuable comments on the manuscript. Several grants from the INTA (AEBIO 241001, 241352, 245001 and 245711) and the Agencia Nacional de Promoción Científica y Tecnológica (PAE 37100 PID 073) are gratefully acknowledged.