Introduction
Measurement while drilling (MWD) is a key factor in drilling safety and its study is a critical field in drilling technology development. At present, downhole data transmission is achieved primarily by stimulating mud pressure pulses, and its transmission rate is generally lower than 1 bps [Reference Chen and Fang1]. As the downhole data transmission rate is much higher than that for mud pressure pulse technology, Electromagnetic MWD (EM-MWD) has recently become a topic of intense research in the field of MWD studies. This technology makes the entire drill string act as an antenna, propagating electromagnetic wave signals through the stratum to transmit downhole information [Reference Li and Nie2], and can be applied to air drilling, which uses air as a circulating medium. However, the propagation of electromagnetic wave signals in the stratum is affected by stratum characteristics. This is especially the case in low resistivity strata. In addition, signal attenuation can be severe, while the effective measurement depth is limited [Reference Dai and Liu3]. At the same time, EM-MWD technology is faced with the problems in high transmitting power and ease of interference, which reduces the frequency point of signal transmission. In addition, the transmission depth is shallow and the rate of signal attenuation is rapid. Due to these factors, there is no mature monitoring system for air drilling today [Reference Hussain, Huelvan and Adams4]. Therefore, in most air drilling operations, downhole conditions can only be assessed by ground-based monitoring systems, which greatly reduce the accuracy and timeliness of monitoring. In addition, acoustic signal transmission technology in drill strings, as well as intelligent drilling technology, has relatively fruitful research results in this field. However, these emergent technologies have not been widely utilized in the field due to the limitations in the sound power of acoustic generators [Reference Gao and Gardner5] and the transmission power of electromagnetic coils [Reference Mayor and Dragor6].
Due to the low efficiency and serious pollution caused by drilling fluid technologies that use mud as a circulation medium, research in the field of non-mud medium drilling technology has developed rapidly in recent years. As a novel, high-efficiency non-mud medium drilling technique [Reference Kolaric and Lee7], air drilling still requires development of techniques for assessing downhole conditions in time to avoid major accidents and compromises in safety [Reference Hao, Wang and Lan8]. In this context, a new wireless transmission technology is urgently needed to achieve long-distance and high-speed data transmission. In order to meet this need, it is feasible to send microwave signals down the drill pipe, which enables ground monitoring personnel to obtain a wealth of data and information in real time. The idea behind this technique comes from EM-MWD, but it can avoid the inherent restrictions of stratum characteristics on electromagnetic wave propagation.
The work of Meng et al., treated the drill pipe as an ideal cylindrical waveguide and analyzed the propagation characteristics of 2.4 GHz microwaves in a steel pipe with an inner diameter of 107 mm. In that same study, the possible wave patterns in the drill pipe, the cut-off wavelength, and the attenuation coefficient were calculated [Reference Meng, Chen and Zhou9]. At the same time, the results showed that the microwave transmission rate in the drill pipe was very high, with a large bandwidth. However, only the filling dielectric loss in the drill pipe body was considered. The scattering and reflection losses caused by the drill pipe joints were not likewise considered. Accordingly, the study's calculation results are quite different from field measurements. In [Reference Xia, Meng and Li10], the author conducted a preliminary test on the transmission characteristics of a drill pipe channel but did not establish a critical attenuation model based on the test results. In addition, there has not been much further research on drill pipe microwave channels. This situation restricts the development of air drilling technology.
In this paper, the drill pipe wall is regarded as a long, irregular, and lossy cylindrical waveguide to construct the drill pipe bore channel model. Meanwhile, the characteristics of the microwave channels in the drill pipe bore are analyzed and an average attenuation model per unit of pipe length is obtained for the first time. Furthermore, the calculation results of the model show the relevant bandwidth and maximum transmission rate parameters of the microwave channel.
Multipath attenuation model in drill pipe bore
The drill pipe bore can be regarded as a discontinuous, long coaxial cylindrical waveguide, and it is an important feature of drill pipes that makes them unique when compared with waveguide components in general. If the step waveguide approximation method is adopted, the inner wall of the drill pipe can be divided into m segments, and the inner diameter of each segment is a m, consisting of m reflecting surfaces [Reference Xia, Meng and Li10, Reference Davidson and Lindsay11]. If the path of each reflection wave is taken into account based on the principle of ray tracing [Reference Mahmoud and Wait12, Reference Zhang13], the entire drill pipe can be regarded as a multipath channel [Reference Ndoh and Delisle14]. The channel model is determined based on the measured data from the testing equipment.
The experimental equipment at the State Key Laboratory of Oil and Gas Reservoir Geology and Exploitation consisted of a complete American Petroleum Institute (API)  $5^{1/2 \prime \prime} $ drill pipe connected to an API
  $5^{1/2 \prime \prime} $ male connector (see Fig. 1). A transmitting antenna was mounted on the drill pipe tube end plane while a receiving antenna was mounted on the drill pipe tube end plane of the male connector.

Fig. 1. Cutaway view of the experimental equipment of a drill pipe.
Specifically, the parts between the transmitting and receiving antennae comprise a complete cascade drill pipe unit, including an 8.1 m drill pipe body section as well as a pair of 1.15 m male and female connectors. The total length of the study's drill pipe was ~9.25 m, and the inner tube wall was slightly rusted. The receiving antenna could move slightly along the axial direction. To reduce the reflection of electromagnetic waves, a terminator was installed at both ends of the drill pipe. The terminator's impedance at 2.4 GHz is 470 Ω matches the characteristic impedance of the drill pipe. To determine the channel model, a frequency domain method was used to measure the impulse response of the channel. The test data were received from a Hewlett Packard (HP) 8753ES network analyzer with an optional time domain measurement function (Table 1).
Table 1. Parameters of the omni-directional antenna

During the experimentation process, the HP8753ES was set up with 801 test points in the 0–4.8 GHz frequency band (with 006 options), with a central frequency point of 2.4 GHz, so that the time-bin was 0.2 ns [Reference Rissafi and Talbi15]. The power delay profile test results were obtained by the corresponding data processing [Reference Guan, Ai and Zhong16, Reference Zhou and Jacksha17]. The transmitting and receiving antennae were set to maintain a 9.25 m test distance over multiple tests. Figure 2 presents typical power delay profile test results.

Fig. 2. Schematic diagram of power delay profile.
The channel impulse response observed in the test result data shows a multipulse phenomenon. Two distinct clusters can be seen in Fig. 2, with multipath rays with random arrivals, present within each cluster. The first cluster's initial ray arrival time was about 32 ns (T 1 = 32 ns), which was consistent with the 9.25 m distance between the two antennae. The first cluster can be regarded as a direct wave pulse waveform. The delay between the second cluster head and the first cluster head was 51 ns, which was consistent with the time during which the electromagnetic wave propagated back and forth across the pipe body (T 2 = 83 ns). A third cluster is not clearly visible in the waveform, indicating that the energy of the electromagnetic wave can be maintained only for a back and forth reflection in the pipe body section.
Using τ k,j (j = 1,2) to indicate the additional delay of the kth pulse in the first or second cluster with respect to the first pulse, and using g k,j (j = 1,2) to indicate the gain factors of the corresponding path, the channel model can be characterized by the following impact response function [Reference Wang and Zhang18]:
 $$h_2(t) = \sum\limits_{k = 1}^p {g_{k,1}\delta (t - T_1 - \tau _{k,1})} + \sum\limits_{k = 1}^q {g_{k,2}} \delta (t - T_2 - \tau _{k,2}).$$
Because the received signal is composed of several different path signal vectors, i valid paths form i pulses. Therefore, it is obvious that p + q = i. On the basis of the optical similarity of the high-frequency electromagnetic wave as well as the basic law of light transmission, the relation between the received antenna power P r and the transmitted antenna power P t can be obtained under the geometrical optics model [Reference Yao and Wu19], as equation (2).
 $$P_r = P_t\left( {\displaystyle{\lambda \over {4\pi L_0}}} \right)^2G\left \vert {1 + \sum\limits_{k = 1}^i {g_k\exp (\,j\Delta \phi_k)}} \right \vert ^2,$$
 $$\Delta \phi _k = \displaystyle{{2\pi C\tau _k} \over \lambda}, $$
where, λ, the wavelength of the 2.4 GHz microwave; L 0, the distance between the transmitting and receiving antennas, about 9.25 m; G, antenna gain; C, the speed of light in the air.
During the drilling process, the length of the drill string generally exceeds 1000 m, and the length continuously changes, so it is difficult to analyze the transmission condition of the entire drill string. The unit length microwave average attenuation coefficient model can effectively reflect the attenuation law of microwave energy with the length of the drill string. The model of the average propagation attenuation coefficient of the drill pipe unit under multipath conditions can be obtained, as equation (4).
 $$\alpha = \displaystyle{{10\lg \,(P_t/P_r)} \over {L_0}} = \displaystyle{{10} \over {L_0}}\lg \left[ {{\left( {\displaystyle{{4\pi L_0} \over \lambda}} \right)}^2\displaystyle{1 \over G}{\left \vert {1 + \sum\limits_{k = 1}^i {g_k\exp (\,j\Delta \phi_k)}} \right \vert}^{ - 2}} \right].$$
Analysis of determined parameters
In order to calculate the average attenuation coefficient, it is necessary to determine the values of the parameters g k and τ k in equations (3) and (4). The additional delay for the first path in each cluster is τ 1,j = 0. During the experiment, the transverse electric wave TE 11 mode was used as the propagation mode by frequency setting. The test results were processed so that the antenna gain was 1. So, g 1, j can be determined by the conductor loss  $\alpha _{11}^{TE} $ of the TE 11 mode in a circular waveguide [Reference Meng, Chen and Zhou9]:
 $$g_{1,1} = S_1 \cdot \alpha _{11}^{TE} = \displaystyle{{S_1R_s} \over {a_nZ_0\sqrt {1 - {(\lambda /1.71a_n)}^2}}} \left[ {{\left( {\displaystyle{\lambda \over {\lambda_{c,11}^{TE}}}} \right)}^2 + \displaystyle{1 \over {{(\rho_{11}^/ )}^2 - 1}}} \right],$$
 $$g_{1,2} = S_2 \cdot \alpha _{11}^{TE} = \displaystyle{{S_2R_s} \over {a_nZ_0\sqrt {1 - {(\lambda /1.71a)}^2}}} \left[ {{\left( {\displaystyle{\lambda \over {\lambda_{c,11}^{TE}}}} \right)}^2 + \displaystyle{1 \over {{(\rho_{11}^/ )}^2 - 1}}} \right],$$
 $$\lambda _{c,11}^{TE} = \displaystyle{{\pi \cdot a_n} \over {\rho _{11}^/}}, $$
where Z 0, the free-space wave impedance, 377-Ω; L m, the length of the tube, 8.1-m;  $\rho _{11}^/ $, the zero point of the first derivative of the Bessel function, 1.84; a n, the diameter of the waveguide, 118-mm; R s, the surface resistance, -Ω; S 1, the transmission distance factor of the direct wave, -m; S 2, the reflection distance factor of a reflection wave in the pipe segment, -m.
The primary material making up the drill pipe was low-carbon steel with a carbon content of <0.4%. The inside wall of the testing equipment was slightly rusted, so the average value of Rs is about 0.89 Ω by repeated measurements and calculations at many points along the circumference. S 1 and S 2 are written as equations (8) and (9), respectively.
 $$S_1 = \displaystyle{{L_0} \over {(1 + {\it \Gamma} _1)(1 + {\it \Gamma} _2) \cdot \cdot \cdot (1 + {\it \Gamma} _n)}},$$
 $$S_2 = \displaystyle{{(L_0 + 2L_m)} \over {(1 + {\it \Gamma} _1)(1 + {\it \Gamma} _2) \cdot \cdot \cdot (1 + {\it \Gamma} _n) {\it \Gamma} _m {\it \Gamma} _{m - 1}}}.$$
The reflection coefficients of the two ends of the pipe segment are represented by The Γ m−1 and Γ m, which can be calculated by the characteristic impedance Z m−1, Z m, Z m+1 of the L m−1, L m, and L m+1 waveguides, as seen in equation (10).
 $$\eqalign{ \Gamma _m &= \displaystyle{{Z_{m + 1} - Z_m} \over {Z_{m + 1} + Z_m}} \cr & = \displaystyle{{\sqrt {1 - {(\lambda /1.71a_m)}^2} - \sqrt {1 - {(\lambda /1.71a_{m + 1})}^2} } \over {\sqrt {1 - {(\lambda /1.71a_{m + 1})}^2} + \sqrt {1 - {(\lambda /1.71a_m)}^2} }}.} $$
 According to the structure of the API  $5^{1/2 \prime \prime} $ drill pipe, its S 1 was ~25.35, and was S 2 is ~82.97. The final results of g 1,1 and g 1,2 were about −9.02 and −29.53 dB, respectively. As seen in Fig. 2, the gain in the first and second cluster head was approximately −10 and −30 dB, respectively. This is consistent with the calculation results for conductor loss in the inner wall of the drill pipe.
Experimentation to determine statistical parameters
The power delay profile test was repeated 120 times, recording the gain coefficients of the corresponding path at delay times of 35, 50, 85, and 95 ns. The number of experiments is determined by the number of maximum distinguishable paths, and the test data were normalized by the maximum gain at each respective point in time. The path gain coefficient distribution and distribution fitting lines are shown in Fig. 3.

Fig. 3. Schematic diagrams of the path gain coefficient distribution and distribution fitting lines: (a) the first cluster(b) the second cluster.
According to the data presented in Fig. 3, the multipath gain g k,j basically obeys an independent log-normal distribution with a standard deviation of σ j (j = 1,2). The power gain of τ k,j was attenuated based on an exponential law.
 $$20\hbox{l} g(g_{k,j})\ \sim N(\mu _{k,j},\sigma _j) = \displaystyle{1 \over {\sqrt {2\pi} \sigma _j}}\exp \left( { - \displaystyle{{{(x - \mu_{k,j})}^2} \over {2\sigma_j^2}}} \right),$$
 $$\eqalign{\mu _{k,j} =& \displaystyle{{10\ln (g_{1,j}^2 ) - (10T_{1/2}/\Gamma {\mkern 1mu} ) - 10(\tau _{k,j}/\gamma _j)} \over {\ln (10)}} \cr & - \displaystyle{{(\sigma _1^2 + \sigma _2^2 )\ln (10)} \over {20}},} $$
 $$E( \vert g_{k,j} \vert ^2) = \vert g_{1,j} \vert ^2\exp \left( { - \displaystyle{{\tau_{k,j}} \over {\it \Gamma} }} \right),$$
where Γ is the attenuation coefficient of the cluster and solved by equation (14).
 $$ {\it \Gamma} = \displaystyle{{g_{1,2}} \over {g_{1,1}}} = \displaystyle{{L_0 + 2L_m} \over {L_0}} \cdot {\it \Gamma} _{m - 1} {\it \Gamma} _m = 3.27.$$
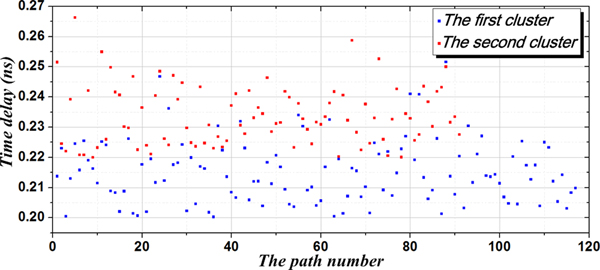
Based on the experimental data of the 120 power delay profile tests, the first cluster had 118 distinguishable paths above the set threshold, while the second clusters had 91 distinguishable paths above the set threshold. The delay data obtained by each experiment were averaged, and the result was used for the final delay data between the two adjacent paths. The delay distribution is shown in Fig. 4.

Fig. 4. Delay distribution between the two adjacent paths.
According to the fitting results, the delay between the two adjacent paths satisfies the independent exponential probability distribution [Reference Boutin and Benzakour20]. The probability density function is as equations (15) and (16).
 $$p(\tau _{k,1} \vert \tau _{k - 1,1}) = 1.11e^{[ - 7.75(\tau _{k,1} - \tau _{k - 1,1})]} - 0.482,$$
 $$p(\tau _{k,2} \vert \tau _{k - 1,2}) = 2.92e^{[ - 12.2(\tau _{k,2} - \tau _{k - 1,2})]} - 0.347.$$
Based on the τ rms calculation method, the measurement results of the drill pipe channel model are obtained as τ rms,1 = 3.11 and τ rms,2 = 3.78. In general, the power attenuation factor γ can be approximated by a mean square delay spread value, and based on practical experience, γ 1 ≤ γ 2, so the drill pipe power attenuation factors are γ 1 = 3.11 and γ 2 = 3.78. The spacing between the clusters in Fig. 5 is >30 ns. However, there is no obvious gap between the clusters in the two-cluster model reconstructed by the IEEE 802.15.3a standard model [Reference Chehri and Fortier21]. To make the channel root mean square (RMS) delay spread results more consistent with the channel characteristics, τ k,2 is modified by the two-cluster head ray interval η,
 $$ \eqalign{\tau _{rms} = & \Bigg\{ {\displaystyle{{\sum\nolimits_1^p {g_{k,1}^2 \tau_{k,1}^2} + \sum\nolimits_1^q {g_{k,2}^2 {(\tau_{k,2} + \eta )}^2}} \over {\sum\nolimits_1^{M + N} {g_k^2}}}} \cr& { - {\left[ {\displaystyle{{\sum\nolimits_1^p {g_{k,1}^2 \tau_{k,1}} + \sum\nolimits_1^q {g_{k,2}^2 (\tau_{k,2} + \eta )}} \over {\sum\nolimits_1^{M + N} {g_k^2}}}} \right]}^2} \Bigg\}^{1/2}.$$
Fig. 5. Comparison of results between the model and measured data.
For a drill pipe unit channel η is 51 ns. Under this condition, the RMS delay τ rms is 22.58 ns. Consequently, the maximum data transmission rate DTR = (2πτ rms)−1, is about 7 Mb/s, when the envelope correlation coefficient is 0.5.
Validation of the attenuation model
The received power of a single drill pipe unit was calculated based on equation (3) and the parameter values are provided in Table 2. Meanwhile, a Rigol DSA1030 spectrum analyzer was used to test the received power of the 2.395–2.405 GHz frequency band. The test results are compared with the calculation results in Fig. 5.
Table 2. Parameters value of the attenuation model

As seen in Fig. 5, at the 2.4 GHz frequency point, the measured and calculated received powers are −8.247 and −8.349 dB, respectively, with an error of 0.102 dB.
According to the algorithm from Meng et al., only the loss of surface resistance is considered,the calculation result is only −0.3 dB [Reference Meng, Chen and Zhou9], which varies from the measured value. By this comparison, it is clear that multipath fading is the major attenuation factor and the average attenuation coefficient model is more accurate and more consistent with the actual transmission condition. On the other hand, with the increase of frequency, the microwave wavelength is shortened and the multipath distribution in the channel changes. This is the primary factor behind the increase in the model error. However, the calculated results of the attenuation model are still very close to the measured values, indicating that the attenuation model is reasonably accurate.
Additionally, in the measured spectrum distribution diagram, it can be seen that the attenuation of received power significantly increases in frequency bands higher than 2.4015 GHz, while the attenuation is relatively stable in the 2.395–2.4015 GHz frequency band. Within the 6.5 MHz bandwidth, the channel has a relatively constant gain and the received signal experiences flat fading. The channel-related bandwidth is approximately 6.5 MHz.
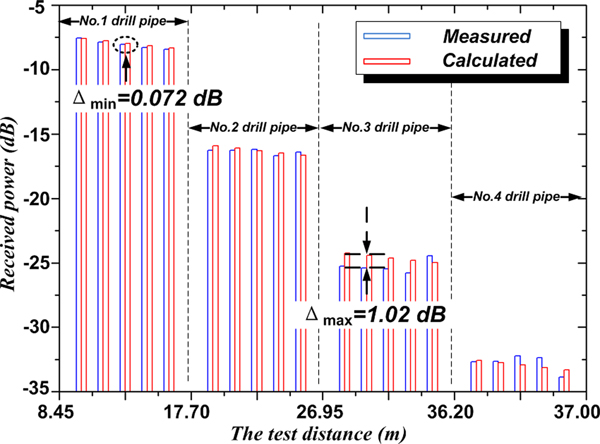
According to the bore structure of API  $5^{1/2 \prime \prime} $ drill pipe, the attenuation coefficient of unit length calculated by the formula (3), the result is: α = 0.104 Np/m. Four drill pipes were used to verify the correctness of the attenuation coefficient. As the drill string structure has periodic characteristics, the drill string formed by the four drill pipes can fully demonstrate the attenuation law. The specific method is as follows: Firstly, the test model as shown in Fig. 1 was set up with No. 1 drill pipe. The position of the receiving antenna could be moved in a step of 20 cm within a range of 0.8 m, and then the received power of the 2.4 GHz frequency was tested with a spectrum analyzer. Finally, the actual receiving power at different distances between the transmitting and receiving antennas were compared with the received power calculated by the unit length power attenuation coefficient, and the consistency was verified. Each drill pipe was tested for 5 times. After the first drill pipe test was completed, the No.1 and the No.2 drill pipes were connected, and the female heads were connected to the male end of the No.2 drill pipe. The test method for No. 3 and No. 4 was the same. Therefore, the distances between the antennas at each test point are as follows (Table 3):
Table 3. The distances between the antennas at each test point in the measurement of the power attenuation

According to equation (4), for each of the five test points of a drill pipe, it can be found that the theoretical calculation values follow the linear decreasing rule. However, the length of the drill string increases with the length of a single drill pipe, therefore, the theoretical calculated and the measured receiving power overall decline in the ladder-like trend. In the process of testing, both the number of drill pipe and the distance between each test point increase, so the multipath state will change, resulting in the fluctuation of the measured value, as shown in Fig. 6. However, the measured values also follow the linear decreasing rule, and the maximum difference with the theoretical calculation was only 1.02 dB, which proves the correctness of the theoretical calculation. The comparison result also fully shows that the power loss formed by the irregular structure of the drill string bore is the main factor affecting the transmission of the channel.

Fig. 6. Contrast diagram of power attenuation.
Conclusions
The drill pipe is a long and straight pipe that can be regarded as an extra-long, coaxial, and discontinuous cylindrical waveguide. Depending on the size of the pipe, a 2–3 GHz frequency band can be used to transmit a microwave signal in the drill pipe bore. Based on the measured results from a physical model, the microwave signal channel in a drill pipe unit is found to have the characteristics of a double cluster multipath channel. Multipath fading and delay are the primary factors that affect propagation quality therein.
The multipath propagation model and corresponding attenuation model can exhibit microwave propagation status in the drill pipe bore, and the calculation results of the attenuation model are closer to measured values when compared with an attenuation model that considers only surface resistance. Therefore, the modeling and testing methods used in this paper can be applied to other types of drill pipes, casing pipes, and similar, non-standard waveguide components.
At the same time, the attenuation model offers microwave propagation signal reflection and delay parameters, which can later guide the development of future drill pipe dedicated RAKE receiver designs. In addition, the attenuation coefficient calculation formula given in this paper presents the average attenuation coefficient per unit of pipe length. Due to the periodicity of the drill string structure, the average attenuation coefficient can be used to calculate the drill string attenuation for longer distances, and the propagation model in a single drill pipe unit can serve as the basis for subsequent drill string simulations and analyses.
Finally, due to slight corrosion of the inner wall of the experimental model, the surface resistance increased, resulting in a larger final attenuation. Regardless, the results are still acceptable. If new drill pipes are used to reduce attenuation, microwave transmission distance can be greatly improved under the same transmitting power. This shows that the technique of transmitting data by microwave signals in the drill pipe bore shows good prospects for future development and, as such, has continued research value.
Acknowledgements
This work was supported by National Science and Technology Major Project of China under project number 2016ZX05021-003-003HZ.
 Xia Wenhe received the Bachelor's degree in automation engineering from the Chongqing University, CQ, China, in 2002, and the Master's degree from University Of Electronic Science And Technology Of China, Chengdu, in 2007, where he is currently working toward the Ph.D. degree. His research interests are the modeling and calculation of electromagnetic wave propagation via the drill pipe and downhole data acquisition.
 Guan Wenting received the Bachelor's degree in Oil & Natural Gas Engineering from the Southwest Petroleum University, CD, China, in 2007, and the Master's degree in 2011. Her research interests are the design of measure while drilling project and fracturing acidification.
 Jiang Zujun Senior Engineer, SPE member, received the Bachelor's degree in Oil & Natural Gas Engineering from the Southwest Petroleum University, CD, China, in 1987. He is an academic leader in the field of gas drilling in China. He is currently engaged in applied research and management of new drilling technology.
 Meng Yingfeng Professor, SPE member, government special allowance expert of China, is an academic leader in the field of gas drilling in China and currently serves as chief technology officer of China's oil and Gas Corporation Key Research Institute of gas drilling. His main research fields are reservoir protection and gas drilling technology.
 Tang Bo is a Senior Engineer, SPE member. His main research interests are the electromagnetic modeling and calculation of petroleum and geological logging system, and is a reviewer for the Journal of Petroleum Science and Engineering for a long time.