


Introduction
The Covid-19 crisis has held the world in its grip since the World Health Organization first declared it a ‘global pandemic’ on 11 March 2020. This was the first such declaration by the WHO since the H1N1 flu pandemic of 2009, whose effects remained comparatively limited relative to long-held fears regarding the return of a deadly influenza along the lines of the so-called Spanish flu of 1918–1919. While epidemiologists and immunologists worried about the arrival of another airborne respiratory disease for which there were no vaccines or treatments, the United States and much of the developed world had come to believe that it lived in a world beyond epidemic disease. Indeed, developments in public health, medicine, and pharmaceuticals seemed to have largely subdued the kinds of diseases that took so much human life before the second half of the twentieth century. Yet SARS-CoV-2, the technical name of the virus that causes Covid, quickly revealed itself as an illness that could cause both severe symptoms, long-term harms, and a lonely, unpleasant death. As of early 2021, it had killed well over 873,000 people in the United States, over 141,000 in Italy and over 5.5 million people worldwide.Footnote 1 It has thus been approximately 15 times deadlier in the US than the average annual toll caused by the flu (Leonhardt Reference Leonhardt2021).
Given the early conclusion that Covid could kill many, many people if it were left unchecked, governments moved quickly – if not always quickly enough – to mitigate the spread and to ‘flatten the curve’. The latter term referred to the goal of preventing hospitals from being overwhelmed by an influx of people with a disease whose characteristics and likely victims were largely unknown at first and for whom little in the way of treatment was then available. It became clear relatively early on, however, that tried-and-true public health measures such as ‘social distancing’, hand-washing, and, more ambiguously at first, mask-wearing could help ‘flatten the curve’. But the first wave of the pandemic, in March and April 2020, nonetheless saw a serious spike in cases and deaths. Hospitals, morgues, and funeral homes were often overwhelmed, and recourse often had to be taken to refrigeration trucks outside hospitals as the dead simply piled up too fast. Streets were emptied of pedestrians and a climate of uncertainty and fear was pervasive. A Nobel Prize-winning biologist and former head of the National Institutes of Health, Harold Varmus, mused worrisomely about the ‘collapse of society’.Footnote 2
During those early, anxiety-inducing days of the pandemic, two places were the focus of international attention as epicentres of the pandemic outside the first outbreak area of Wuhan in China: the United States and Italy.
The initial outbreaks in the United States were associated with the Diamond Princess cruise ship in California, ‘Patient Zero’ – a recent returnee from travel to Wuhan, China – in Washington State, and a Jewish congregation in New Rochelle, just north of New York City, all of them attributed to connections to China (Christakis Reference Christakis2020, 12–20, 126–128; see Yang et al Reference Yang, Li, Lai, Ruktanonchai, Xing, Carioli and Wang2020 for the intercontinental Covid transmission dynamics). Research by biologists soon made it clear, however, that the sources of infection in New York were probably as much Italian as they were Chinese, although parts of northern and central Italy have strong Chinese connections (Milan and the textile manufacturing town of Prato, near Florence). As for Italy, the pandemic was disproportionately prevalent in a number of middle-sized cities in the north: Bergamo, Brescia, Lodi, Cremona, and elsewhere. Interestingly, these towns were once major bastions of support for the Lega Nord (Northern League), the anti-southern and anti-immigrant party founded by Umberto Bossi and now known simply as the Lega). The region's two major cities, Milan and Turin, were hard-hit, but not as badly in proportionate terms as these middle-sized cities had been.
The differences in the character of the outbreaks in Italy and the United States made for an interesting puzzle: why was the early outbreak in Italy centred in smaller cities rather than large, whereas it was in New York and environs that the outbreak was most devastating early on? We suspected initially that the pandemic in Italy was a function of a complex constellation of variables, such as the age of the population, the unexpected emergence of the virus, and the features of the local health system. In New York, the pattern seemed to fit a more familiar structure, the kind that one would expect from the course that most pandemics take: the poor suffer the worst (see Wade Reference Wade2020; Mukherjee Reference Mukherjee2021). Through the analysis of secondary data, we will offer empirical support to this statement.
Therefore, the paper explores the ‘tale of two epicentres’ – metropolitan New York and Lombardy – and seeks to describe the socio-demographic patterns that characterise two of the worst cases of infection, hospitalisation, and death during the early weeks and six months of the Covid pandemic in 2020. It considers the characteristics of two areas in an effort to understand both how they became the original major epicentres and how their experiences of the pandemic differed.
The two cases are observed covering the same time span (late February 2020 to late August 2020, i.e., the first semester of the pandemic outside of China). Although they differ regarding geographical features, they are of comparable size in terms of population (around 9 million). The boundaries of the New York case are easy to circumscribe, as it constitutes the New York metropolitan area. In contrast, the Italian case has ‘less-defined boundaries’. As stated, our attention is mainly focused on the region of Lombardy. The experience of the latter can be better examined if placed against the backdrop of what happened in the other main regions of the Italian North (i.e. Piedmont and Veneto).
The areas investigated were among the first affected by the pandemic in Europe and North America, respectively. Furthermore, New York City was selected because it was the scene of the strictest lockdown measures in the United States, similar to those taken in Italy and other European countries (Achenbach and Meckler Reference Achenbach and Meckler2020).
The perspective we follow in the paper is close to that of the ‘case study’ (Yin 2013). We observe two spatially distant contexts and reconstruct the interconnections between the various variables and significant factors. Therefore, we assume in the paper the idea of comparison in a narrative way: a specific type of multi-sited analysis. We do not claim to identify a limited set of causal variables. Comparative analysis as a tool for supporting causal inferences is not, in fact, well suited for the spatial analysis of a complex and largely unexplored phenomenon, since it would be impossible to control all of the dependent variables. We cannot draw inferences by applying a narrative comparison, as causal comparison tries to do (Ragin Reference Ragin2014). Still, we can aim for an exploratory study identifying the salient features of two different major early epicentres of the Covid pandemic.
Outbreak and diffusion: principal factors in comparative perspective
The empirical sections of the paper aim to identify the endogenous processes fuelling the outbreak of the Covid pandemic. Several scholars have addressed the factors enabling Covid to spread in light of its virological features and in relation to specific social factors. We still lack synthetic analyses of different territorial contexts with regard to Covid. With the pandemic still unfolding, and the pathogen becoming endemic around the world through new variants, such analyses will likely be some time in coming.
Such empirical analysis can help deepen our understanding of the socio-economic and institutional factors that make some areas and sections of the population more vulnerable to the illness than others. In other words, we aim to depict two ideal-typical socio-territorial processes of the earliest phase of the spread of Covid. The next sections of the paper will thus present the main characteristics of the two initial epicentres of the Covid pandemic (i.e. Lombardy and metropolitan New York City).
We cannot assume that the early stages of a pandemic – as such – make it possible to predict the long-term diffusion path of the virus. After all, Christakis (Reference Christakis2020) stated that the constellation and weight of variables shaping the spread of a pandemic are virtually impossible to predict. Besides, the data to compare the first wave with the subsequent ones (e.g. mortality and fatality rate, diffusion of the virus among the population) are not conclusive. Therefore, it is not yet possible to build a complete picture of the links between the various phases of the pandemic (Choi et al Reference Choi, Denice, Haan and Zajacova2021; Esteve, Permanyer and Boertien Reference Esteve, Permanyer and Boertien2020). Yet the analysis of the combination of factors characterising some of the first epicentres of the pandemic might help identify specific micro- and meso-institutional and governance reactions useful for mitigating the persistence and recrudescence of the virus. Therefore, we still need to pay greater attention to the early stages of the Covid pandemic.
With this aim, we focus on the relationship between the infection and several socio-economic, territorial, and environmental aspects of the two above-mentioned areas. Accordingly, we needed to collect data concerning circumscribed sub-territorial areas within the two regions – ZIP-code areas and counties in New York and municipalities in Italy, respectively (see Appendix: Variables description) – and to rely upon a dynamic and complex scheme of reasoning. More precisely, we attempt to schematise four dimensions pertaining to i) initiating factors; ii) patterns of territorial diffusion; iii) contributing factors; iv) correlated factors.
We first describe the diffusion of Covid as it unfolded in Lombardy, keeping Piedmont and Veneto in the background of the analysis (see Figure 1). We then seek to do the same for the New York area. Lastly, we compare the main results in order to identify similarities and differences in each case and in the sequences of variables that are related to these results.

Figure 1. Lombardy and the other main regions of Northern Italy
Note: Piedmont is coloured in grey; Lombardy in dark grey, and Veneto in black.
The initially hard-hit areas of the pandemic in Italy
There were two main factors underpinning the outbreak of the Covid pandemic in Italy during winter 2020. First is the so-called ‘tragedy of the early comer’, while the second refers to the concept of spreading events. Italy was the first country in Europe to officially declare the existence of a Covid cluster within its territory. In the second half of February 2020, some cases were detected in the province of Lodi (in the region of LombardyFootnote 3), giving rise to the first acknowledged cluster of infection. A second cluster was identified in the region of Veneto, in the municipality of Vo' Euganeo (Lavezzo et al Reference Lavezzo, Franchin, Ciavarella, Cuomo-Dannenburg, Barzon, Del Vecchio and Rossi2020). Afterwards, Lodi and some other provinces in Lombardy, mainly Bergamo, began to be seriously hit by the virus (Horowitz Reference Horowitz2021).
Although the pandemic had been spreading all over the country beginning in March, the first wave of the pandemic was predominantly a regional (or even sub-regional) phenomenon: a vast concentration was found in specific parts of the three main regions in the north of the country. Lombardy was the most affected. This appears to be clear if one compares the excess deaths in the core areas of the epicentre – central and south-western Lombardy – with the rest of the northern part of the Italian peninsula (see Figure 2; see also Alicandro, Remuzzi and La Vecchia Reference Alicandro, Remuzzi and La Vecchia2020)Footnote 4.

Figure 2. Increase in the number of excess deaths, March 2020 to August 2020 vs. average of five previous years; Istat
The lack of experience in treating early cases and the delay in recognising that the pandemic was a true worldwide threat helped the virus spread with little resistance for a number of weeks. The appearance of the first cases in the winter period, in particular, meant that these were frequently mistaken for the common flu or ordinary pneumonia. For these reasons, it has been argued that delayed hospital admissions, misdiagnoses, failure to segregate infected patients, and transfers from one hospital to another took place in a way that failed to stop the spread (Pluchino et al. Reference Pluchino, Biondo, Giufrida, Inturri, Latora, Le Moli, Rapisarda, Russo and Zappa2021). These are typical facilitators of disease spread and they all occur in or near hospitals, which are likely to be accelerator hotspots in the spread of pandemic illnesses. The case of the Pesenti-Fernaroli hospital in Alzano Lombardo (Bergamo) was striking. On 23 February 2020, the Emergency department was closed for a few hours when a Covid cluster was discovered inside the hospital. The hospital was then reopened without a clear sanitisation procedure. In general, the bewilderment and confusion effect produced by the diagnosis of the first cases of the pandemic facilitated a delay in the initiation of the first restrictive measures (Marzocchi Reference Marzocchi2020). Some government interventions took place on 22 February, but only on 8 March was the region of Lombardy placed in a state of lockdown. Between 22 February and 8 March, ten municipalities in the province of Lodi and one in the province of Padua were declared ‘red zones’, i.e. completely isolated. However, it is likely that some similarly affected areas were not restricted promptly. According to microbiologist Andrea Crisanti's estimates, an instant closure of the Bergamo province could have resulted in a reduction of 2,000 to 4,000 deaths (Ansa 2022; see also Usuelli Reference Usuelli2020).
In addition, a major professional soccer game between Atalanta (of Bergamo) and Valencia (Spain), which took place in an overcrowded stadium (San Siro in Milan) on 19 February 2020, had a huge role in disseminating coronavirus throughout Lombardy generally and in Bergamo in particular. Several epidemiological studies have shown that the game was a super-spreader event that constituted a contagion disaster (Sassano et al. Reference Sassano, McKee, Ricciardi and Boccia2020). Other studies identify the important role of alpine ski resorts during the winter holidays as sites of further Covid spread (Rudan Reference Rudan2020).
Pattern of territorial diffusion
Given the pandemic's diffusion over the first six months, we find that there was a characteristic pattern of territorial dissemination of Covid. The biggest city of Lombardy, Milan, was, it turns out, less hard-hit than the middle-sized cities of Bergamo and Brescia. The territorial diffusion of the first wave of Covid in Italy thus took the shape of a ‘province-to-province’ process, rather than of a ‘spoke and wheel’ pattern, radiating out from a large regional centre to the smaller municipalities. The metropolitan area of Milan would be affected in a way that is comparable to that of other provinces only from April 2020 on.
This pattern of territorial diffusion reflects the features of the local economy of the region (Tosi and Vitale Reference Tosi and Vitale2011). First, Lombardy is the Italian region with the highest share of commuters travelling outside their own municipality (Statista 2021).
The high level of geographical mobility across the regions promoted the circulation of the virus in the early days before the lockdown was established and, in part, even later, since many manufacturing businesses were still authorised to continue their activities even during the most rigorous periods of lockdown. Figure 3 shows a high flow of commuting involving, in particular, the peri-urban area of Milan and the provinces of Lodi, Como, Brescia, and Bergamo, with the last two crossed by a large number of internal and daily territorial transfers (Statista 2021; Lombardi et al. Reference Lombardi, Amoroso, Monaco, Tangaro and Bellotti2021).

Figure 3. Commuting Index 2011; Urban Index
Second, we conjecture that the configuration of the local production systems had a considerable impact on virus spread. The western part of the region of Lombardy is centred chiefly around Milan, with many workers commuting there daily from the provinces of Pavia, Monza, Varese, Como, Lodi, and Lecco. By contrast, the eastern side of the region – where Brescia and Bergamo are located – is characterised by small and medium-sized clusters of enterprises, the famed ‘Third Italy’ (Bagnasco Reference Bagnasco1977, Reference Bagnasco1988) – giving rise to intense daily flows of goods and people that move mainly within those provinces (Lombardi et al. Reference Lombardi, Amoroso, Monaco, Tangaro and Bellotti2021; Savini et al. Reference Savini, Candeloro, Calistri and Conte2020; Baccini et al. Reference Baccini, Grisotto, Catelan, Consonni, Bertazzi and Biggeri2015).
Contributing factors
While looking at several socio-economic aspects of the provinces of Bergamo and Brescia, we can identify factors that had an impact on how the virus circulated and intensified its spread. First, Lombardy is one of Italy's most urbanised regions and one of the areas in Europe with the highest land use in terms of peri-urban human settlements (Sciarrone and Dagnes Reference Sciarrone, Dagnes and Sciarrone2014). These indexes are often correlated with a high level of population density. Although Bergamo and Brescia are less densely populated than larger cities such as Milan and Rome, they are still characterised by a high density relative to their size. Figure 4 shows, in fact, a high-density population axis along the western-eastern axis of Turin-Milan-Bergamo-Brescia.

Figure 4. Population density as ratio between resident population and surface area (kmq), Italy 2011; Istat
Second, we should note the age structure of the population. Italy has the oldest population in Europe and the second oldest in the entire world after Japan. As for Bergamo and Brescia, we note the large percentage of elderly, both female and male, in the population as a whole (see Figure 5). Needless to say, these factors are relevant to our analysis as the mortality and hospitalisation risks associated with Covid are disproportionately high among the elderly (Goldstein and Lee Reference Goldstein and Lee2020). In addition to this finding, the Covid death rate has been found to be strongly associated with the presence of other serious diseases (so-called ‘co-morbidities’ that are better predictors of Covid risks than gender). Diabetes, hypertension, and cardiovascular diseases are very common among the Italian population, due not least to the large number of smokers and former smokers (Boccia et al Reference Boccia, Ricciardi and Ioannidis2020).

Figure 5. Elderly index: Ratio of population aged 65 and over to population aged 0-14 years, Italy 2011; Istat
Lastly, some traits concerning social networks and interactions are relevant to understanding the spread of Covid in Italy. Dense and extended networks are likely to be found in Bergamo and Brescia (Vacca et al. Reference Vacca, Bianchi, Piolatto and Squazzoni2021). These networks connect people of different ages. Within these cross-cutting networks, interactions and exchanges are very frequent and tend to be small group events more than simply dyadic ones (Vacca et al. Reference Vacca, Bianchi, Piolatto and Squazzoni2021). Family members of different generations are used to living near each other and to getting in touch on a daily basis. Until the government introduced the first lockdown in March 2020, this way of life and of interacting remained stable. This pattern of sociability may be good for people's social capital, but the virus took advantage of this ‘thick sociality’ (see also Durante, Guiso and Gulino Reference Durante, Guiso and Gulino2020; Gopnik Reference Gopnik2020; Kuchler, Russel and Stroebel Reference Kuchler, Russel and Stroebel2021).
Correlated factors
We move on now to analyse some socio-economic and contextual factors that may be related to the rapid and concentrated diffusion of the virus among specific segments of the population. According to an extensive literature on the social basis of pandemics, it is useful to see how social inequalities relate to patterns of infection, hospitalisation, and death (Gauthier et al. Reference Gauthier, Smith, García, Garcia and Thomas2021). There is no linear relationship between social inequalities and the spread of a virus through the population. Figure 6 shows that the urban areas of Turin and Milan are still more unequal in economic terms than the medium-size city areas of Bergamo and Brescia. Furthermore, the three regions are by far more robust from an economic point of view than areas of Southern Italy that were less hard-hit by the virus. Still, however, it is possible to identify a number of connections between pandemics and social inequalities. First, contexts not providing citizens with universal health care systems are likely to have poor and disadvantaged people struggling to access high-quality treatments and prevention measures. Moreover, the spatial concentration of lower-class people in some peri-urban regions and living in conditions of housing deprivation might be expected to accelerate the spread of the virus. In contexts where people can rely upon a well-functioning health care system, the relationship between the diffusion of viruses and social inequalities is less clear. Although income levels don't play a huge role in determining access to medical treatments in these Italian contexts, a high level of social inequalities can give rise to a large population living in overcrowded apartments and working in economic sectors that are likely to be part of the ‘touch economy’ (Baqaee and Fahri Reference Baqaee and Fahri2020). Given these assumptions, we can show some proxies of social inequalities in the area of Northern Italy relative to other areas of the country.

Figure 6. Gini index, Italy 2011; Istat
Apart from the insights concerning social inequalities, we can claim that the main provinces of Lombardy are wealthy places (Busso and Storti Reference Busso and Storti2013). In recent years, however, they have also experienced persistent economic problems (e.g. low innovation and economic growth rate, high youth unemployment). However, they can still rely upon broad middle- and upper-middle classes with substantial household wealth. The society of those territorial areas is not very uneven. The empirical data confirm, in fact, that social factors (e.g. poverty, high housing densities) are not relevant for identifying groups that are especially vulnerable to Covid there. The vulnerability factors relate only to pathological characteristics of the virus (i.e. Covid is significantly more dangerous for older people and men in each age cohort).
Another relevant factor concerning the environmental context should be noted (Bontempi Reference Bontempi2020; Wu et al Reference Wu, Nethery, Sabath, Braun and Dominici2020). According to Coker et al. (Reference Coker, Cavalli, Fabrizi, Guastella, L\\ippo, Parisi, Pontarollo, Rizzati, Varacca and Vergalli2020, 611), ‘Long-term exposure to ambient air pollutant concentrations is known to cause chronic lung inflammation, a condition that may promote increased severity of Covid-19.’ Exploring this possible connection, the authors demonstrate that there is a positive ‘association between long-term concentrations of area-level fine particulate matter (pm2.5) and excess deaths in the first quarter of 2020 in municipalities of Northern Italy.’
A last aspect that we need to consider concerns the Italian healthcare system, which provides universal coverage through a strong decentralised organisation with regional governance (Mapelli Reference Mapelli2012). Despite the gaps that exist between regions, the system is rated very good quality on average (OECD 2019, 2020), with peaks of excellence such as Lombardy, whose healthcare system scored 9.9/10 in a recent OECD assessment and is in the top 5 per cent in health compared across all OECD regions worldwide.Footnote 5
The healthcare model of Lombardy emerged at the end of the 1990s and is characterised by a strong corporatisation and the presence of quasi-markets, where patients freely choose which organisations, public or private, to rely on to access health services. The competition between providers is regulated by the public health authorities, which define standards for the services, authorise private health centres through accreditation, and remunerate them according to a predefined treatment-based fee structure. This specific remuneration system encourages the provision of public and private care, even of a very complex level, based on hospitalisation. At the same time, it discourages investment in less profitable services such as preventive health services, generates fragmentation in the care pathways, and hinders overall patient care (Bifulco Reference Bifulco, Carabelli and Facchini2010; Neri Reference Neri and Pavolini2011). These characteristics seem to have played a decisive role in the low efficacy of containment and prevention during the Covid pandemic crisis (Casula, Terlizzi and Toth Reference Casula, Terlizzi and Toth2020).
Similarly, the corporatisation of the health system has promoted organisational rationalisation of hospitals based on the pursuit of efficiency and waste-cutting. On the one hand, to achieve economies of scale, health services have been concentrated in large hospital hubs located in urban areas; on the other hand, there was a decrease in hospital beds, staff, and health equipment, driven by the idea of eliminating redundant and, therefore, unproductive resources. With the advent of the Covid pandemic, these policies have shown various dysfunctions. The extra-urban areas were found to be devoid of territorial health facilities, while the very large hospitals proved to be the main places of contagion. The scarcity of resources – such as that of hospital beds, in Italy equal to 3.1 per thousand inhabitants, while there are 6 in France and 8 in Germany – has made it difficult to provide adequate care to all seriously ill patients, affecting the high mortality found in the Italian case (Neri Reference Neri, Vicarelli and Giarelli2021). In the early stages of the pandemic, the spread of the virus in some limited areas – due to the factors mentioned above – led in a short time to excessive pressure on some local hospitals, to a high rate of contagion among healthcare workers and, as a result, to the crash of the local health system (Boccia, Ricciardi, and Ioannidis Reference Boccia, Ricciardi and Ioannidis2020).
The decentralised structure of the healthcare system may also have contributed to this collapse: in fact, it might have led to weak coordination between different areas and a huge reduction of resources to support the territorial network of the healthcare system (see Toth Reference Toth2021). With regard to the government and the institutional reactions, several reports have testified that the governance of the crisis in Lombardy has been rather ineffective compared to that of other areas that had also been badly hit (e.g., Veneto, Tuscany, and Emilia Romagna). It has been argued, for instance, that in Lombardy many Covid tests were conducted in the first weeks of the pandemic, but mainly on symptomatic cases, with the aim of assessing the presence of the virus. Less testing was done on asymptomatic cases, which could have helped to break the virus chain. This was the approach taken, for example, in Vò Euganeo, a small municipality in the Veneto region, where all residents were tested when the infection broke out during the third week of February 2020 (and 3 per cent were found to be infected) (Boccia, Ricciardi and Ioannidis Reference Boccia, Ricciardi and Ioannidis2020; Binkin et al Reference Binkin, Michieletto, Salmaso and Russo2020; Gregori et al Reference Gregori, Azzolina, Prosepe, Destro, Lorenzoni and Berchialla2020).
New York City
New York City was, in the early stages of the coronavirus crisis, the epicentre of the pandemic in the United States, roughly parallelling the position of several areas of Lombardy in terms of the scale and scope of the disaster. As we will see below, some of the neighbourhoods of Central Queens were the ‘epicentre of the epicentre’.
Our data come from two sources: the New York City Department of Health (NYC DOH), which provides ZIP code-level data on confirmed and probable Covid deaths, as well as from the 2018 American Community Survey (ACS), which provides general population data including race, age, median income, etc.Footnote 6 As stated in the first section, the Covid data from the NYC DOH cover the first six months of the pandemic, from New York's first confirmed case of Covid on 29 February 2020, to 29 August 29 2020. Our data set uses ZIP code areas as the unit of observation (N=177), which allows us to observe relationships between the number of confirmed and presumed Covid deaths per 100,000 people (see Figure 7) and other population attributes in the same ZIP code.

Figure 7. Covid deaths per 100,000 by ZIP code as of 29 August 2020, New York City; NYC DOH data
The borough with the highest rate of confirmed Covid cases in this period was the Bronx (3.52% total infection rate), followed by Staten Island (3.13%), Queens (2.95%), Brooklyn (2.35%), and Manhattan (1.76%) (see Table 1; see also Schwirtz and Cook Reference Schwirtz and Cook2020).
Table 1. Approximate percentage of the population infected with Covid between 29 February 2020 and 29 August 2020, New York City; calculated with the number of Covid infections from the NYC DOH and the population; data from the 2018 ACS

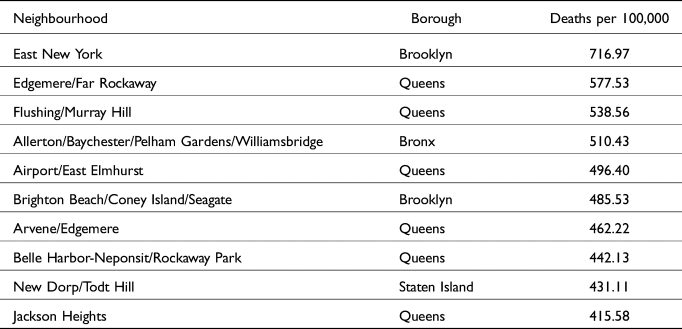
Although Queens only had the third highest rate of infection over this period, it contains six of the ten ZIP codes with the highest death rates (see Table 2).
Table 2. Top ten ZIP codes with the highest Covid death rates (confirmed and probable), New York City; NYC DOH data
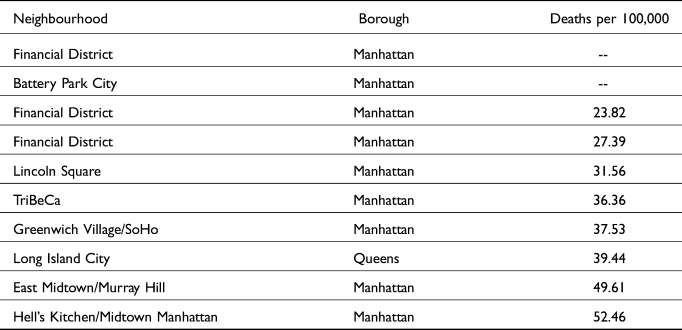
Two of the ZIP codes with the highest death rates are in Brooklyn, including the highest, and the Bronx and Staten Island each have one among the highest mortality rates. While Manhattan had no ZIP codes among the top ten death rates, nine of the ten ZIP codes with the lowest death rates are in Manhattan, with the remaining one, Long Island City, just across the East River from Manhattan in Queens (see Table 3).
Table 3. Top ten ZIP codes with the lowest Covid death rates (confirmed and probable), New York City; NYC DOH data
We tested the correlations between Covid death rate per 100,000 of population and a number of population variables by ZIP code (see Table 4), and found the strongest correlation to be a negative relationship between death rate and median income in a ZIP code (see Figure 8).

Figure 8. Median income by ZIP code, New York City; ACS
Table 4. Correlations between variables and death rate per 100,000 by ZIP code, New York City, from strongest to weakest correlation, ACS

This suggests that more affluent New York City ZIP codes saw fewer Covid deaths per 100,000 residents during the first six months of the pandemic. In addition to possibly having greater access to resources such as grocery delivery that would help minimise exposure to the coronavirus, as well as greater access to healthcare in general, it is also possible that residents of these ZIP codes had greater mobility due to their financial resources. Affluent residents’ decision to leave New York City and stay elsewhere as Covid continued to spread likely lowered their risk of exposure, resulting in a lower overall mortality rate in those neighbourhoods.
The next strongest correlation was a negative relationship between death rate and white percentage of population in a ZIP code (see Figure 9), followed by a negative relationship between death rate and percentage of population aged 18–34 years in a ZIP code (see Figure 10).

Figure 9. Percentage of population white by ZIP code, New York City; ACS
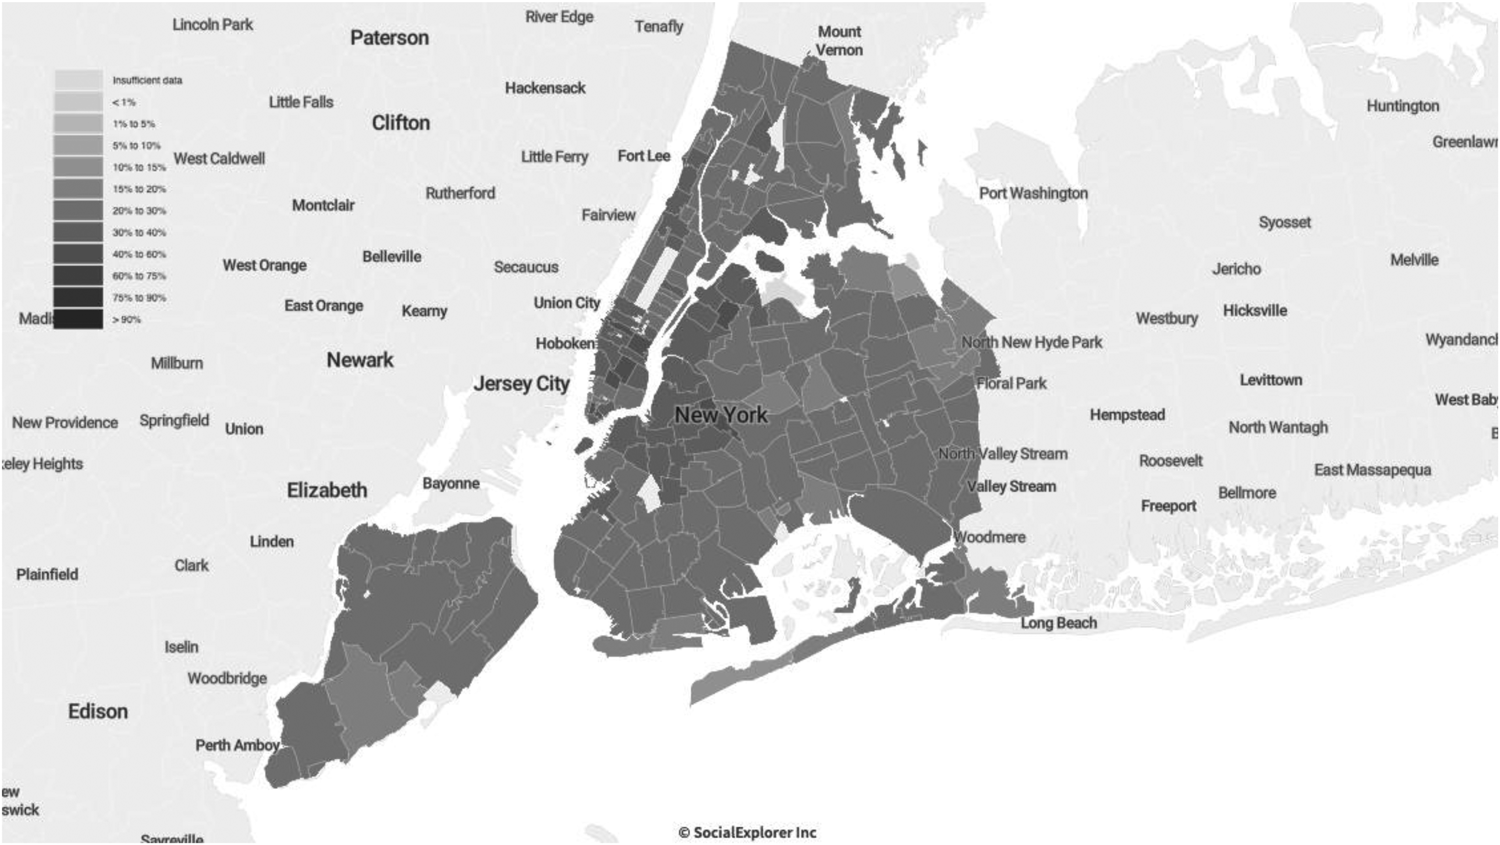
Figure 10. Percentage of population aged 18-34 by ZIP code, New York City; ACS
The strongest positive relationship was the correlation between death rate and Black percentage of population in a ZIP code (see Figure 11), closely followed by death rate and percentage of population under 18 years, and death rate and percentage of population under 18 below the poverty line. A map of New York City residents aged under 18 years (see Figure 16) shows an overlap between higher youth populations and lower median income; this might explain the positive correlation between the Covid death rate and minor residents, especially given that young people are much less likely to have severe cases of Covid and older populations have comprised the majority of Covid deaths.

Figure 11. Percentage of population Black by ZIP code, New York City; ACS
The weakest relationship we tested was the correlation between death rate and unemployment, which was negative, followed by similarly weak relationships between death rate and Gini coefficient and population aged 35–64, both of which were also negative. These were followed by a moderately weak negative correlation between death rate and population density, then by a moderately weak positive correlation between death rate and percentage of population aged 65+ years, and a moderate positive relationship between death rate and percentage of population aged 65+ years living in poverty.
Notably, the ZIP code with the highest death rate over the first six months of the pandemic (East New York) also has the highest percentage of population aged 65+ in the city, the second-highest number of cases, the fifth-highest percentage of population aged 65+ living in poverty, the seventh-lowest median income, and the 23rd-highest percentage of Black residents (see Table 5).
Table 5. Snapshot of East New York, the ZIP code area with the highest Covid death rate per 100,000 people from 29 February 2020 to 29 August 2020, New York City; ASC

The two ZIP codes with the lowest death rates over the first six months of the pandemic (Battery Park City, and Financial District) are both in the top ten median incomes (Financial District at number three and Battery Park City at number five) in New York City. The Financial District additionally has the lowest percentage of population aged 65+ and 65+ living in poverty of any ZIP code, and the seventh-lowest percentage of Black residents (see Table 6).
Table 6. Snapshot of Financial District and Battery Park City, the ZIP code areas with the lowest Covid death rate per 100,000 people from 29 February 2020 to 29 August 2020, New York City; ASC

How should we interpret these data? Some of them seem rather straightforward and in keeping with our hypotheses regarding what we would find – especially that the hardest-hit populations would be those of low income, who in New York and in the United States are disproportionately Black and Latino (Mays and Newman 2020; Renelus et al Reference Renelus, Khoury, Chandrasekaran, Bekele, Briggs, Ivanov, Mohanty and Jamorabo2020; Serkez Reference Serkez2020; Torpey Reference Torpey2020). That was certainly true, for example, of the finding that there was a strong negative correlation between median income in a ZIP code and rates of death from Covid, as well as the finding that there was a positive correlation between percent Black of the population in a given ZIP code and the rate of Covid deaths. These findings also reflect the reasonable expectation that the wealthier the population in question, the less likely they would be to die from Covid disease, as well as that the proportion of the population that is Black is likely to be related to the rate of deaths from Covid.
Yet there were a number of findings that seemed counterintuitive at best. The finding that death rates in ZIP codes where the percentage of population under 18 and under 18 below the poverty line correlated with rates of Covid deaths was puzzling. We expected those rates to be negatively correlated, given that deaths among younger people are relatively few. Additionally, the shutdown of New York City schools which began on 16 March 2020 and remained in effect for the rest of the term, presumably limited children's contact with people outside of the home (Shapiro Reference Shapiro2020). We suspect that this anomalous outcome is explained by the possibility that the ZIP codes with the highest populations under 18 are (among) the poorest in New York City.
The weak negative correlation between death rate and unemployment, we believe, may have been a product of the fact that those not working were less likely to be exposed to the risk of contagion. It should be noted, however, that our data are from the 2018 ACS five-year estimate, and not a real-time estimate. The moderately weak negative correlation between death rate and population density (see Figure 12) may well be a product of the departure from the city of the well-to-do for less dense environs. This population movement, so characteristic of epidemics historically (Boccaccio's Decameron reports on such movements) is reflected in two maps constructed by The New York Times – the first on the basis of data concerning mail-forwarding notices received by the US Post Office in early 2020 (see Figure 13) and the second based on smartphone location data recorded in February 2020 versus May 2020 (see Figure 14). The two maps basically show the same thing – namely, that several of Manhattan's richer neighbourhoods, which also happen to be more densely populated, saw more residents leaving the city during the pandemic than other neighbourhoods.Footnote 7 The departure of the wealthy from the city during the early months of the pandemic and with the approach of summer was one of the more striking responses to the pandemic, as it highlighted once again the disparate resources available to and constraints imposed upon different populations in the city.

Figure 12. Population density by ZIP code, New York City; 2018 ACS
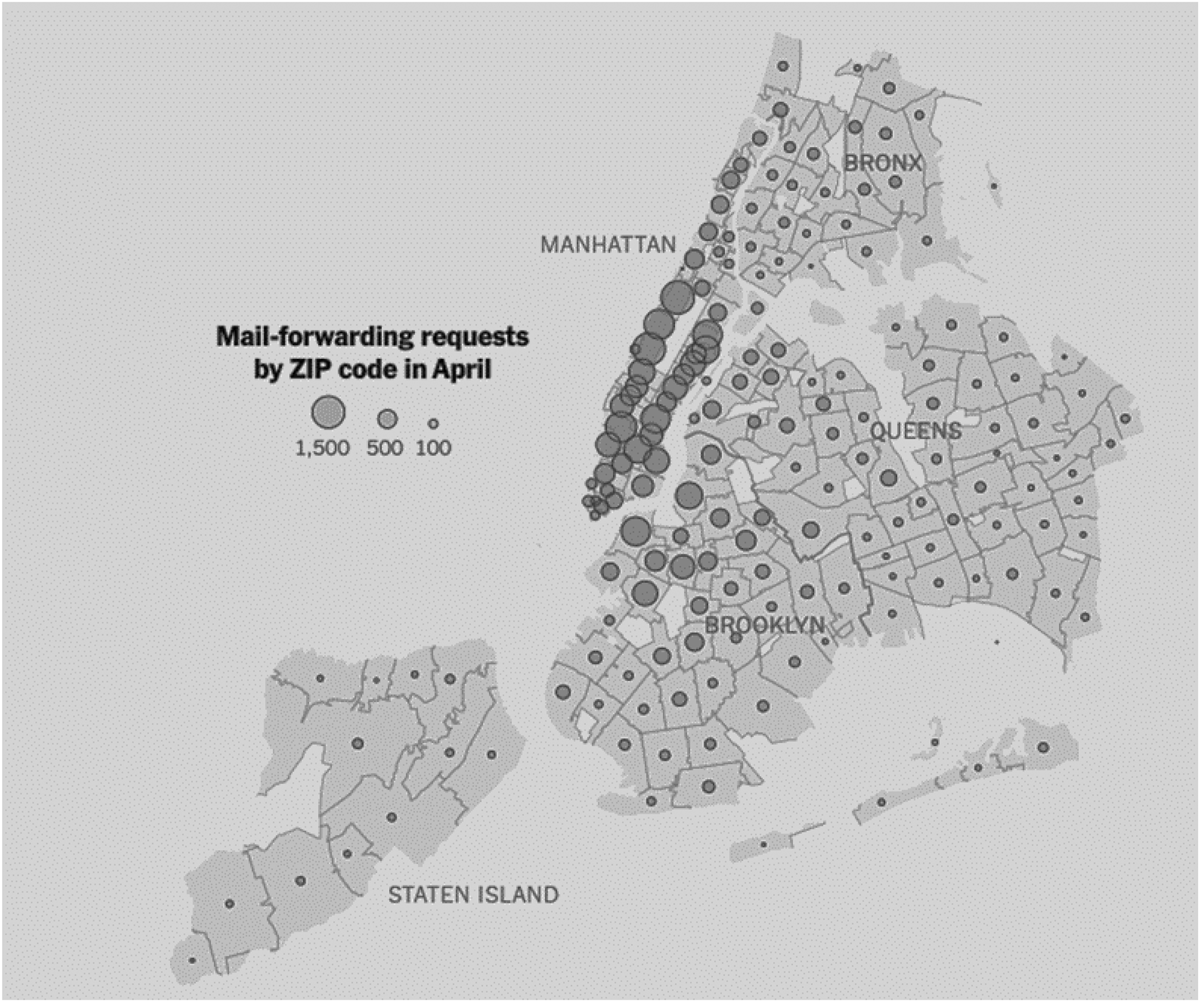
Figure 13. Map of mail forwarding requests by ZIP code, New York City (Authors’ own adaptation from Paybarah, Bloch and Reinhard Reference Paybarah, Bloch and Reinhard2020)

Figure 14. Percentage of residents not present in their homes according to smartphone data on 1 May 2020 by ZIP code, New York City (Authors’ own adaptation from Quealy Reference Quealy2020)
We also found a moderate positive correlation between death rate and percentage of population aged 65+ years, and a slightly stronger positive relationship between death rate and percentage of population aged 65+ years living in poverty. We expected stronger correlations, but they were positive, as expected.
There is some additional overlap between the population density by ZIP code (see Figure 12), pandemic migration (see Figure 13 and Figure 14; Paybarah, Bloch and Reinhard Reference Paybarah, Bloch and Reinhard2020; Quealy Reference Quealy2020), and the percentage of the population aged 65+ by ZIP code in New York City (see Figure 15). Although the data cannot confirm whether the movement out of Manhattan's Upper East Side and Upper West Side neighbourhoods in particular accounts for the whereabouts of senior citizen residents, if we assume that movement out of densely populated areas weakened the relationship between population density and Covid death rates overall, it may have had the same effect on the relationship between the population aged 65+ and Covid death rates.
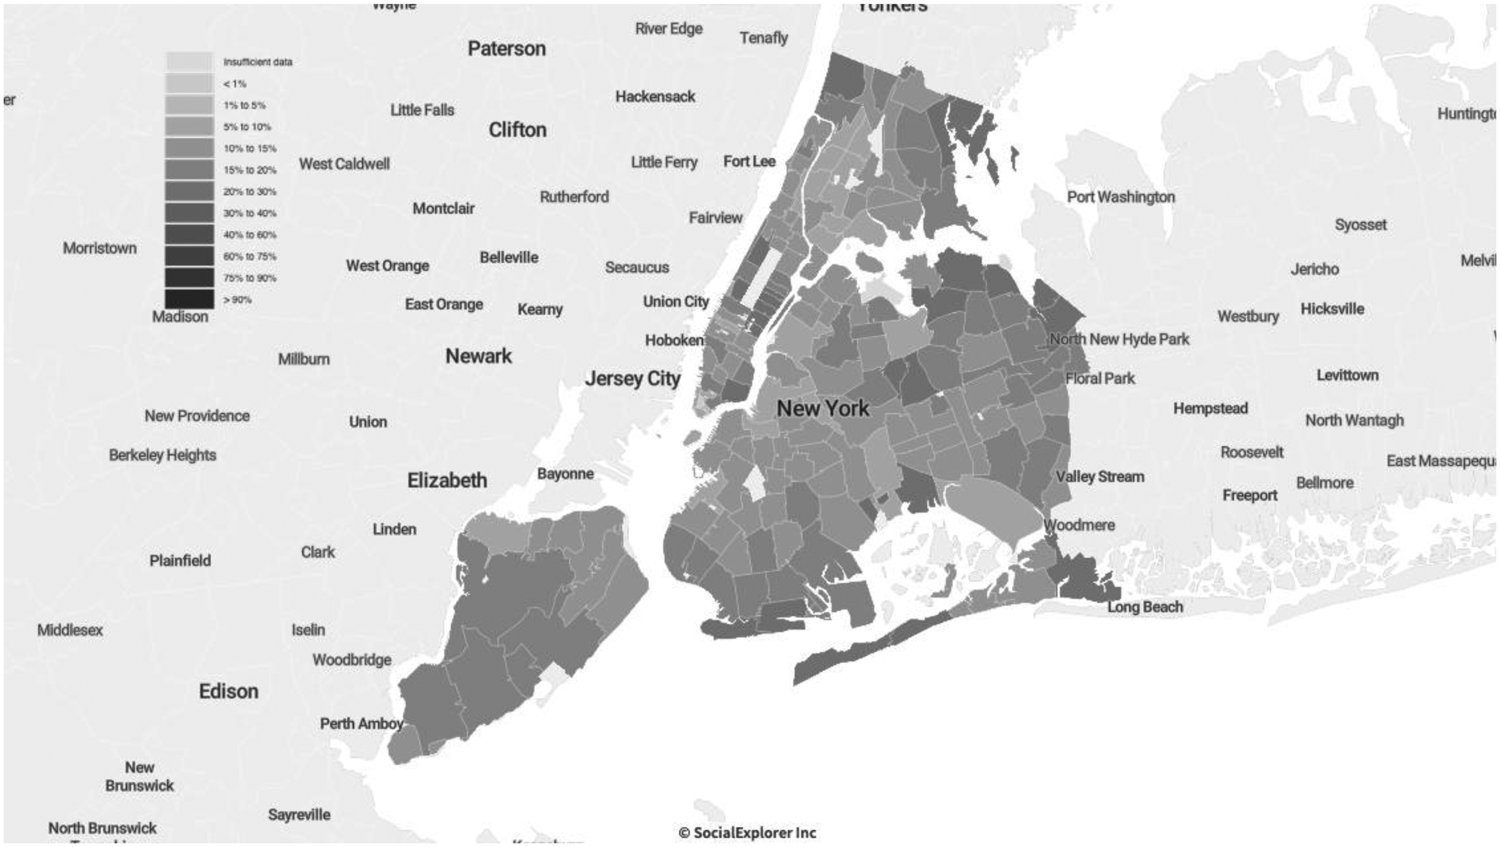
Figure 15. Percentage of population aged 65+ by ZIP code, New York City, ACS

Figure 16. Percent of population 18> by ZIP code, New York City; 2018 ACS
We noted previously that the ZIP code with the highest death rate over the first six months of the pandemic (East New York) also has the highest percentage of population aged 65 and over in the city, the second-highest number of cases, the fifth-highest percentage of population aged 65+ living in poverty, the seventh-lowest median income, and the 23rd-highest percentage of Black residents (see Table 5). These findings suggest that a variety of factors combines to correlate with high Covid death rates. More precisely, greater levels of poverty, a higher proportion of Black population, and a more aged population, tend to mean higher rates of Covid deaths, whereas wealth, youth, and a larger non-Black population tend to mean fewer deaths from Covid. This is, indeed, what characterises the picture we describe about East New York; on the flip-side the Battery Park City, and the Financial District are the two ZIP codes with the lowest death rates over the first six months of the pandemic.
Discussion and conclusion
This paper tells a tale of two coronavirus epicentres. In Italy, a country providing universal health coverage, the illness spread rapidly in early 2020 among a network of smaller and medium-sized cities mainly in Lombardy, a wealthy northern region with a healthcare system that was regarded as among the best in Europe and the world. This is the outcome of co-occurring variables that can be distinguished analytically between contributing and correlated ones. One can argue, indeed, that the excellence of the Lombardy health system showed several cracks when confronted with a pandemic. As stated, the region can rely upon several excellent large hospitals that are internationally renowned for both clinical and research activities. Still, this has not been complemented by strengthening the territorial medical services. Many small hospitals have closed, and resources such as hospital beds, healthcare equipment, and personnel have been reduced. An emblematic case is that of general practitioners, who remain the primary source of medical care in the territory, and are often overloaded with patients.
Furthermore, the areas of Northern Italy that we investigated have suffered from a condition that we could define as the tragedy of the firstcomers. Beyond political considerations, the fact of having been the first area massively affected by the pandemic – based on idiosyncratic factors, that is, factors that could have materialised in other areas of Italy and Europe – made the difference. The first diagnoses of the pandemic cases occurred late. The first closure measures were also late, and inconsistent at the territorial level. Given the poor data and the unprecedented situation, it was not easy for either the government of the country or that of the region to promulgate severe measures immediately. Other areas of Italy and Europe benefitted from the experience of what happened previously in several provinces of Lombardy. Moreover, the initial pattern of diffusion of the pandemic was likely related to the fact that the economy of the region relied heavily on movements among the municipalities in the area, which continued despite the imposition of lockdowns on the Italian population. The situation was further complicated by super-spreader events such as the football (soccer) game played by Bergamo's Atalanta team against Valencia, where an outbreak also ensued following the match. In addition, early on, vacationers were not discouraged from taking their annual skiing holidays in the Alps; those who did so were often thought to have become super-spreaders as well. The causes of the rapid spread of Covid in Northern Italy thus seem to have been chiefly a function of patterns of living (we called it ‘thick sociality’); some specific features of the health system; the governance strategies; and an overrepresentation of the elderly population. All of these factors have been enormously amplified by the firstcomers effect. Territorial distribution of social inequalities was less relevant, although these surely played some role as well.Footnote 8
In contrast, the explosion of Covid infections and deaths in New York City in early 2020 appears to have been much more strongly tied to pre-existing social inequalities, holes in access to health care among vulnerable parts of the population, and the exposure of ‘frontline’ workers to risks of illness, while wealthier populations were able to dodge the virus by either having desired items delivered or by departing the city altogether for less dangerous locales. Social inequality always plays a significant role in pandemics; the poor typically do worse (Credit Reference Credit2020, Leonhardt and Serkez Reference Leonhardt and Serkez2020). Yet the United States is peculiarly vulnerable to these public health crises because of the population's lesser access to comprehensive health care provision. Low wages also mean greater compulsion to work even under dangerous conditions. Poorer ‘frontline’ workers, disproportionately Black and brown, were forced by circumstances to work despite the risks involved.
In sum, the coronavirus pandemic in New York was as much a crisis of social inequality as it was a public health crisis (see also Jay et al Reference Jay, Bor, Nsoesie, Lipson, Jones, Galea and Raifman2020). This was less true in Italy, where the medical care system and the systems of health insurance discriminated less against the poor and vulnerable. To be sure, compulsion drove those who had to expose themselves to risk in order to earn a living wherever they were, but at least in theory those in Italy had access to good-quality health care when necessary. Alas, it was not enough to keep Northern Italy from becoming an early epicentre of the coronavirus pandemic, the twin of its counterpart halfway around the world in New York City.
The two cases also suggest some broad considerations. In cases of pandemics, access to treatment is not only a matter of protecting individuals but also of reducing negative externalities (Hsiang et al Reference Hsiang, Allen, Annan-Phan, Bell, Bolliger, Chong and Druckenmiller2020). Therefore, the question arises as to how healthcare systems, including those based on insurance systems, can guarantee universal and prompt access to care in such moments of crisis. Furthermore, shocking events such as pandemics require integrated governance models between different institutional levels (e.g., local, central, and super-national). Responding to a pandemic requires good crisis management practices, adequate policy measures (National Academies of Sciences, Engineering, and Medicine 2020), and a renewed political capacity to address complex challenges.
Appendix: Variables description
Lombardy and Northern Italy
Death rate (Istat data 2020) (Percentage change in deaths during the six months compared to the average for the same six months of the previous five years from https://www.istat.it/
Commuting index (Urban Index Indicatori per le Politiche Urbane 2011 data) Commuting for work only. Ratio of the sum of flows into and out of the municipality for work purposes to the municipality's employed population from https://www.urbanindex.it/
Population density (Istat Census data 2011) Ratio between resident population of the area and surface area of the area (kmq) https://www.istat.it/
Age (Istat Census data 2011) Old-age index; percentage of the population aged 65 and over on the 0-14 age group https://www.istat.it/
Gini Index of Income Inequality (Istat data 2012), based on the total disposable household income https://www.istat.it/
New York City
Age (American Community Survey (ACS) 2014–2018 (Five-Year Estimates)). In SocialExplorer.com. Retrieved 15 March 2021 from https://www.socialexplorer.com/data/ACS2018_5yr/metadata?ds=SE&table=A01001.
Age (Short Version) (American Community Survey (ACS) 2014–2018 (Five-Year Estimates)). In SocialExplorer.com. Retrieved 15 March 2021 from https://www.socialexplorer.com/data/ACS2018_5yr/metadata?ds=SE&table=B01001.
Death Rate by Zip Code. In New York City Health COVID-19: Data. Retrieved 28 August 2020 from https://www1.nyc.gov/site/doh/covid/covid-19-data.page#maps.
Gini Index of Income Inequality (American Community Survey (ACS) 2014–2018 (Five-Year Estimates). In SocialExplorer.com. Retrieved 15 March 2021 from https://www.socialexplorer.com/data/ACS2018_5yr/metadata?ds=SE&table=A14028.
Health Insurance (American Community Survey (ACS) 2014–2018 (Five-Year Estimates)). In SocialExplorer.com. Retrieved 15 March 2021 from https://www.socialexplorer.com/data/ACS2018_5yr/metadata?ds=SE&table=A20001
Hispanic or Latino by Race (American Community Survey (ACS) 2014–2018 (Five-Year Estimates). In SocialExplorer.com. Retrieved 15 March 2021 from https://www.socialexplorer.com/data/ACS2018_5yr/metadata?ds=SE&table=A04001.
Median Household Income (In 2018 Inflation Adjusted Dollars) (American Community Survey (ACS) 2014–2018 (Five-Year Estimates)). In SocialExplorer.com. Retrieved 15 March 2021 from https://www.socialexplorer.com/data/ACS2018_5yr/metadata?ds=SE&table=A14006.
Nativity by Citizenship Status (American Community Survey (ACS) 2014–2018 (Five-Year Estimates). In SocialExplorer.com. Retrieved 15 March 2021 from https://www.socialexplorer.com/data/ACS2018_5yr/metadata?ds=SE&table=A06001.
Place of Birth for the Foreign-Born Population (American Community Survey (ACS) 2014–2018 (Five-Year Estimates). In SocialExplorer.com. Retrieved 15 March 2021 from https://www.socialexplorer.com/data/ACS2018_5yr/metadata?ds=SE&table=A07001.
Population Density (Per Sq. Mile) (American Community Survey (ACS) 2014–2018 (Five-Year Estimates). In SocialExplorer.com. Retrieved 15 March 2021 from https://www.socialexplorer.com/data/ACS2018_5yr/metadata?ds=SE&table=A00002.
Poverty Status in 2018 for Children Under 18 (American Community Survey (ACS) 2014–2018 (Five-Year Estimates). In SocialExplorer.com. Retrieved 15 March 2021 from https://www.socialexplorer.com/data/ACS2018_5yr/metadata?ds=SE&table=A13003A.
Poverty Status in 2018 for Population Age 18 to 64 (American Community Survey (ACS) 2014–2018 (Five-Year Estimates). In SocialExplorer.com. Retrieved 15 March 2021 from https://www.socialexplorer.com/data/ACS2018_5yr/metadata?ds=SE&table=A13003B.
Poverty Status in 2018 for Population Age 65 and Over (American Community Survey (ACS) 2014–2018 (Five-Year Estimates)). In SocialExplorer.com. Retrieved 15 March 2021 from https://www.socialexplorer.com/data/ACS2018_5yr/metadata?ds=SE&table=A13003C.
Race (American Community Survey (ACS) 2014–2018 (Five-Year Estimates)). In SocialExplorer.com. Retrieved 15 March 2021 from https://www.socialexplorer.com/data/ACS2018_5yr/metadata?ds=SE&table=A0300.
Ratio of Income in 2018 to Poverty Level (Summarised – top-coded at 2.00) (American Community Survey (ACS) 2014–2018 (Five-Year Estimates)). In SocialExplorer.com. Retrieved 15 March 2021 from https://www.socialexplorer.com/data/ACS2018_5yr/metadata?ds=SE&table=B1300.
Total Population (American Community Survey (ACS) 2014–2018 (Five-Year Estimates)). In SocialExplorer.com. Retrieved 15 March 2021 from https://www.socialexplorer.com/data/ACS2018_5yr/metadata?ds=SE&table=A0000.
Competing interests
The authors have declared none.
Notes on contributors
Luca Storti is an Associate Professor of Economic Sociology at the University of Turin (Italy) and Research Fellow of the Ralph Bunche Institute at the City University of New York, Graduate Center. Among his recent publications are: Survive or Perish: ‘Traditional’ Organised Crime in the Port of Montreal and the Port of New York/New Jersey, in International Journal of Law, Crime and Justice (2020, with A. Sergi); The Super-rich: Origin, Reproduction and Social Acceptance in Sociologica. International Journal for Sociological Debate (2021, with J. Dagnes).
John Torpey is Presidential Professor of Sociology and History and Director of the Ralph Bunche Institute for International Studies at the City University of New York, Graduate Center. He is author of a number of books, including The Invention of the Passport: Citizenship, Surveillance, and the State (2nd ed., Cambridge University Press, 2018 [2000]) and Making Whole What Has Been Smashed: On Reparations Politics (Harvard University Press, 2005; re-issued by Rutgers University Press, 2017).
Joselle Dagnes is tenure-track Assistant Professor of Economic Sociology at the University of Turin (Italy), where she teaches Sociology of Markets. Her main research interests include financialisation processes and financial markets, formal and informal regulation processes, mafia processes of territorial expansion at both national and international level, and the foundational economy.
Marianna Filandri is an Associate Professor in Economic Sociology at the University of Turin (Italy). Her main research interests concern social inequalities, in particular in the housing and labour market and among young people. More recently she has been studying gender inequalities in academia, combining secondary analyses on administrative data and lab experiments.
Justine Lyons is a PhD student in Sociology and the Women's Studies Certificate Program at the City University of New York, Graduate Center. Her interests include political sociology, political violence, and gender-based violence against women. She also holds an MA in International Human Rights from the Josef Korbel School of International Studies, University of Denver.


