


I. INTRODUCTION
The PEROVSKITE family of materials exhibit a large variety of applications including photovoltaics, sensors, thermoelectrics, batteries, fuel cells, catalysis, lasers, magnets, superconductors, LEDs, and memory devices (RAM). The general chemical formula for perovskite compounds is ABX3, where “A” and “B” are two cations, often of very different sizes, and X is an anion (frequently oxygen) that bonds to both cations. The A atoms are generally larger than the B atoms. The ideal cubic structure has the B cation in 6-fold coordination, surrounded by an octahedron of anions, and the A cation in regular 12-fold coordination. The formula ABX3 can be expanded to double perovskites and complex perovskites. With the possibility of doping, there are even larger possible combinations of formulae leading to a wealth of rich chemistry and research opportunities.
In recent years, extensive efforts have been conducted on double perovskites in the hope of searching for new technological applications. The double perovskites with a general formula of A 2BB′O6 (where A = alkaline-earth elements, B and B′ = Co, Fe, Mn, Ni, Cu, W, Mo, etc.) are known to exhibit a variety of exotic properties including colossal magnetoresistance, high-temperature superconductivity, and half-metallicity (Blasse, Reference Blasse1965; Galasso, Reference Galasso1969; Viola et al., Reference Viola, Martínez-Lope, Alonso, Martínez, De Paoli, Pagola, Pedregosa, Fernández-Díaz and Carbonio2003; Zhao et al., Reference Zhao, Yue, Gui and Li2005; Manoun et al., Reference Manoun, Ezzahi, Benmokhtar, Bihc, Tamraoui, Haloui, Mirinioui, Addakiri, Igartua and Lazor2013). A number of these materials are semiconductors with bandgaps feasible for photovoltaic applications. Some also show relatively high power factors P (P = S 2⋅σ, where S is the Seebeck coefficient and σ is electrical conductivity (Tritt, Reference Tritt1996)), therefore they are also potential candidates as thermoelectric materials for energy conversion applications.
In this paper, we are interested in studying the structure and bandgap information of the double perovskite solid solutions (CaxSr2−x)MnWO6. The structural studies were performed using powder X-ray diffraction with the Rietveld refinement technique. The bandgaps of these materials were performed by measuring the UV–visible absorption spectra. As reference powder diffraction patterns are critical for phase analysis, we also prepare the reference patterns for (CaxSr2−x)MnWO6, with x = 0.25, 0.5, 0.75, 1.5, 1.75. The reference patterns for the x = 0.0 and 2.0 compounds already exist in the Powder Diffraction File (PDF) (Gates-Rector and Blanton, Reference Gates-Rector and Blanton2019) (Sr2MnWO6 (PDF 01-078-4158) and Ca2MnWO6 (PDF 04-013-0977)).
II. EXPERIMENTAL
A. Sample preparation
(CaxSr2−x)MnWO6 (x = 0, 0.25, 0.5, 0.75, 1.00, 1.25, 1.5, 1.75, 2.0) samples were prepared by heating a stoichiometric mixture of SrCO3, CaCO3, MnO2, and WO3 in air first and then in flowing forming gas (5% H2, 95% N2). Samples were weighed out, well-mixed and heat-treated at 750, 875, and 950 °C in air, each for 2 days with intermediate grindings and pelletizings. These samples were subsequently heat-treated at 1000 °C in flowing forming gas for 20 h. The samples were furnace cooled. The phase purity of the beige-colored samples was established by powder X-ray diffraction. The heat-treatment process was repeated until no further changes were detected in the powder X-ray diffraction patterns. A selected subset of these samples (x = 0.25, 0.5, 0.75, 1.5, 1.75) were used for structural studies and for preparing reference patterns.
B. Estimation of the composition using X-ray fluorescence
The estimation of the compositions for three samples of varying atomic ratios SraCabMncWdO6 were performed on a Bruker M4 Tornado micro X-ray fluorescence instrument. An Rh X-ray source, set to 50 kV and 100 μA, with a 20 μm mono-capillary was used for excitation (S.N. 2001495). A Bruker XFlash 450 μm thick, Silicon Drift Detector (S.N. 11881_0239) (The purpose of identifying the equipment in this article is to specify the experimental procedure. Such identification does not imply recommendation or endorsement by the National Institute of Standards and Technology.) was used for data collection for the scans. Each spectrum used a mean peak sum of over 10 000 X-ray counts per analyzed element, reducing counting statistics as a source of uncertainty below all other contributions. Analysis was performed using Bruker Quantify version 1.6.0.286 with the standard Spectrum Elements method and calibrated for our instrument (S.N. 6099). For statistical sampling, 20+ independent, 60 second live time measurements were performed, and the variance of the composition derived from these measurements were used for error analysis.
C. X-ray Rietveld refinements and powder reference patterns
Among the samples prepared, the (CaxSr2−x)MnWO6 (x = 0.25, 0.5, 0.75, 1.5, 1.75) members were packed into 0.3 mm diameter glass capillaries for X-ray diffraction studies. The X-ray powder diffraction patterns were measured on a PANalytical Empyrean Debye-Scherrer diffractometer equipped with an incident-beam focusing mirror and an X'Celerator detector. The patterns (1–100° 2θ, 0.0083557° steps, 4 s per step, 1/4° divergence slit, 0.02 radian Soller slits) were measured using MoKα radiation.
The Rietveld refinement technique (Rietveld, Reference Rietveld1969) with the software suite GSAS-II (Toby and von Dreele, Reference Toby and Von Dreele2013) was used to determine the structure of (CaxSr2−x)MnWO6 (x = 0.25, 0.5, 0.75, 1.5, 1.75). Reference patterns were obtained using a Rietveld pattern decomposition technique. The reported peak positions were derived from the extracted integrated intensities, and positions calculated from the lattice parameters. For peaks that cannot be resolved, the intensities are summed, and an intensity-weighted d-spacing is reported.
D. Bandgap measurements
Optical properties of the (CaxSr2−x)MnWO6 (x = 0.0, 0.25, 0.5, 1.00, 1.5, 1.75, 2.0) compounds were investigated by obtaining the UV–visible absorption spectra. In this series of studies, we also used compounds of x = 0.0 and 2.0 to establish the trend. The UV–visible optical absorption spectra were measured using a DU 640 spectrophotometer equipped with tungsten/deuterium sources and an autocollimating quartz crystal prism as a monochromator. The samples were ground and casted onto Scotch tapes. The light passed through the ground sample particles on tapes and the transmittance was recorded by a photodiode detector from 200 to 1300 nm.
III. RESULTS AND DISCUSSION
A. XRD and XRF results
Results of Rietveld refinements for the (CaxSr2−x)MnWO6 (x = 0.25, 0.5, 0.75, 1.5, 1.75) series are shown in Table I and Figure 1. Table I gives various refinement statistical agreement factors whereas in Figure 1, the observed (crosses), calculated (solid line), and difference XRD patterns (bottom) for (Ca0.5Sr1.5) MnWO6 are illustrated; the difference pattern is plotted at the same scale. The row of tick marks indicates the calculated peak positions. Table II lists the lattice parameters while atomic coordinates and displacement parameters are given in Table III. All samples contain a small amount of W (ranging from 1.8% to 3.8%) (Table I). The presence of W was easy to identify but not the other minor phases associated with the presence of W. These phases are likely present in the amorphous form. As a result, we do not expect a significant deficiency of W in the main phase and therefore affecting the main chemistry. The bond distances are summarized in Table IV.

Figure 1. Observed (crosses), calculated (solid line), and difference XRD patterns (bottom) for the powder X-ray diffraction pattern of (Ca1.25Sr0.75)MnWO6 by the Rietveld analysis technique. The difference pattern is plotted at the same scale as the other calculated peak positions.
Table I. Rietveld refinement residuals for (CaxSr2−x)MnWO6 (x = 0.25, 0.5, 0.75, 1.5, 1.75).

The structure is monoclinic P21/n (No. 14).
Table II. Cell parameters for (CaxSr2−x)MnWO6 (x = 0.25, 0.5, 0.75, 1.5, 1.75).

The structure is monoclinic P21/n (No. 14), Z = 2. The cell volume decreases as the concentration of Ca increases due to the smaller ionic radius of Ca2+ compared with Sr2+. The cell parameters of other pertinent phases from the PDF (Gates-Rector and Blanton, Reference Gates-Rector and Blanton2019) are added.
Table III. Atomic coordinates and displacement parameters for compounds for (CaxSr2−x)MnWO6 (x = 0.25, 0.5, 0.75, 1.5, 1.75).

The structure is monoclinic P21/n (No. 14). The U iso of O6 and O7 were constrained to be the same as O5.
Table IV. Bond distances for (CaxSr2−x)MnWO6 (x = 0.25, 0.5, 0.75, 1.5, 1.75).

The structure is monoclinic P21/n (No. 14). (Sr/Ca) site has a 12-fold coordination and both Mn and W sites have distorted octahedral 6-fold coordination.
The atomic ratio calculation for Sr/Mn, Ca/Mn, W/Mn, as well as uncertainties are estimated for each of the three samples using an X-ray fluorescence technique and compared to the provided nominal values (Table V). We assume that Mn is an atomic ratio of “1.0” in this calculation. The Mn was chosen, due to its atomic ratio being a constant for each sample. Expanded uncertainties are provided as ranges for approximate 95% confidence (with a coverage factor of k = 2).
Table V. Atomic ratio calculation for Sr/Mn, Ca/Mn, W/Mn, as well as uncertainties from X-ray fluorescence studies.

The results show a trend agreement in Sr atomic concentrations with two of the three samples agreeing within confidence intervals. In all cases, the Sr ratio is slightly higher than predicted in XRD. The results also show a trend agreement for Ca atomic composition, when compared with XRD results. In each sample, the XRF Ca atomic ratio uncertainty range is slightly below the XRD predicted result. The W atomic concentration from XRF calculated uncertainty ranges shows agreement for two of the three samples, with a slightly higher atomic concentration for the Sr1.75Ca0.25MnWO6 sample. The slightly higher W atomic ratios may be due to the presence of a small amount of W in the samples. The slightly low Ca values are likely an artifact caused by material self-attenuation which is difficult to account for with loose powder samples.
B. Crystal structures of (CaxSr2−x)MnWO6
Although the structure of (CaxSr2−x)MnWO6 has been determined to be monoclinic, the β angles in the structure of these materials are all very close to 90°, and the lattice parameters a and b are very close to each other, therefore the structure can be considered as pseudo-tetragonal. A trend of decreasing cell volume against the “x” value is observed as expected, as the ionic radius of Ca2+ is smaller than that of Sr2+ (Shannon, Reference Shannon1976). The WO6 and MnO6 octahedra are all distorted, as evidenced from the different W–O distances and Mn–O distances within the octahedra. As the concentration of Ca increases, the average Mn–O distances also decrease from 2.1956 to 2.1923 Å, and W–O distances decrease from 1.9152 to 1.9113 Å.
Figures 2–4 illustrate the 3D structure of (CaxSr2−x)MnWO6 featuring alternating distorted MnO6 and WO6 octahedra. In brief, the structure is built from corner-shared distorted WO6 and MnO6 octahedra similar to the rock salt structure. The most commonly occurring distortion in perovskites is the octahedral tilting (Woodward, Reference Woodward1997). Octahedral tilting is a major contributor to structural variability in perovskites, which refers to the tilting of the BX6 octahedra about one or more of their symmetry axes, maintaining both regularity of the octahedra (approximately) and their corner connectivity. In other words, such tilting allows greater flexibility in the coordination of the A cation, while leaving the environment of the B cation essentially unchanged. Another octahedral distortion is a rotational mismatch. Rotational mismatch angles can be expressed as torsional angles (consider an arrangement of four atoms A,B,C, and D in a structure, the torsional angle χ [A,B,C,D] is defined by the angle between the planes formed by atoms A,B,C and atoms B,C,D. Viewing along B to C, the torsion angle is considered positive if a clockwise rotation is required to bring atom A in line with atom D). It is obvious that the (CaxSr2−x)MnWO6 series exhibits the characteristics of the distorted double perovskite structure, with various rotational mismatch angles and tilt angles as one views the WO6 and MnO6 octahedra with respect to each other (discussed below).

Figure 2. Structure of (CaxSr2−x)MnWO6 showing alternating corner-sharing distorted MnO6 and WO6 octahedra along ab diagonal to illustrate the distortions of the WO6 and MnO6 octahedra. Green – W, blue – Mn, and small spheres – O.

Figure 3. Structure of (CaxSr2−x)MnWO6 showing alternating corner-sharing distorted MnO6 and WO6 octahedra along the b-axis. Green – W, blue – Mn, and small spheres – O.

Figure 4. Structure of (CaxSr2−x)MnWO6 with an inserted plane as a reference to show the relative size of the MnO6 and WO6 octahedra and the 3D structure more clearly.
As an example concerning the rotational mismatch angles and tilt angle in the (CaxSr2−x)MnWO6 series, Figures 5–8 illustrate the monoclinic structure of (Sr1.25Ca0.75)MnWO6 viewing along the c-axis. Figures 5 and 6 give the rotational mismatch angles of the MnO6 octahedra, view along the c-axis, for two neighboring layers of the monoclinic double perovskite. Figures 7 and 8 (also view along the c-axis) give the rotational mismatch angles of WO6 octahedra for two neighboring layers. Table VI provides the rotational mismatched angles (given as torsional angles) for five representative compositions of (CaxSr2−x)MnWO6 (x = 0.25, 0.5, 0.75, 1.5, 1.75), and the tilt angles (Figures 9 and 10). An expected trend is observed. As the Ca content increases (mismatch of the size of Sr and Ca increases) in the Sr/Ca site, the rotational mismatched angles as well as the tilt angles increase. For example, for the MnO6 octahedra, the mismatched angles are ranged from 7.96(6)° to 9.48(8)° clockwise, 10.44(6)° to 13.12(8)° counterclockwise; for the WO6 octahedra, the mismatched angles are ranged from 9.28(7)° to 11.23(9)° clockwise, and 11.92(7)° to 14.87(9)° counterclockwise. Correspondingly, the tilt angles increase from 11.60(15)° to 14.20(3)° for the MnO6 octahedra, and from 13.34(2)° to 16.35(3)° for the WO6 octahedra.

Figure 5. Rotational mismatch angles (see definition in the legend of Table VI) of MnO6 octahedron (blue) for the monoclinic double perovskite (Sr1.25Ca0.75)MnWO6, viewed approximately along the c-axis.

Figure 6. Rotational mismatch angles (see definition in the legend of Table VI) of the next layer of MnO6 octahedron (blue) for the monoclinic double perovskite (Sr1.25Ca0.75)MnWO6, viewed approximately along the c-axis.

Figure 7. Rotational mismatch angles (see definition in the legend of Table VI) of WO6 octahedron (green) for the monoclinic double perovskite (Sr1.25Ca0.75)MnWO6, viewed approximately along the c-axis.

Figure 8. Rotational mismatch angles (see definition in the legend of Table VI) of the next layer of WO6 octahedron (green) for the monoclinic double perovskite (Sr1.25Ca0.75)MnWO6, viewed approximately along the c-axis.
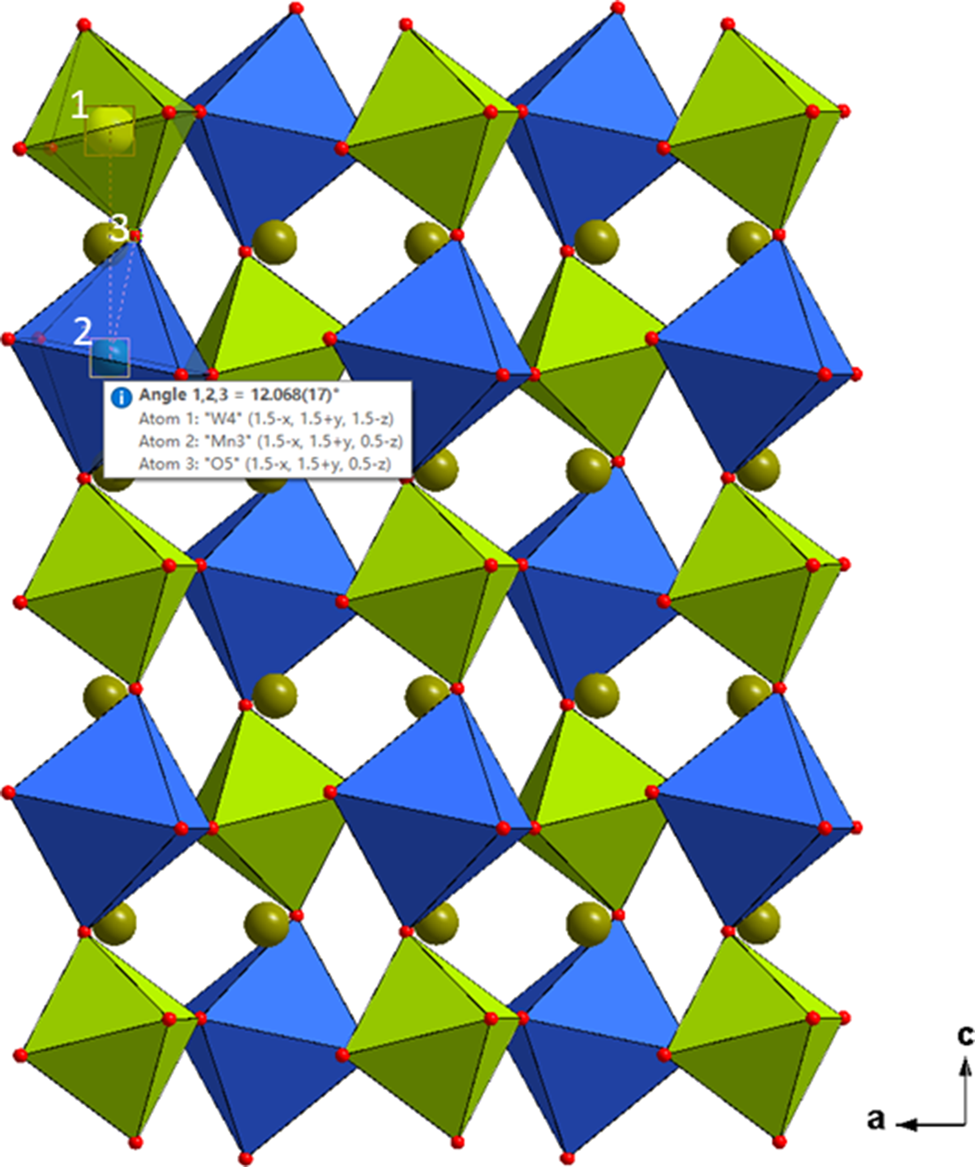
Figure 9. Tilt angles of MnO6 octahedron (W–Mn–O) (blue) for the monoclinic double perovskite (Sr1.25Ca0.75)MnWO6, viewed along the b-axis.

Figure 10. Tilt angles of WO6 octahedron (Mn–W–O) (green) for the monoclinic double perovskite (Sr1.25Ca0.75)MnWO6, viewed along the b-axis.
Table VI. Rotational mismatched angles (torsional angles) and tilt angles found in (CaxSr2−x)MnWO6 (x = 0.25, 0.5, 1.5, 1.75). The tilt angles of WO.

Rotational mismatch angles can be expressed as torsional angles (consider an arrangement of four atoms A,B,C, and D in a structure, the torsional angle χ [A,B,C,D] is defined by the angle between the planes formed by atoms A,B,C and atoms B,C,D. Viewing along B to C, the torsion angle is considered positive if a clockwise rotation is required to bring atom A in line with atom D). The tilt angles of WO6 and MnO6 octahedra are referred to the (Mn–W–O) and the (W–Mn–O) angles, respectively.
The distorted nature of the WO6 and MnO6 octahedra are also revealed in the bond distances of Mn–O and W–O, while the bond angles of O–Mn–O and O–W–O are only slightly deviated from 90° or 180°. For example, the W–O distances range from 1.8997(13) Å to 1.9207(11) Å in WO6 and from 2.1807(13) Å to 2.2033(12) Å in MnO6.
As shown in Table IV, all Sr/Ca atoms were found to be inside the channels, occupying a 12-oxygen coordination site. The average Sr/Ca–O bond distances range from 2.601 to 2.472 Å, as the concentration of Ca increases. In general, Ca–O cage would have a smaller coordination number as compared to that of Sr–O and Ba–O containing cages. In this series, because of the doping of Sr on Ca site, the site coordination number of (Ca, Sr) were found to be the same as that of Sr. In other words, the (Ca, Sr)–O cages also have a coordination number of 12, but with a smaller average value of distance of 2.54 Å. In our previous study of the (Ba,Sr)CoWO6 series, the coordination for Ba/Sr case was also found to be 12 (Wong-Ng et al., Reference Wong-Ng, Liu, Yang, Derbeshi, Windover and Kaduk2020), but the average (Ba,Sr)–O distance is at a larger value of 2.82 Å.
C. Bandgap studies
Figure 11 shows the UV–visible absorption spectra of the (CaxSr2−x)MnWO6 (x = 0.0, 0.25, 0.5, 0.75, 1.25, 1.5, 1.75) compounds. There is a strong absorption between 500 and 700 nm for all samples. The absorption edge varies with the Ca/Sr ratio and a strong red-shift was observed in these (CaxSr2−x)MnWO6 samples.

Figure 11. UV–visible absorption spectra of the as-synthesized (CaxSr2−x)MnWO6 (x = 0.25, 0.5, 0.75, 1.25, 1.5, 1.75) compounds.
The optical bandgaps E g can be estimated from the absorption coefficient (α) using the Tauc relation (Tauc et al., Reference Tauc, Grigorovici and Vancu1966),
 $$\alpha h\nu = A( h\nu -E_{\rm g}) ^n$$
where A is a constant that depends on the transition probability, hν is the energy of incident photons, n is an index that characterizes the optical absorption process. A linear fitting near the absorption edge can be achieved in the (αhν)1/n vs. hν plot to calculate the bandgap of these semiconductor materials. The values of n = 2, 1/2, 3, and 3/2 correspond to allowed-indirect, allowed-direct, forbidden-indirect, and forbidden-direct bandgap, respectively (Qasrawi, Reference Qasrawi2005). The UV–visible spectra shown in Figure 11 were fitted with n = 1/2, 2, 3, and 3/2 based on the Tauc relation. We found that the value of n = 1⁄2 fitted the curves best. Figure 12 shows the Tauc plots of the samples when n = 1/2. Therefore, the synthesized compound appears to be a direct-allowed semiconductor. The bandgaps were then calculated based on n = 1/2. In other words, the bandgaps E g of the (CaxSr2−x)MnWO6 (x = 0.0, 0.25, 0.5, 0.75, 1.00, 1.25, 1.5, 1.75, 2.0) compounds were obtained by extrapolating the linear portion of the plots of (αhν)2 vs. photon energy hν ((αhν)2 = 0), as shown in Figure 12.

Figure 12. Tauc plot for calculating bandgaps E g of (CaxSr2−x)MnWO6 (x = 0.25, 0.5, 0.75, 1.25, 1.5, 1.75) by extrapolation of the linear portion of the plots of (αhν)2 vs. photon energy hν.
Figure 13 shows the calculated bandgap of (CaxSr2−x)MnWO6. The bandgap values (allowed-direct electronic transitions) are lowest (E g = 1.68 eV) when x = 1.00 and the highest when x = 0 (E g = 2.28 eV) and x = 2.00 (E g = 2.30 eV). The crystallographic structure and Ca/Sr ratio clearly affect the bandgap value. Theoretical calculation indicated that the bandgap of monoclinic Ca2MnWO6 (space group of P21/c) to be 2.199 eV (Persson, Reference Persson2014a). The theoretical bandgap value of monoclinic Sr2MnWO6 (space group of P21/c) was reported as 1.945 eV (Persson, Reference Persson2014b). Both calculated values are somewhat lower than our values, but still greater than those values of compounds with intermediate x values. Additionally, the bandgap of the monoclinic phase was calculated to be of the “indirect” type (different from our estimated bandgap of the “direct” type). The bandgap of trigonal Ca2MnWO6 (space group of R3) was calculated to be 2.679 eV (Jain et al., Reference Jain, Ong, Hautier, Chen, Richards, Dacek, Cholia, Gunter, Skinner, Ceder and Persson2013) by assuming an indirect-bandgap. The bandgap of cubic Sr2MnWO6 was experimentally estimated to be 2.5 eV using reflectance spectroscopy measurements (Fujioka et al., Reference Fujioka, Frantti and Kakihana2004), 9.6% higher than our value. Regardless, all these reported values and our measured values are not substantially different, and they are all nominally under 2.7 eV.

Figure 13. Bandgap values of (CaxSr2−x)MnWO6. Reported values are also listed for comparison. x: theoretical value of a rhombohedral phase with R3 space group (Jain et al., Reference Jain, Ong, Hautier, Chen, Richards, Dacek, Cholia, Gunter, Skinner, Ceder and Persson2013); +: experimental values of a cubic phase with space group of  $Fm\bar{3}m$ (Fujioka et al., Reference Fujioka, Frantti and Kakihana2004); upward triangle: theoretical value of monoclinic P21/c structure (Persson, Reference Persson2014a); downward triangle: theoretical value of monoclinic P21/c structure (Persson, Reference Persson2014b).
From the above UV–visible absorption and bandgap data, it is clear that the (CaxSr2−x)MnWO6 series can absorb visible light of the solar radiation. Therefore, the (CaxSr2−x)MnWO6 materials are potential photocatalysts and photovoltaic materials.
D. Reference powder X-ray diffraction patterns
Reference patterns for the (CaxSr2−x)MnWO6 (x = 0.25, 0.5, 0.75, 1.5, 1.75) compounds have been prepared and submitted for inclusion in the PDF. An example of the pattern (Ca05Sr1.5) MnWO6 (with d-spacing values >0.8 Å) is given in Table VII. In this pattern, the symbols “M” and “+” refer to peaks containing contributions from two and more than two reflections, respectively. The particular peak that has the strongest intensity in the entire pattern is assigned an intensity of 999 and other lines are scaled relative to this value. The d-spacing values are calculated values from refined lattice parameters. The intensity values reported are integrated intensities (rather than peak heights). For resolved overlapped peaks, intensity-weighted calculated d-spacing, along with the observed integrated intensity and the hkl indices of both peaks (for “M”), or the hkl indices of the strongest peak (for “+”) are used. For peaks that are not resolved at the instrumental resolution, the intensity-weighted average d-spacing and the summed integrated intensity value are used. In the case of a cluster, unconstrained profile fits often reveal the presence of multiple peaks, even when they are closer than the instrumental resolution. In this situation, both d-spacing and intensity values are reported independently.
Table VII. X-ray powder pattern for (Ca0.50Sr1.5)MnWO6.

The structure is monoclinic P21/n (No. 14). The symbols “M” and “+” refer to peaks containing contributions from two and more than two reflections, respectively. The particular peak that has the strongest intensity in the entire pattern is assigned an intensity of 999 and other lines are scaled relative to this value. The d-spacing values are calculated values from refined lattice parameters, and “I” represents integrated intensity values.
IV. SUMMARY AND FUTURE WORK
We have successfully determined the structure, measured the bandgap and prepared X-ray powder diffraction patterns for the series of semiconductors (CaxSr2−x)MnWO6. Their X-ray patterns have been submitted to the ICDD for inclusion in the PDF database. All Sr/Ca sites have 12-fold coordination environment and all the ordered W and Mn sites are 6-fold (octahedral) coordinated. These double perovskites consist of alternate distorted MnO6 and WO6 octahedra along the c-axis. These octahedra are rotated and tilted with respect to each other along the pseudo-tetragonal c-axis. The bandgaps of these samples including literature reported values are all less than 2.7 eV (whether experimental or theoretical values), therefore (CaxSr2−x)MnWO6 can absorb visible light of the solar radiation and they are potential photocatalysts and photovoltaic materials. We plan to continue studying selected members of the (CaxSr2−x)MnWO6 series for their magnetic structures by using neutron diffraction and density function (DFT) calculations.
ACKNOWLEDGEMENTS
ICDD is acknowledged for the Grants-in-Aid assistance for the project (Grant #0903).
CONFLICTS OF INTEREST
The authors declare none.


