


This article presents a simple model that uses results of generic ballot polling to predict the outcome of the 2018 elections to the US House of Representatives. The “generic ballot” refers to a question included in numerous national polls asking voters which party they favor in the House elections without providing the names of the candidates. When combined with two other variables—the party of the president and the number of seats held by each party prior to the election—this model produces very accurate predictions of seat swing in House midterm elections. The model currently predicts a strong likelihood of a Democratic takeover of the House.
For the 18 midterm elections since World War II, the results of the generic ballot test are highly correlated with the party division of the national popular vote for the House (r=.82). The generic ballot also can accurately predict seat swing in midterm elections when incorporated in a statistical forecasting model (Abramowitz Reference Abramowitz2010; Abramowitz Reference Abramowitz2014; McGhee and Baldassare Reference McGhee and Baldassare2004; Moore and Saad Reference Moore and Saad1997). In this article, I use results of a simple three-variable model including the generic ballot to provide conditional forecasts of seat swing in the 2018 midterm election.Footnote 1
The president’s party almost always loses House seats in midterm elections—this has been true in 16 of 18 midterm elections since World War II. However, these elections have produced a wide range of outcomes, from a gain of eight seats in 2002 to a loss of 63 seats in 2010. So what explains the variability in midterm results and what can we expect in 2018?
In addition to the results of the generic ballot test in early September of the election year, two other predictors go a long way toward explaining seat swing in midterm elections—the party in the White House and the number of seats held by each party prior to the election. The president’s party matters because, regardless of whatever else is going on, voters tend to turn against the party in the White House in midterm elections. And the number of seats each party holds prior to the election matters because, all else being equal, the more seats the president’s party has to defend, the more seats it is likely to lose.
The president’s party almost always loses House seats in midterm elections—this has been true in 16 of 18 midterm elections since World War II.
Table 1 displays the results of a regression analysis of seat swing in midterm House elections between 1946 and 2014. The dependent variable here is the change in Republican seats in the House. The independent variables are the number of Republican seats in the House before the election, the party of the president (+1 for a Republican president, −1 for a Democratic president), and the Republican lead or deficit on the generic ballot immediately after Labor Day. I use Gallup Poll data for elections through 2002 and the RealClearPolitics average for elections after 2002.
Table 1 Regression Analysis of Seat Change in Midterm House Elections, 1946–2014

Source: Data compiled by author.
All three predictors are highly statistically significant and the model explains about 90% of the variation in seat swing across these 18 elections. The coefficient of −.492 for previous Republican seats reflects the impact of exposure to risk—for every additional seat Republicans hold going in a midterm election, they can expect to lose close to half of a seat.
The coefficient of −13.7 for the midterm variable means that after controlling for the other predictors in the model, having a Republican in the White House costs the GOP an average of close to 14 seats. This coefficient also means that having a Democrat in the White House would be expected to result in a Republican gain of almost 14 seats in a midterm election. Thus, even in a neutral political environment, one where the generic ballot test resulted in a tie, Republicans could expect to lose about 14 House seats in the 2018 midterm election.
Finally, the coefficient of 1.795 for the generic ballot variable means that for every additional one-point advantage Democrats enjoy on the generic ballot in early September of the midterm year, Republicans can expect to lose about 1.8 additional seats in the House.
Figure 1 displays a scatterplot of the relationship between predicted and actual seat swing in House midterm elections based on the generic ballot model. The results show that the model does an excellent job of predicting House seat swing. Most of the points are very close to the prediction line. However, a few elections, especially the highly unusual post-9/11 midterm of 2002, are farther off the mark.

Figure 1 Scatterplot of Change in Republican House Seats by Predicted Change in Republican House Seats
Source: Data compiled by author.
It is especially encouraging to note that the model’s forecast for the 2014 midterm election, a Republican gain of 18 seats, was very close to the actual GOP pickup of 13 seats. This is significant because the 2014 midterm election occurred after the post-2010 round of redistricting in which Republicans were able to redraw House district lines in many states. Despite this, the model actually slightly overestimated Republican seat gains in 2014. There is little reason to believe, therefore, that the model’s predictions for 2018 will be thrown off by the effects of post-2010 redistricting.
Based on the results in table 1, we can calculate conditional forecasts of seat swing in the 2018 midterm election, depending on the results of the generic ballot test in early September. The other two predictors, presidential party and Republican House seats, currently 240, are already set. The conditional forecasts are displayed in table 2.
Table 2 Predicted Change in Republican House Seats by Generic Ballot Results
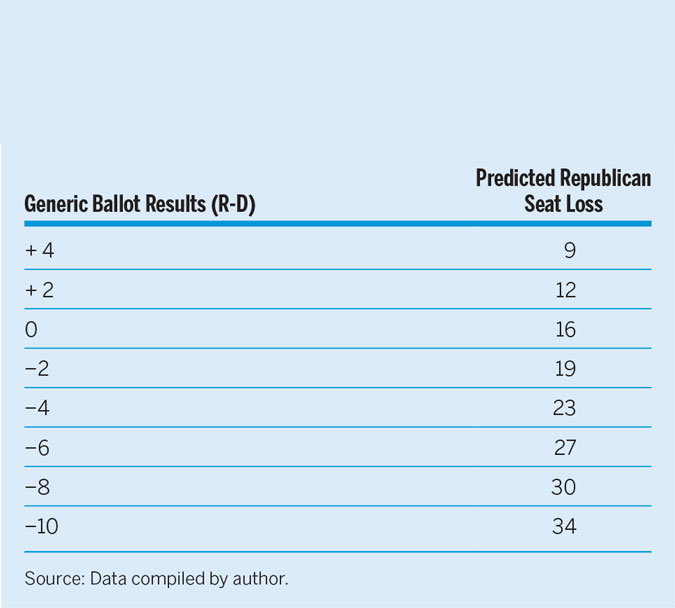
Source: Data compiled by author.
The predictions in table 2 show that Democrats need a lead of at least four points on the generic ballot in early September in order to have a 50% chance of gaining the 23 seats that they need to take back control of the House. Based on the results of recent national polls, that number appears well within reach. On average, based on calculations from Nate Silver’s FiveThirtyEight website, on August 20, Democrats held an adjusted lead of just under eight points on the generic ballot. That is very close to the average Democratic lead over the past year. A lead of that magnitude would result in a predicted Democratic gain of about 30 House seats, more than enough to regain control of the chamber. Given the model’s standard error of 11.6 seats, that forecast would give Democrats about a two-thirds chance of winning a majority of seats in the House.


