High pressure can be applied to modify casein micelles. Parameters like pressure level (Desobry-Banon et al. Reference Desobry-Banon, Richard and Hardy1994; Gaucheron et al. Reference Gaucheron, Famelart, Mariette, Raulot, Michel and Le Graet1997; Schrader & Buchheim, Reference Schrader and Buchheim1998; Velez-Ruiz et al. Reference Velez-Ruiz, Swanson and Barbosa-Canovas1998; Needs et al. Reference Needs, Stenning, Gill, Ferragut and Rich2000; García-Risco et al. Reference García-Risco, Olano, Ramos and López-Fandiño2000; Huppertz et al. Reference Huppertz, Fox and Kelly2004a; Regnault et al. Reference Regnault, Thiebaud, Dumay and Cheftel2004), holding time (Fertsch et al. Reference Fertsch, Müller and Hinrichs2003; Huppertz et al. Reference Huppertz, Fox and Kelly2004a) and temperature (Gaucheron et al. Reference Gaucheron, Famelart, Mariette, Raulot, Michel and Le Graet1997; García-Risco et al. Reference García-Risco, Olano, Ramos and López-Fandiño2000; Huppertz et al. Reference Huppertz, Fox and Kelly2004a, Reference Huppertz, Fox and Kellyb; Regnault et al. Reference Regnault, Thiebaud, Dumay and Cheftel2004) as well as the milieu like calcium content (Lee et al. Reference Lee, Anema, Schrader and Buchheim1996) or pH (Arias et al. Reference Arias, López-Fandiño and Olano2000; Huppertz et al. Reference Huppertz, Fox and Kelly2004a) influence dissociation and reassociation of caseins.
Casein micelles in milk were dissociated into subunits at a pressure of 400 MPa according to Schmidt & Buchheim (Reference Schmidt and Buchheim1970), Schrader & Buchheim (Reference Schrader and Buchheim1998), Needs et al. (Reference Needs, Stenning, Gill, Ferragut and Rich2000) and Regnault et al. (Reference Regnault, Thiebaud, Dumay and Cheftel2004). In more detail, several studies using photon correlation spectroscopy (PCS) showed an increase of the casein micelle size at pressures of 200 to 250 MPa (Gaucheron et al. Reference Gaucheron, Famelart, Mariette, Raulot, Michel and Le Graet1997; Huppertz et al. Reference Huppertz, Fox and Kelly2004a) followed by a decrease of the micelle size at up to 400 MPa (Desobry-Banon et al. Reference Desobry-Banon, Richard and Hardy1994; Gaucheron et al. Reference Gaucheron, Famelart, Mariette, Raulot, Michel and Le Graet1997; Needs et al. Reference Needs, Stenning, Gill, Ferragut and Rich2000; Huppertz et al. Reference Huppertz, Fox and Kelly2004a; Regnault et al. Reference Regnault, Thiebaud, Dumay and Cheftel2004). The decrease of the micelle size after treatment at 400 and 600 MPa was also confirmed by transmission electron microscopy (Gaucheron et al. Reference Gaucheron, Famelart, Mariette, Raulot, Michel and Le Graet1997; Schrader & Buchheim, Reference Schrader and Buchheim1998; García-Risco et al. Reference García-Risco, Olano, Ramos and López-Fandiño2000; Needs et al. Reference Needs, Stenning, Gill, Ferragut and Rich2000; Keenan et al. Reference Keenan, Young, Tier, Jones and Underdown2001). It is assumed that the pressure-induced dissociation of the casein micelle occurs by the weakening of hydrophobic and electrostatic interactions between the micelle subunits (Mozhaev et al. Reference Mozhaev, Heremans, Frank, Masson and Balny1996) and the solubilization of colloidal calcium phosphate (CCP) out of the micellar framework (Shibauchi et al. Reference Shibauchi, Yamamoto and Sagara1992; Lee et al. Reference Lee, Anema, Schrader and Buchheim1996; Schrader et al. Reference Schrader, Buchheim and Morr1997).
The increase in micelle size up to 250 MPa accompanied by an increase of viscosity and hydration was considered to be due to the association of previously dissociated casein due to hydrophobic interactions. This increase is favoured by higher temperature (Anema et al. Reference Anema, Lowe and Stockmann2005) but also by the solubilization of CCP rendering the casein micelles less compact and to the formation of casein micelles chains and clusters (Shibauchi et al. Reference Shibauchi, Yamamoto and Sagara1992; Desobry-Banon et al. Reference Desobry-Banon, Richard and Hardy1994; Gaucheron et al. Reference Gaucheron, Famelart, Mariette, Raulot, Michel and Le Graet1997; Walstra, Reference Walstra1990; Huppertz et al. Reference Huppertz, Fox and Kelly2004b).
The pressure-induced structure of the casein micelles was also affected by protein concentration: Firm gels were obtained after pressure treatment when the protein content was high (Velez-Ruiz et al. Reference Velez-Ruiz, Swanson and Barbosa-Canovas1998; Hinrichs, Reference Hinrichs2000).
Pressure effects are governed by Le Chatelier's principle, which states that a system tends to minimize the effect of any external factor by which it is perturbed. Thus, reactions that result in reduced volume will be promoted under high pressure whereas those associated with a volume increase are retarded (Masson, Reference Masson, Balny, Hayashi and Heremans1992; Mozhaev et al. Reference Mozhaev, Heremans, Frank, Masson and Balny1996). Hydrophobic and electrostatic interactions in the casein micelles are accompanied by a positive reaction volume (+10 to +20 ml mol−1) and therefore weakened under pressure and reactivated during pressure release (Suzuki & Taniguchi, Reference Suzuki, Taniguchi, Sleigh and Mac Donald1972; Hinrichs, Reference Hinrichs2000). Keenan et al. (Reference Keenan, Young, Tier, Jones and Underdown2001) noted that a gelling process in concentrated milk occurred during decompression. Fertsch et al. (Reference Fertsch, Müller and Hinrichs2003) showed that a high pressure release rate induced the formation of a firm gel while a softer gel was formed at a low release rate. However, the role of the pressure release phase on the properties of the resulting structures is not sufficiently understood yet.
The objective of this study was to investigate the influence of casein content and pressure release rate on the formation of pressure-induced casein micelle structures in more detail. The sol-gel transition of casein structures was characterised after high pressure treatment at 600 MPa (30 min/30°C) depending on the protein content from 1 to 15 g/100 ml and applying pressure release rates between 20 and 600 MPa min−1. In addition, pressure-induced modifications of the casein structure in the sol phase (5 g/100 ml casein content) were described by measuring voluminosity and particle size and by atomic force microscopy.
Material and methods
Sample preparation and high pressure treatment
The experiments were carried out with an enriched micellar casein powder produced by diafiltration of skim milk at the Institute of Food Process Engineering in Freising, Germany (Kersten, Reference Kersten2001). Skim milk was diafiltrated by means of microfiltration (MF, module 7P19-40GL; cut off: 100 nm, APV, 8600 Silkeborg, Denmark). The MF-permeate obtained was ultrafiltrated (cut off: 25 kDa, DDS AS, 4900 Nakskov, Denmark) and used for diafiltration. After six washing steps the casein retentate was concentrated by microfiltration (concentration factor 4) and spray-dried (Niro Atomizer, 2860 Soeborg, Denmark). The powder contained per 100 g: 68·4 g total protein including 68·0 g casein, 16·6 g lactose, 8·4 g minerals including 2·3 g calcium and 6·5 g water.
The casein powder was diluted in a reconstituted ultrafiltration permeate (UFP, Ingredia Dairy Ingredients, 3602 Thun, Switzerland) obtained from milk to adjust the casein content in the sample from 1 to 15 g/100 ml and mixed for 3 h at room temperature. The UFP-powder contained per 100 g: 84·9 g lactose, 7·4 g minerals including 0·5 g calcium, 4·8 g water and 2·9 g total protein and was rehydrated with deionized water to achieve a total water content of 94·8 g/100 g. The protein content was checked with a nitrogen analyser using Dumas method (LECO FP-528, Leco Instrumente GmbH, 41199 Moenchengladbach, Germany). Prior to high pressure treatment pH was adjusted to pH 6·0 by adding lactic acid 10% (VWR, 64283 Darmstadt, Germany). The samples were filled into 20 ml HDPE tubes (inner diameter 32 mm, filled height 14 mm; Nalgene, Novodirect, 77694 Kehl, Germany) and closed with a silicone plug (VWR, 64283 Darmstadt, Germany). The samples were tempered for more than 5 min at the appropriate temperature of 30°C before being pressurized.
In the high pressure autoclave (inner volume 125 ml; height 100 mm; diameter 40 mm) (Resato High Pressure Technology, 9301 Roden, Netherlands) pressure was built up with a rate of 200 MPa min−1 and held constant at 600 MPa for 30 min at 30°C. A temperature increase of about 2 deg C in the autoclave was noticed during the pressure built up phase. Equilibration took place within about 5 min. Pressure release was varied from 20 to 600 MPa min−1. After treatment, the samples were stored overnight at 4°C before analysis. The following results are the mean of three independent pressure experiments carried out on different days.
Structure diagram
The formation of pressure-induced (pressure built-up rate: 200 MPa min−1; pressure level: 600 MPa, 30 min, 30°C) casein structures depending on pressure release rate (600, 200 and 20 MPa min−1) and casein content (1 to 15 g/100 ml) was illustrated in a structure diagram for sol-gel transition. Liquid samples (sol) were characterized by means of a flow curve using the same method as for the determination of the dynamic viscosity with the rotational rheometer (see below). The flow index (deviation from Newtonian flow) n of the samples was determined from the upward flow curve using the general power law relation (eq. 1).
σ: shear stress [Pa]; k ow consistency index;  : shear velocity [s−1]; n: flow index.
Samples with a flow index n⩾0·7 were defined to be part of the sol phase. Samples with a firmness higher than 0·02 N were classified as gel in the structure diagram. The firmness of gel-like-samples was determined at 4°C with a texture analyser (Zwick I, 89079 Ulm, Germany). A cylinder with a 5 mm diameter penetrated the sample with 7 mm depth at a rate of 0·5 mm s−1. The samples were directly measured in the HDPE tubes (inner diameter 32 mm, filled height 14 mm) in order to get also information about weak structures, which may be not stable outside the cup. The maximum strength was defined as firmness. Samples with a less firm structure with phase separation which could not be characterized by a flow curve nor by the firmness test were located in the transition phase of the structure diagram. Each point in the structure diagram represents the mean value of three independent high-pressure experiments.
Dynamic viscosity measurements of a casein solution in the sol phase
Dynamic viscosity η of the 5 g/100 ml casein solution was determined at 10°C before and after high pressure treatment (pressure built-up rate: 200 MPa min−1; pressure level: 600 MPa, 30 min, 30°C; release rate: 600, 200 and 20 MPa min−1) using a rotational rheometer (Advanced Rheometer AR 2000, TA Instruments, 63755 Alzenau, Germany). The shear rate was increased to 500 s−1 in 3 min, then held for 5 min at 500 s−1 and then decreased to 0 s−1 in 3 min. The apparent dynamic viscosity was defined as the viscosity at the end of the 5 min holding time at a shear rate of 500 s−1. It will be called viscosity in this work. Six viscosity measurements were carried out.
Calculation of the voluminosity
The voluminosity V a of the solution was calculated using the models by Gleissle & Baloch (Reference Gleissle and Baloch1983, cited by Windhab, Reference Windhab1986) and Windhab (Reference Windhab1986). This model assumes solid spherical particles and monodispersity. In laminar shear flow polydispersed systems tend to segregate after a certain time and the particles will arrange in layers with similar size showing a behaviour comparable to monodispersed systems. So we refer to this assumption for the calculation of the voluminosity in this study. The model by Gleissle & Baloch and Windhab describes the viscous behaviour of suspensions based on the concentration of suspended particles and can be applied for volume concentrations up to φmax:
η: dynamic viscosity of the solution [Pa⋅s]; η0: dynamic viscosity of the outer phase (here UFP) [Pa s]; φmax: maximum volume concentration occupied by the hydrated particles in the solution [ml/ml]; φ: volume concentration occupied by the hydrated particles [ml/ml].
In a study regarding shear stability of fat globules, Hinrichs & Kessler (Reference Hinrichs and Kessler1997) found that the particles in laminar shear condition are already coming into contact with each other at the volume concentration of φmax≈0·4. This assumption is supported by the Einstein's equation (Einstein, Reference Einstein1906) valid for low concentrations of dispersed particles:
Multiplication of eq. 2 with (1+φ/φmax) leads to:
For φ→0 eq. 3 can be simplified in:
According to Einstein's equation:
φmax is 0·4.
The voluminosity V a is related to the volume fraction with the equation φ=c casein⋅V a, where c casein is the casein concentration of the particles [g/ml].
Assuming that φmax=0·4, eq. (2) becomes
This equation was applied to calculate voluminosity from the average of six viscosity measurements of the 5 g/100 ml casein solution.
Particle size of the casein micelles in the sol
The mean hydrodynamic diameter d H of the casein micelles in the untreated and high pressure treated 5 g/100 ml casein solution was determined by photon correlation spectroscopy (PCS) at 25°C (HPPS, Malvern Instruments Ltd, Malvern WR14 1XZ Worcestershire, UK). This particle sizer uses back scattering with an angle of 173° which also enables measurement in undiluted solutions preventing dissociation of the casein micelles due to dilution effects. Three light scattering measurements of 60 s were carried out for each sample (refractive index of the outer phase (here UFP): 1·3395; viscosity of the outer phase: 1·0248 and wavelength: 632·8 nm). The results, expressed in nm, are determined from the intensity distribution curves and are the average of 15 measurements.
Atomic force microscopy (AFM)
To visualize the PCS results atomic force microscopy was carried out in analogy to Regnault et al. (Reference Regnault, Thiebaud, Dumay and Cheftel2004). A dimension 3100 microscope equipped with the nanoscope IIIa electronic device in the contact mode (Digital Instruments-Veeco, CA 93117 Santa Barbara, USA) was used. The untreated and high pressure treated casein solutions (5 g/100 ml) were diluted 30-fold in milk-UFP to avoid dissociation of the casein particles. Of each dilution, 8 μl were placed on a teflon disk and dried in ambient air for about 30 min. The pictures were analysed with the Digital Nanoscope Software (version 4.43r2, Digital Instruments-Veeco, CA 93117 Santa Barbara, USA).
Statistical analysis
The statistical analysis was carried out by means of a t-test (Sigma Plot 8.0, SPSS, Inc.) with a significance of P<0·05.
Results
Structure diagram for sol-gel transition
Structures from liquid (sol) to solid (gel) were generated depending on casein concentration (1 to 15 g/100 ml) and pressure release rate (20 to 600 MPa min−1). The observed structures are summarized in the structure diagram (Fig. 1).

Fig. 1. Structure diagram: Influence of pressure release rate and casein content on the gel-sol-transition of casein structures. S: sol; T: transition; G: gel; ●: indication for sol; ▲: indication for transition; ■: indication for gel.
At low casein content (⩽5 g/100 ml), the structures were still liquid. The higher the release rates and the protein contents, the higher was the viscosity. At a slow release rate of 20 MPa min−1 a gel was formed at casein content of 13 g/100 ml. Higher pressure release rates already induced gel structures with a casein content of 8·5 g/100 ml (200 MPa min−1) and 6·5 g/100 ml (600 MPa min−1). At a casein concentration of 7 g/100 ml a visual homogeneous and dimensionally stable microstructure was built up for a pressure release rate of 600 MPa min−1, while the lower release rates produced less firm gels (200 MPa min−1) or liquid structures (20 MPa min−1). Pressure-induced gel formation was not possible if casein content was 6 g/100 ml or less.
Voluminosity of the casein micelles
Changes in the voluminosity V a of a casein solution in the sol phase (5 g/100 ml casein content) as a function of pressure release rate are shown in Table 1.
Table 1. Voluminosity (calculated from apparent viscosity data of the rotational viscometer) of casein micelles from a casein solution [5 g casein/100 ml UFP] pressurized at 600 MPa/30°C for 30 min

† According to Gleissle & Baloch Reference Gleissle and Baloch1983 (eq. 6)
‡ Data within a column followed by the same letters are not significantly different at P<0·05
The influence of the pressure release rate on voluminosity is clearly shown: the higher the pressure release rate, the higher the voluminosity of the micelles. Table 1 illustrates that the voluminosity after a pressure release rate of 600 MPa min−1 was significantly (P<0·05) higher than the one of the untreated solution. After treatment with a release rate of 200 MPa min−1 and 20 MPa min−1 the voluminosity was significantly lower than that of the untreated solution.
Hydrodynamic diameter of the casein micelles
Changes in the hydrodynamic diameter d H of the casein micelle in a casein solution in the sol phase (5 g/100 ml casein content) as a function of pressure release rate are collected in Table 2.
Table 2. Average hydrodynamic diameter of casein micelles in untreated and pressurized (600 MPa/30°C for 30 min ) casein solution [5 g casein/100 ml UFP]

† Data within a column followed by the same letters are not significantly different at P<0·05
The largest hydrodynamic diameter was obtained with the highest pressure release rate. The hydrodynamic diameter at a pressure release rate of 600 MPa min−1 was significantly higher (about 25% more) than that of the untreated solution. At a pressure release rate of 200 MPa min−1 the hydrodynamic diameter was not significantly different from neither the untreated solution nor the 600 MPa min−1 treated one while the pressure release rate of 20 MPa min−1 induced the smallest diameter (about 40% less than in the untreated solution).
Atomic force microscopy
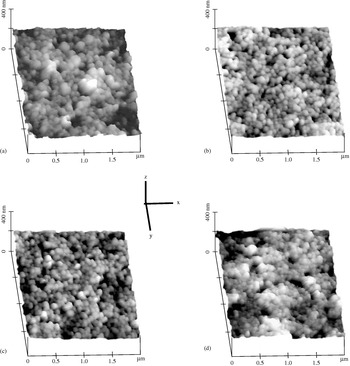
Parallel to particle size measurements, atomic force microscopy (AFM) observations were used to characterize pressure-induced changes of the structure of the casein micelles. Figure 2 shows AFM images for the untreated solution and the treated solution after pressure release of 600, 200 and 20 MPa min−1. All pictures show spherical casein micelles. Smaller casein particles were detected in casein solutions treated at a 600 MPa with a pressure release of 600 and 200 MPa min−1 (Fig. 2b & c) than in the untreated solution (Fig. 2a). After a slow pressure release of 20 MPa min−1, casein micelles appeared comparable to the untreated solution.

Fig 2. Atomic force microscopic images of casein solutions with 5 g casein/100 ml UFP after high pressure treatment with variation of the pressure release rate, (a) untreated casein solution, (b) pressure release rate 600 MPa min−1, (c) pressure release rate 200 MPa min−1 and (d) pressure release rate 20 MPa min−1.
Discussion
Protein content and pressure release rate influence the properties of high pressure induced casein micelles. At a casein content of about 7 g/100 ml, depending on the pressure release rate, sol as well as gel structures were observed. The higher the casein content and the faster the pressure release, the firmer were the structures built up and the finer were the microstructures. The influence of the casein content is due to the inner friction of the dispersed particles with the outer phase, and to the high water binding of the casein (Snoeren et al. Reference Snoeren, Damman and Klok1982). The influence of pressure release rate was illustrated by the voluminosity data. This influence is in good agreement with the results of Fertsch et al. (Reference Fertsch, Müller and Hinrichs2003) which showed that the firmness of pressure-induced casein gels with a 15 g/100 ml casein content was mainly affected by the pressure release rate. The hydrodynamic diameter of casein particles treated at 600 MPa with a release rate of 600 MPa min−1 was significantly larger than before the treatment. The voluminosity of the particles was also higher. However, the AFM pictures showed smaller casein micelles after treatment with a fast pressure release (600 MPa min−1) than in the untreated solution. The casein particles with large hydrodynamic diameter created by high pressure and detected by PCS are in fact casein aggregates built from smaller casein micelles. The non-covalent interactions in the casein micelles are weakened during pressure built-up and pressure holding phase inducing the dissociation of casein micelles into smaller fragments and casein monomers. This dissociation was demonstrated at a pressure of 300 MPa by Gebhardt et al. (Reference Gebhardt, Doster and Kulozik2005) by means of in situ photon correlation spectroscopy (they used the same micellar casein for the experiments as in this work). During pressure release phase, the binding forces take effect again (Suzuki et al. Reference Suzuki, Taniguchi, Sleigh and Mac Donald1972; Shibauchi et al. Reference Shibauchi, Yamamoto and Sagara1992; Masson, Reference Masson, Balny, Hayashi and Heremans1992; Hinrichs, Reference Hinrichs2000; Johnston et al. Reference Johnston, Rutherford and McCreedy2002; Fertsch et al. Reference Fertsch, Müller and Hinrichs2003). Thus, protein-protein interactions are re-established, the self-association of the caseins (Rollema & de Kruif, Reference Rollema, de Kruif, Aalbersberg, Hamer, Jasperse, de Jong, de Kruif, Walstra and de Wolf2003) starts, calcium bridges from free calcium in the serum phase are reformed (Shibauchi et al. Reference Shibauchi, Yamamoto and Sagara1992; López-Fandiño et al. Reference López-Fandiño, De la Fuente, Ramos and Olano1998; Abbasi et al. Reference Abbasi and Dickinson2002) and casein micelle aggregates are generated (Ohmiya et al. Reference Ohmiya, Fukami, Shimizu and Gekko1989; Johnston et al. Reference Johnston, Austin and Murphy1992a, Reference Johnston, Austin and Murphyb, Reference Johnston, Rutherford and McCreedy2002; Masson, Reference Masson, Balny, Hayashi and Heremans1992; Hinrichs, Reference Hinrichs2000; Fertsch et al. Reference Fertsch, Müller and Hinrichs2003). According to Needs et al. (Reference Needs, Stenning, Gill, Ferragut and Rich2000), the extensive reaggregation of the casein particles during pressure release is due to the high hydrophobicity of the submicellar particles at pressure above 400 MPa (Johnston et al. Reference Johnston, Rutherford and McCreedy1992). The presence of large casein aggregates has already been shown by Gaucheron et al. (Reference Gaucheron, Famelart, Mariette, Raulot, Michel and Le Graet1997), Law et al. (Reference Law, Leaver, Felipe, Ferragut, Pla and Guamis1998), García-Risco et al. (Reference García-Risco, Olano, Ramos and López-Fandiño2000) and Huppertz et al. (Reference Huppertz, Fox and Kelly2004a) for milk treated at pressures between 250 and 400 MPa and temperatures from 40 to 60°C. For the high release rate, the reassociation of casein micelles leads to an increase of the hydrodynamic diameter and therefore of the volume fraction of the solute, explaining the observed increase in solution voluminosity. This modification of voluminosity by high pressure caused the variation of viscosity and therefore of the functionality of the solution.
Previously photon correlation spectroscopy (PCS) showed a decrease of the micelle size up to 400 MPa (Desobry-Banon et al. Reference Desobry-Banon, Richard and Hardy1994; Gaucheron et al. Reference Gaucheron, Famelart, Mariette, Raulot, Michel and Le Graet1997; Needs et al. Reference Needs, Stenning, Gill, Ferragut and Rich2000; Huppertz et al. Reference Huppertz, Fox and Kelly2004a; Regnault et al. Reference Regnault, Thiebaud, Dumay and Cheftel2004). But one has to bear in mind that (i) the measurement of the particle size with dilution enables dissociation of the casein micelles due to dilution effects and (ii) the pressure release rate was not investigated explicitly.
As for a release rate of 600 MPa min−1, a release rate of 200 MPa min−1 induces a structure with smaller casein particles. However, voluminosity and hydrodynamic diameter of these particles are not higher but in the range of the particles in the untreated solution. Aggregates of small casein micelles are still induced but these aggregates are smaller than those after the faster pressure release rate of 600 MPa min−1. They have the size of the initial casein micelles before high pressure treatment.
After a slow release rate of 20 MPa min−1 casein micelles have a similar shape and diameter to those of the solution before high pressure treatment. Nevertheless, the initial structure is not rebuilt, the micelles show a smaller hydrodynamic diameter and a lower voluminosity than in the solution before treatment.
Considering once more these interactions and our experimental data, it can be assumed that a slow release rate may lead more or less to the original casein micelle structure due to the ability of the caseins to self-association. But high pressure release rates, far from equilibrium, disturb the self-association mechanisms of the caseins and new structures or aggregates made of casein fragments build up.
In conclusion, the formation of pressure-induced casein structures (600 MPa for 30 min at 30°C) has been investigated for different pressure release rates (20 to 600 MPa min−1) and casein contents (1 to 15 g/100 ml). The present study shows that the pressure release rate is a very important factor deciding over which structure is built up. A better understanding of the pressure-induced structure formation of the casein micelles on ultra-high pressure treatment may offer opportunities for the creation of novel dairy products.
The research has been supported by the DFG (Deutsche Forschungsgemeinschaft) as part of the project FOR 358/2. We like to thank Prof. Dr. A. Kuhn und Dr. U. Gerken, Institute for Microbiology, University of Hohenheim, for the collaboration in atomic force microscopy.