


The self-employment rate – the share of employed persons who are self-employed – rises markedly with age. Americans are living longer but many lack sufficient savings for retirement, raising interest in policies to facilitate work at older ages. In considering such policies, it is important to understand the role that self-employment may play in enabling continued attachment to the labor market. Although individuals may have financial or personal reasons for wanting to continue to work past the traditional age of retirement, they may need or wish to reduce their work hours or change their type of work. For a variety of reasons, older workers may have difficulty finding a suitable wage and salary job. The greater flexibility afforded by self-employment has been advanced as an important part of the explanation for the high rate of self-employment at older ages. Research suggests that employer reluctance to hire older workers also may play a role.
Owing to data limitations, research and policy discussions typically have treated self-employment as a homogeneous category or made only the crude distinction between incorporated and unincorporated self-employment. Yet, self-employment may take a variety of forms, including owning a business that involves a significant capital investment and managing a payroll; working as an independent contractor, independent consultant, or freelancer for one or more clients; and doing occasional informal work through a mobile app or online platform for businesses or consumers.
These diverse types of self-employment, in turn, may vary in the flexibility in hours worked, the type of work performed, and the ease of transitioning into the arrangement. For example, for someone who has been working in a wage and salary job, work as an independent consultant, independent contractor, or freelancer (possibly including work via a mobile app or online platform) may offer a way to control work hours or the types of tasks performed. In some cases, this may involve working for a former employer as part of a gradual, or phased, retirement. Someone who already has an established business may find it easier than other workers to reduce work hours. In contrast, starting a new business may well require a significant upfront investment and involve an increase, not a decrease, in work effort.
In addition, although policy has focused on older Americans' financial need for continued employment, the reasons individuals choose to work at older ages are diverse. In some cases, financial necessity is the primary driver; in other cases, motivations such as the desire to stay active, connect with others, or pursue a hobby are more important. Understanding why seniors work, and why the majority who do work are self-employed, requires more detailed information than typically is available in standard data sets such as the Current Population Survey (CPS).
This study uses data from a module we developed for inclusion on the Gallup Education Consumer Pulse Survey to examine self-employment arrangements among older Americans. The module, designed to capture all work for pay, comprises 14 questions on respondents' employment and the nature of their work arrangements, including contract and informal work. For independent contractors aged 50 and older, we asked additional questions about that work, including whether respondents were working for a former employer and their primary motivations for being in an independent contractor arrangement. The survey module was fielded during 4 month-long periods, spaced at 3-month intervals, during 2018 and early 2019. It yielded responses from approximately 61,000 adults, of whom approximately 40,000 were aged 50 and older.
The paper begins with a brief overview of the existing literature on self-employment at older ages. Next, we describe the Gallup module on contract work. Our analysis of the Gallup data provides new evidence on the prevalence of different types of self-employment at older ages, the characteristics of those working under different arrangements, and, for independent contractors, their motivations for engaging in this work. Our analysis points to the importance of independent contractor work at older ages and suggests that differences in opportunities for such work help to explain the lower employment rates of the less educated at older ages.
1. Background
Self-employment historically has offered some workers an attractive alternative to wage and salary employment. Many entrepreneurs appear to value being their own boss and prefer self-employment to a wage and salary job, even if that means sacrificing some earnings (Hamilton, Reference Hamilton2000; Hurst and Pugsley, Reference Hurst and Pugsley2011). Data from the 2017 Contingent Worker Supplement (CWS) to the CPS show that nearly 80% of those categorized as independent contractors preferred that arrangement to a conventional wage-and-salary job (Bureau of Labor Statistics, 2018a).
In other cases, however, poor opportunities in the wage and salary market may drive the decision to become self-employed. Studies using individual-level data have found that individuals who earned low wages, changed jobs frequently, were unemployed, or had been unemployed for a longer period were more likely to become self-employed (Evans and Leighton, Reference Evans and Leighton1989; Alba-Ramirez, Reference Alba-Ramirez1994). Whereas incorporated self-employment is pro-cyclical, unincorporated self-employment is counter-cyclical, with larger numbers of people entering into unincorporated self-employment when the labor market is weak (Levine and Rubinstein, Reference Levine and Rubinstein2018). For many, then, self-employment may be a fallback option rather than a preferred work arrangement.
These findings point to the importance of recognizing the considerable heterogeneity among the self-employed. They include not only business owners who may employ others to work for them, but also independent contractors operating as sole proprietors as well as day laborers, online platform workers, and others who do informal work for pay (see, e.g., Abraham et al., Reference Abraham, Haltiwanger, Sandusky and Spletzer2018a). In some of these cases, self-employment is a full-time job; in other cases, it is part-time, casual, or intermittent. Evidence based on surveys designed specifically to capture informal work suggests that a significant share of the population engages in such activity (see, e.g., Robles and McGee, Reference Robles and McGee2016; Abraham and Houseman, Reference Abraham and Houseman2019; Bracha and Burke, Reference Bracha and Burke2019). Other research shows that self-employment often supplements income from a primary wage and salary job (see, e.g., Abraham et al., Reference Abraham, Haltiwanger, Sandusky and Spletzer2018a, Reference Abraham, Haltiwanger, Sandusky and Spletzer2018b; Farrell et al., Reference Farrell, Greig and Hamoudi2018; Koustas, Reference Koustas2018; Collins et al., Reference Collins, Garin, Jackson, Koustas and Payne2019).
Life-cycle considerations would lead one to expect that the motivations for employment and the forms of employment chosen might vary with age. Based on a finding that many older workers earn comparatively low wages, Haider and Loughran (Reference Haider, Loughran, Christensen and Schneider2010) suggest that making money is not the only motivation for continuing to work at older ages. There is also ample evidence, however, that many older adults lack adequate savings for retirement, so that income from continuing to work is important for their financial security. The exact numbers vary depending on researchers' specific modeling assumptions, but a reasonable estimate is that 40–50% of those in their early 60s have not saved enough to maintain their standard of living in retirement without running out of money (see, e.g., Pang and Warshawsky, Reference Pang and Warshawsky2013; Munnell et al., Reference Munnell, Hou and Sanzenbacher2018; VanDerhei, Reference VanDerhei2019). Further, the share in this situation is higher among those with lower levels of education (Pang and Warshawsky, Reference Pang and Warshawsky2013) and lower pre-retirement incomes (Munnell et al., Reference Munnell, Hou and Sanzenbacher2018; VanDerhei, Reference VanDerhei2019). Working even a few extra years could go a long ways toward closing the identified retirement savings gaps, but even after controlling for health and other factors that might affect work behavior, those with less education are significantly less likely to anticipate working long enough to reach the necessary target savings level (Munnell et al., Reference Munnell, Webb and Chen2016).
An extensive literature on ‘partial retirement’ or ‘bridge jobs’ has found that it is common for older adults to transition from full-time work to part-time work before retiring fully (see, e.g., Gustman and Steinmeier, Reference Gustman and Steinmeier1984; Ruhm Reference Ruhm1990; Giandrea et al., Reference Giandrea, Cahill and Quinn2009). Similarly, a significant share of retirees later ‘unretire’ and move back into the labor force, frequently taking part-time rather than full-time jobs (Maestas, Reference Maestas2010).
Many employers do not offer employees nearing retirement age the option to reduce their hours on their current job. Citing data from the first five waves of the Health and Retirement Study (HRS), Abraham and Houseman (Reference Abraham, Houseman, Clark and Mitchell2005) report that few older employees believed their employer would allow them to reduce their hours on their current job. Matos et al. (Reference Matos, Galinsky and Bond2017) summarize responses to a 2016 survey of human resource directors from a nationally representative sample of firms with 50 or more employees. Although 59% said that the organization would allow some employees to phase into retirement by working reduced hours for some period prior to full retirement, only 21% said that the organization would allow all or most employees to do so.
When phased retirement on an older worker's current job is not an option, it also may be difficult for her to find another suitable job that offers part-time hours. Many employers appear to be generally reluctant to hire older workers, whether because of concerns about high health insurance costs, unwarranted stereotyping, or more legitimate concerns related to these workers' skills and low perceived returns to training (Abraham and Houseman, Reference Abraham, Houseman, Clark and Mitchell2005, Reference Abraham, Houseman, Bartik and Houseman2008). In audit studies that involved sending pairs of résumés to employers recruiting for entry-level positions, Bendick et al. (Reference Bendick, Jackson and Horacio Romero1996) and Lahey (Reference Lahey2008) find that, all else the same, older applicants were less likely to receive favorable responses from employers; using a similar strategy, Neumark et al. (Reference Neumark, Burn and Button2019) find that older female applicants were particularly disadvantaged. In another study, Maestas and Li (Reference Maestas and Li2006) find that fewer than half of non-working HRS respondents who reported that they were searching for work were employed 2 years later. Interestingly, those searching for part-time work were more than 15 percentage points less likely to be working 2 years later than those seeking or willing to accept full-time work.
Self-employment at older ages is of particular interest because it may provide a viable path for older workers to keep working but cut back on their hours rather than continue with full-time work or withdraw entirely from the labor force (see, e.g., Quinn, Reference Quinn1980; Fuchs, Reference Fuchs1982). Using HRS data, Zissimopoulos and Karoly (Reference Zissimopoulos and Karoly2007) find far higher rates of transition from full-time work to part-time work among individuals who were initially self-employed than among those who initially held a wage and salary job. Ameriks et al. (Reference Ameriks, Briggs, Caplin, Lee, Shapiro and Tonetti2018) report that, among those in their sample who took a bridge job at the end of their careers, self-employment was substantially more common on the bridge job than on the career job. Consistent with the idea that older workers use self-employment as a way to keep working but cut back on their hours, Ramnath et al. (Reference Ramnath, Shoven and Slavov2017) find that late-career transitions to self-employment observed in tax data are associated with significantly larger earnings reductions than mid-career transitions.
Recent years have seen growing discussion of the so-called gig economy, including the emergence of mobile apps and online platforms, such as Uber, Lyft, TaskRabbit, and Upwork, that match workers to customers with a need to have a specific task performed (see, e.g., Abraham, et al., Reference Abraham, Haltiwanger, Sandusky and Spletzer2018a, Reference Abraham, Haltiwanger, Sandusky and Spletzer2018b, Reference Abraham, Haltiwanger, Sandusky and Spletzer2019; Abraham, Hershbein and Houseman, Reference Abraham, Hershbein and Houseman2019; Farrell et al., Reference Farrell, Greig and Hamoudi2018; Collins et al., Reference Collins, Garin, Jackson, Koustas and Payne2019). Prior research has found that older adults are less likely to participate in work mediated through mobile apps and online platforms (Farrell et al., Reference Farrell, Greig and Hamoudi2018; Collins et al., Reference Collins, Garin, Jackson, Koustas and Payne2019). At least in principle, however, such employment could be particularly attractive to older workers who do not require employer-provided health insurance or other employee benefits and who place a high value on flexibility in their hours of work. If so, their participation in online platform work may grow over time, potentially increasing employment at older ages.
2. Gallup contract work module
To learn more about self-employment among older Americans, we have collected new data on a module fielded as part of the Gallup Education Consumer Pulse Survey, a large, nationally representative telephone survey. The target population for the Gallup Education Consumer Pulse Survey is adults aged 18–64, but during the periods that our survey module was in the field, Gallup also administered the employment and core demographic questions to individuals aged 65–80.
Similar to the CPS, the Gallup Education Consumer Pulse Survey collects employment information for a specified week (the 7 days preceding the interview). It includes a standard battery of questions on respondents' employment status used in other Gallup surveys. This battery begins by asking about work for an employer during the reference week. If the respondent reports having done such work, she is asked the number of hours worked for an employer during a typical week (across all employers if more than one). The respondent then is asked about self-employment work activities and, if applicable, usual hours worked per week in self-employment.
Our Contract Work module consists of 14 questions about respondents' employment and work arrangements that were interspersed, as appropriate, among the standard employment questions in the Gallup survey. We randomly varied the wording for selected questions in order to test how alternative phrasings affected responses; Abraham, Hershbein and Houseman (Reference Abraham, Hershbein and Houseman2019) discuss the process of developing the survey questionnaire and the effects of question wording. The text of questions relevant for this paper can be found in online Appendix A. In most cases, the responses to the two question versions we tested were similar and the estimates reported here are pooled responses.
The standard question about work for an employer on the Gallup survey reads as follows:
Thinking about your WORK SITUATION over the past 7 days, have you been employed by an employer – even minimally like for an hour or more – from whom you receive money or goods? (This could be for one or more employers.)
Someone doing work for a company on contract basis might reasonably answer ‘yes’ to this question. To learn whether miscoding of workers as employees is a significant problem in the Gallup survey, we asked everyone answering ‘yes’ one of two follow-up questions that further probed whether the person was in fact an independent contractor, independent consultant, or freelance worker rather than an employee. The first version asked about this directly; the other identified independent contractors by asking whether the employer took any taxes out of the respondent's pay.
The standard Gallup question about self-employment asks:
Again, thinking about the last 7 days, were you self-employed, even minimally like for an hour or more? This means working for yourself, freelancing, or doing contract work, OR working for your own or your family's business.
Self-employment also includes fishing, doing farm work, or raising livestock for either your own or your family's ranch.
Although this question normally is not asked of respondents who report working for an employer 30 or more hours per week, we asked it of all respondents in our module sample. The emphasis on reporting work of as little as an hour during the reference week and explicit mention of freelance and contract work likely mean this question captures self-employment work more fully than, for example, the standard CPS employment questions. We also asked everyone reporting self-employment activity whether any of that work was done as an independent contractor, independent consultant, or freelance worker. This allowed us to distinguish those workers from other self-employed workers. To avoid possible double counting of contract work done by those who initially said they had worked for an employer, we asked relevant respondents whether any of the self-employment work they had done in the last 7 days was work they had already reported and analyzed the data accordingly.
The questions about both work for an employer and self-employment were followed by questions about hours devoted to that work. To capture any informal work that might have been missed by the standard employment questions, we then asked all respondents whether there was anything else they had done in the last 7 days for which they had received or expected to receive payment. The two versions of this question differed with regard to whether the basic question was augmented with specific examples.Footnote 1 If respondents reported doing additional work for pay, they were asked the number of hours spent on such activities in a typical week.
The last general questions about work activity on the survey module pertained to work obtained through online intermediaries, intended to capture the use of mobile apps and websites such as Uber, Lyft, TaskRabbit, and Upwork. These questions were asked of everyone reporting any type of non-employee work, including miscoded employees. In the first two waves of the Gallup survey, we asked whether the person had connected directly with new customers or clients through a mobile app or online platform, with examples of the types of work someone might have obtained through these channels provided to half of respondents. In reviewing the data from these first two waves, we noticed that positive responses to this question were much higher than existing estimates of such work (Farrell et al., Reference Farrell, Greig and Hamoudi2018; Bureau of Labor Statistics, 2018b) – indeed, too high to be plausible. This raised a question about whether respondents had understood what we were asking.Footnote 2 To reduce possible confusion, for the third and fourth waves we added a question that asked anyone who reported connecting with new customers or clients directly through a mobile app or online platform whether they also were paid through the app or platform. For this paper, we measure app or platform work based on respondents in the third and fourth waves who said both that they connected with new customers or clients through a mobile app or online platform and that they were paid through the app or platform.
All questions just described, together with some questions designed to identify individuals whose employers contracted their services out to other companies, were asked of respondents of all ages. The module also included questions designed to provide a more comprehensive picture of independent contractor work at older ages. These questions were asked for workers aged 50 and older identified as independent contractors, independent consultants, or freelancers, whether they originally reported themselves as employed by an employer or as self-employed. First, we asked (through one of two question versions) whether that work was being done for a business or organization for which the person had previously been an employee. Second, we asked about the respondent's main reason for doing independent contractor work. Possible reasons were that the work was a main source of income, was a supplement to retirement income, was a supplement to income from another job, was the only type of work the person could get, allowed the person to stay active and connect with others, or allowed the person to pursue an interest or hobby.
Gallup administered the Contract Work module in four waves spread evenly across the year. The first wave was administered from mid-May through mid-June 2018, the second wave from mid-August through mid-September 2018, the third wave from mid-November through mid-December 2018, and the fourth and final wave from late February through late March 2019. The survey response rates varied from about 8% to about 10%, depending on the wave.Footnote 3 Altogether, Gallup collected approximately 500 completed responses per day, about 15,000 in each wave, and about 61,000 in total.
The core Gallup survey also collects detailed demographic information (including age, gender, race, ethnicity, and education) and data on the respondent's annual income and geography down to the ZIP code.Footnote 4 Gallup supplied survey weights constructed to match the demographic characteristics of the adult population in the relevant age range, as recorded in the most recent Annual Social and Economic Supplement to the CPS. We use the survey weights for all reported tabulations, but not for the reported regression results.
3. Findings from the Gallup survey module
As just discussed, the Gallup survey module was designed to capture all work activities done by respondents during the preceding 7 days and to provide more details on various types of self-employment than is found in the CPS and other widely-used surveys. We are able to identify not only self-employed people who report themselves as such but also people who report themselves as employees but indicate when probed that they in fact are self-employed (as an independent contractor) as well as people doing other work that they did not think to report in response to the standard Gallup employment questions. In addition, among the self-employed, we are able to distinguish independent contractors, independent consultants, and freelancers from other self-employed individuals. We also discuss non-employee work obtained through a mobile app or online platform.
3.1 Prevalence of self-employment arrangements by age
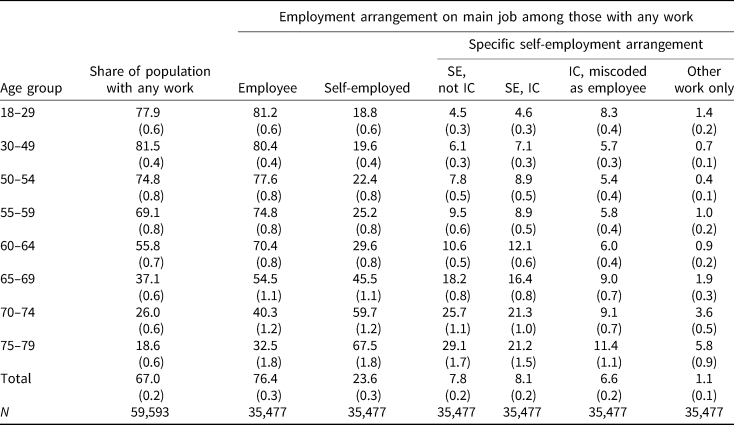
Table 1 provides a summary of the prevalence of various work activities among Gallup respondents by age group. The first column shows the percent of people who engaged in any work activity (including work for an employer, self-employment, or informal work) during the preceding week.Footnote 5 In these data, the employment rate is close to 80% for age groups 18–29 and 30–49, but then begins to drop with age, falling to 55.8% among those aged 60–64. Although the employment rate declines further at older ages, even among the oldest respondents, a significant fraction did some work for pay in the preceding week – 37.1% of those aged 65–69, 26.0% of those aged 70–74, and 18.6% of those aged 75–79.
Table 1. Share of population working and employment arrangement on main job, by age
Source: Authors' tabulations, Gallup Contract Work Module.
Note: Shares expressed as percentages. Standard errors in parentheses. SE is self-employed; IC is independent contractor. Tabulations are weighted.
The next two columns show the shares of workers whose main work activity is as an employee or through self-employment, respectively. For those with more than one job, the main job is defined based on hours worked. Conditional on working, the share whose main job is self-employment rises sharply with age, especially after age 65. The self-employment share is just under 20% for those aged 18–29 and 30–49; it rises to 29.6% for those aged 60–64, 45.5% for those aged 65–69, 59.7% for those aged 70–74 and 67.5% for those aged 75–79.
The employment arrangements shown in the final four columns are different types of self-employment – people who said they were self-employed but not independent contractors, people who said they were self-employed independent contractors, independent contractors who initially were miscoded as employees, and people who did only informal work. These breakouts provide a more detailed picture of the variety of self-employment arrangements than is available from other sources. The share of workers in each type of self-employment arrangement generally rises with age. Among workers aged 30–59, some 5–10% report themselves as self-employed but not an independent contractor, independent consultant, or freelancer. Similar shares report themselves to be self-employed independent contractors. The prevalence of both types of self-employment grows from age 60 onward. Among workers in their 70s, the share reporting that they are self-employed but not an independent contractor, independent consultant, or freelancer ranges between 25% and 30%, and the share reporting that they are a self-employed independent contractor exceeds 20%. Between the ages of 30 and 64, independent contractors miscoded as employees make up an estimated 5–6% of employed persons. That share rises to about 9% for those aged 65–74 and about 11% for those aged 75–79. Few workers between the ages of 30 and 64 – under 1% overall – report that their only employment is other informal activities. Perhaps not surprisingly, starting at the traditional retirement age of 65, that share begins to rise, to 1.9% for those aged 65–69, 3.6% for those aged 70–74 and 5.8% for those aged 75–79.
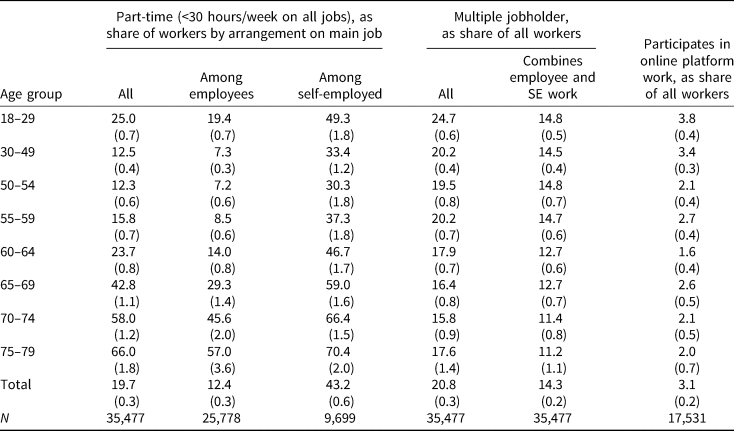
The first three columns of Table 2 display the share of workers who are part-time, defined as working less than 30 hours per week on all jobs during a usual week. This is reported for all workers and then separately by whether, on her main job, the worker is an employee or self-employed. As expected, the share working part-time rises with age, particularly after age 64. At every age, part-time work is considerably more common among the self-employed, though the gap is smaller for workers in the two oldest age groups.Footnote 6
Table 2. Selected employment characteristics by age
Source: Authors' tabulations, Gallup Contract Work Module.
Note: Shares expressed as percentages of group. Standard errors in parentheses. SE is self-employed. Last column is based on Gallup module's third and fourth waves only. Tabulations are weighted.
The next two columns of Table 2 show the share of workers who hold multiple jobs, defined as having more than one employer; combining work for an employer with self-employment; or combining work for an employer, self-employment or both with informal work activities. Multiple job holding declines with age, but is quite prevalent in the Gallup data, even among older workers. More than 10% of those still working in their 60s and 70s report combining work for one or more employers with self-employment. These rates are notably higher than the multiple-job-holding rates in the CPS.Footnote 7 Although the high rates in the Gallup data may partly reflect unobserved differences between those who responded to the Gallup survey and those responding to the CPS, other factors also likely contribute to this result. First, we asked even those who reported work as an employee explicitly about self-employment, and second, the wording of the Gallup employment questions encourages people to report even small amounts of work activity.
The growth of mobile apps and online platforms such as Uber, Lyft, and Upwork has garnered much attention in recent years. Some have speculated that these platforms may help older individuals connect with employment and remain in the workforce longer. The final column in Table 2 shows the share of workers obtaining self-employment work through mobile apps or online platforms and being paid through those apps or platforms. The share of workers reporting work through a platform or mobile app averages 3.1%; it is highest, at 3.8%, among workers under age 30, and falls somewhat with age, to between 2.0% and 2.6% for workers aged 65–79.Footnote 8 Although we have defined participation in platform work similarly to the 2017 CWS, our estimates are higher than those estimates. The CWS found that 1.0% of all workers participated in electronically mediated work, with estimated participation rates of 0.9% for workers aged 16–24 and 0.8% for workers aged 65 and older. The prevalence of platform work may have grown between the fielding of the CWS in May 2017 and the fielding of the relevant waves of the Gallup survey in late 2018 and early 2019. Another factor contributing to the differences between the two sets of estimates, however, may be that the CWS questions about platform work were asked only of those identified as employed in the basic monthly CPS. To the extent that the Gallup employment questions identify more low-hours and casual workers than the basic monthly CPS, they may have better captured platform workers.
To put our Gallup estimates into context more broadly, we have compared them to estimates based on CPS data for the months that the Gallup survey was in the field.Footnote 9 These estimates are available in online Appendix B. Employment rates in the Gallup data are very similar to those in the CPS among individuals aged 30–64, but they are about 10 percentage points higher for those aged 18–29 and 4–7 percentage points higher for those aged 65–79. The Gallup questions about work for an employer and self-employment ask specifically whether the respondent worked ‘even minimally like for an hour or more’ and thus seem likely to have captured casual work activity more fully than the corresponding CPS questions. In addition, our Gallup module asks explicitly about any informal work that the respondent may not have reported in response to the standard employment questions. The Gallup and CPS employment rates for the youngest and oldest age groups are more similar when we exclude those who report working less than 15 hours per week.Footnote 10
Another difference between the Gallup and CPS estimates is the higher prevalence of self-employment in the Gallup data. This difference arises in part because the Gallup data include as self-employed both miscoded employees and individuals doing only informal work. As shown in online Appendix B, when we exclude these groups, the Gallup self-employment estimates become closer to the CPS estimates. When we further restrict our sample to individuals working 15 or more hours per week, the self-employment prevalence rates in the two surveys are even more similar – the 9.3 percentage point difference in the self-employment rate among those 18–79 falls to 2.2 percentage points when both the low-hours and miscoded groups are excluded.Footnote 11
3.2 Age patterns of work under various alternative arrangements
To explore the age patterns of working for pay under various employment arrangements, we next estimate linear probability models of these outcomes, looking first at models fit for the population as a whole and then at models restricted to the employed. We are particularly interested in the role that education plays in the age gradient for the different types of self-employment, as well as in the prevalence of informal or online platform work. In each model we estimate, the dependent variable takes the value of one if the person belongs to the indicated employment arrangement group and zero otherwise. We regress these outcomes on interactions of the same age group indicators as in the previous tables (18–29, 30–49, and subsequent 5-year ranges) with education indicators (high school or less, some college, bachelor's, and graduate degree), as well as controls for race, gender, quintiles of ZIP-code level household poverty rates, and wave.Footnote 12 To create age profiles for the different education groups, we plot fitted values from these regressions.Footnote 13
The four panels of Figure 1 show, among those in a given age group with a given level of education, the estimated shares of the population who are in each of four mutually exclusive employment groups. The four employment groups are defined based on the arrangement on the respondent's main job (if any) – employee, excluding those who subsequently report being an independent contractor (top left); self-employed but not an independent contractor (top right); independent contractor, whether self-reported as self-employed or a miscoded employee (bottom left); and doing only informal work (bottom right). Each panel shows four age profiles, one for each of the four education categories. Online Appendix C shows these same four age profiles for the outcome of any employment at all – the vertical sum of the values from the other four outcomes.

Figure 1. Share of population employed by employment status on main job, by age and education.
Source: Authors' calculations, Gallup Contract Work Module.
Note: This figure shows fitted values from the regressions of dependent variable – an indicator for employment status on main job as shown in each panel – on age–education interactions and controls for race, gender, ZIP code poverty quintile, and wave. Values capture share of population in each status, by age group and education. IC is independent contractor. Informal work pertains to individuals who reported only informal work not captured by standard employment and self-employment questions. See text for details.
The profiles shown in the panel for ‘true’ employees are unsurprising – in every education group, the share of the population working as an employee declines with age, most sharply in the late 60s, and, until the oldest ages, more-educated individuals are more likely to be working as employees. The more interesting trends are those shown in the next three panels, which examine different types of self-employment. Note that these three panels use a different scale than that used for the employee panel in the top left. The panel for non-independent-contractor self-employment (top right) shows that the share of people in this type of arrangement grows slightly until middle age and then is relatively flat at 5–8% of the population through ages 75–79. Those with higher education are less likely at younger ages to be in this arrangement but more likely in their 60s and 70s. The panel for independent contractors (bottom left) displays a qualitatively similar pattern, but the differences across age and education groups are more pronounced. Among those with a graduate degree, the share of people working as independent contractors rises from 6% at ages 18–29 to 11% at ages 75–79. In contrast, among those with no more than a high school diploma the share of people working as independent contractors declines monotonically with age from about 11% at ages 18–29 to about 4% at ages 75–79. The last panel in Figure 1 shows the trends in the share of individuals engaged only in informal work. These rates are consistently low, on the order of 1%, but slightly higher at the youngest and oldest ages, reflecting higher rates for the more-educated at older ages and the less-educated at younger ages.
Figure 2 repeats the analysis just described but with the sample restricted to those who are working. The first panel reports the share of workers who are in employee arrangements; after age 65, that share declines steeply, especially for the more highly educated. Among those aged 30–49, workers with a graduate degree are 8 percentage points more likely to be employees than workers with a high school education or less, but after age 65, workers with a graduate degree are 5–10 percentage points less likely to be employees. The shares of workers in non-independent-contractor self-employment, shown in the top right panel, rise with age and, at most ages, are clustered relatively tightly across education groups. Among those in their 70s, rates of non-independent-contractor self-employment are lower for workers in the graduate degree group (about one-quarter) than for those in the high school group (about one-third). As shown in the bottom left panel, older workers also are more likely than younger workers to be independent contractors. Independent contractors constitute between 10% and 15% of all employment for workers in their 30s, 40s, and 50s, but this share rises rapidly for workers in their 60s and 70s. In this case, however, the growth is especially marked among more-educated older workers compared to those who did not attend college. Non-independent-contractor self-employment is the larger component of overall self-employment at older ages only for those with just a high school education; for those with at least some college, independent contractor work plays the larger role.
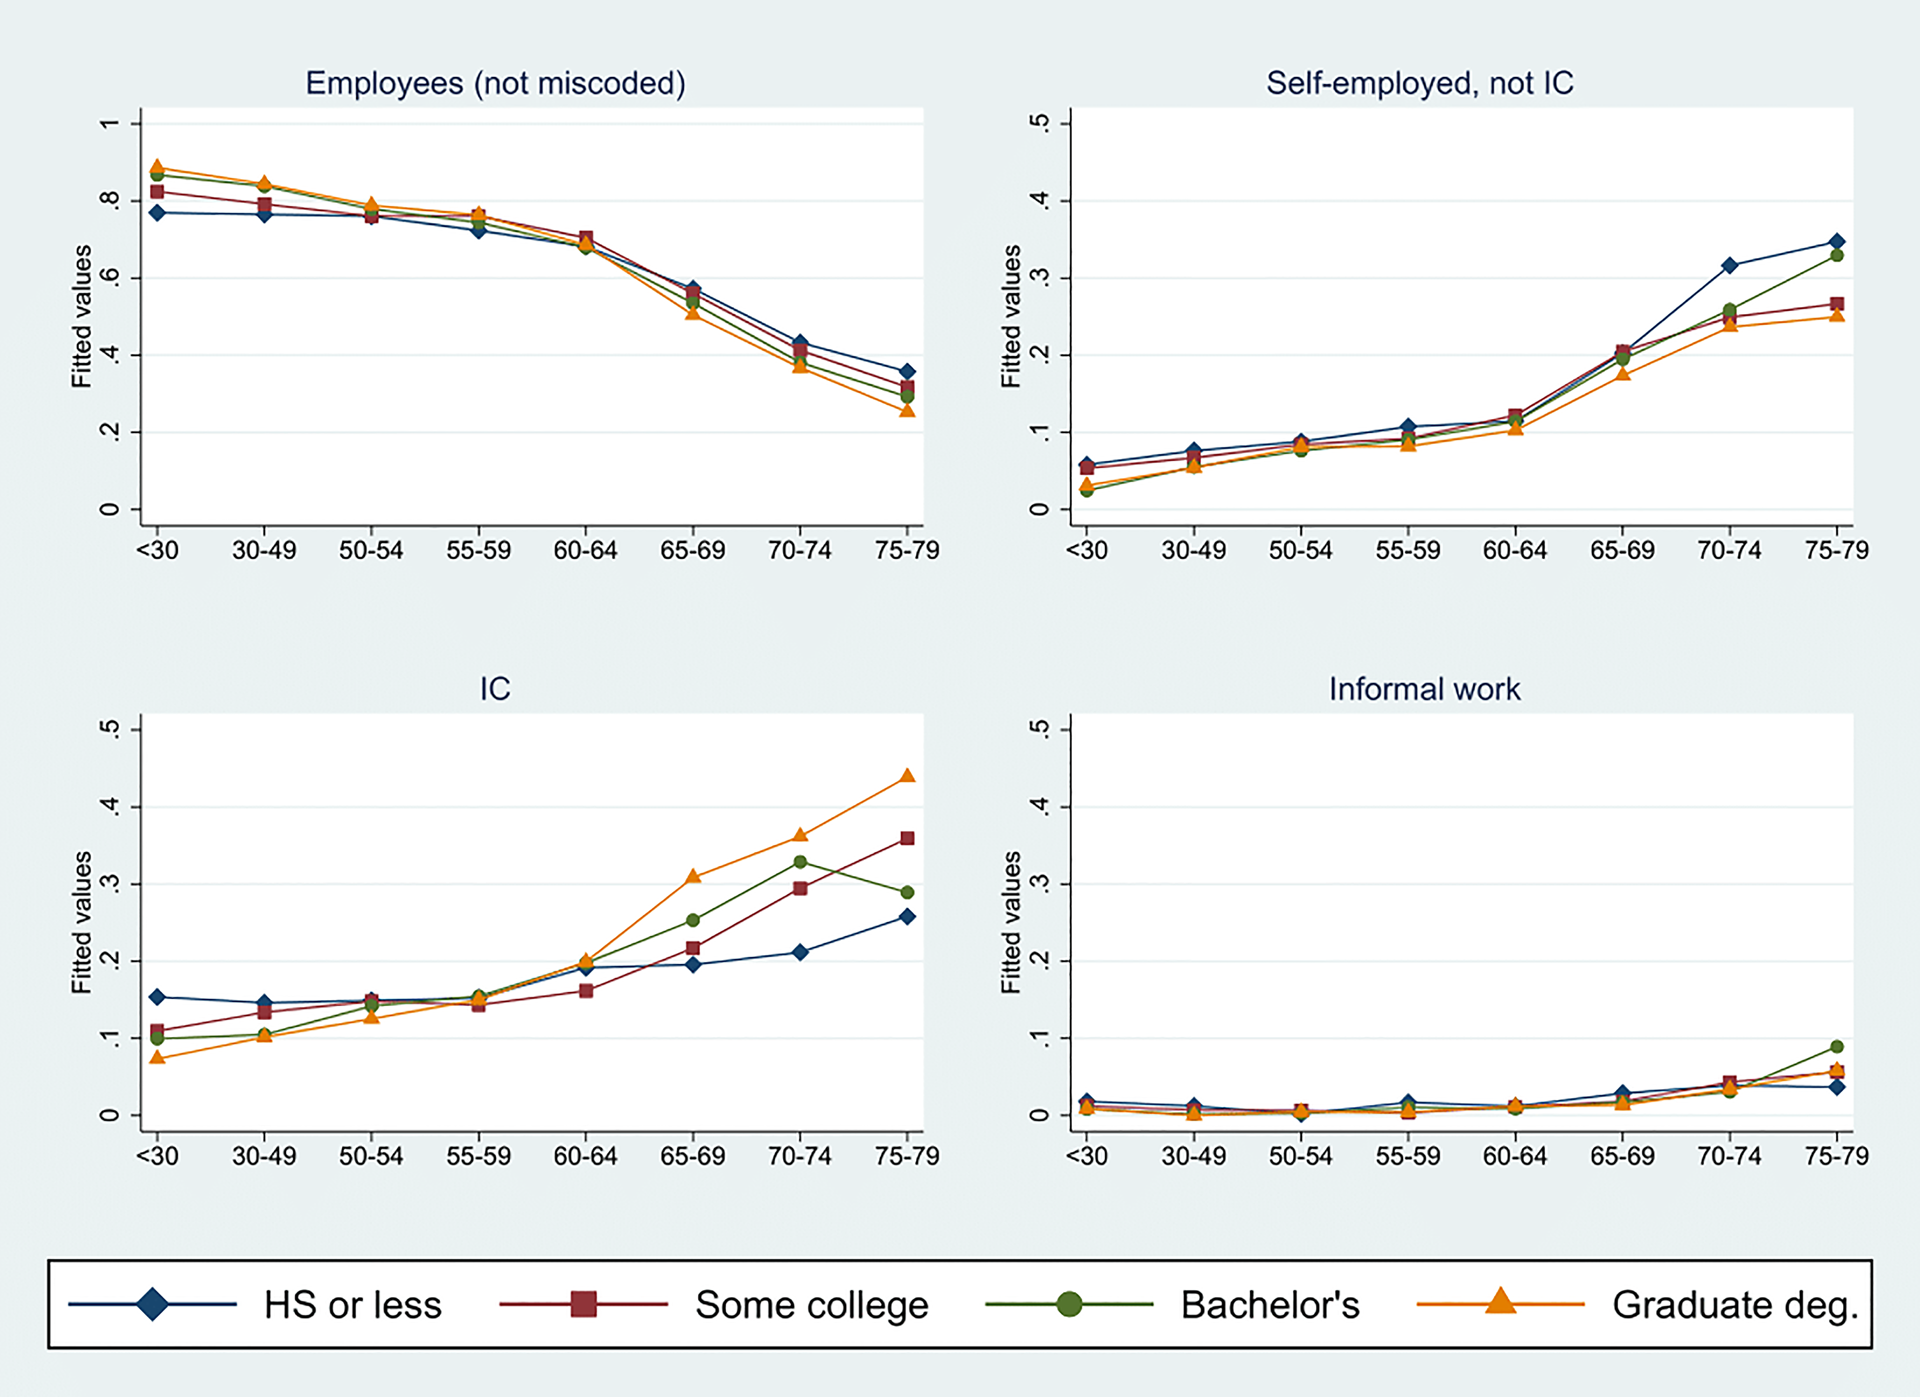
Figure 2. Share of workers by employment status on main job, by age and education.
Source: Authors' calculations, Gallup Contract Work Module.
Note: This figure shows fitted values from the regressions of dependent variable – an indicator for employment status on main job as shown in each panel, among those with some form of employment – on age–education interactions and controls for race, gender, ZIP code poverty quintile, and wave. Values capture share of employment in each status, by age group and education. IC is independent contractor. Informal work pertains to individuals who reported only informal work not captured by standard employment and self-employment questions. See text for details.
These results support two stylized facts about self-employment at older ages. First, older adults with higher levels of education are considerably more likely to be in self-employment arrangements than less-educated older adults. Second, and something not typically possible to observe in survey data, more-educated older workers' self-employment is especially likely to take the form of working as an independent contractor, whereas less-educated older workers' self-employment is more concentrated in other types of self-employment, such as traditional business ownership.
The higher incidence of independent contractor work among the highly educated relative to the less educated also accounts for much of the difference in employment rates by education at older ages. Online Appendix C, which shows the age profile of the overall employment-to-population ratios for each education level, displays the well-known fact that overall employment declines with age. It also reveals the strict ordering of employment rates by education; at every age, those with higher education levels have a higher employment rate than those with lower education levels. The numbers plotted in Figure 1 imply that for younger and middle-aged workers, differences in wage and salary employment largely account for the differences in overall employment rates across education groups. The figure also implies, however, that as the composition of work arrangements shifts toward self-employment at older ages, differences in the self-employment rate, especially independent contractor work, account for much of the difference in the employment rate across education groups.
Formal decompositions allow us to quantify the contributions of different work arrangements to the overall employment rate differences by education at different ages. Among those under age 65, differences in the rate of wage and salary employment (employees, not miscoded) account for most or all of the overall employment rate differences between highly-educated individuals (those with a bachelor's degree or more) and those with less education. In contrast, among those aged 65–79, differences in the rate of self-employment (whether as an independent contractor or in some other self-employment arrangement) account for about three-fourths of the employment rate difference between those with a bachelor's degree or more and those with some college; they also account for about two-thirds of the employment rate difference between those with a bachelor's degree or more and those with a high school degree or less. Moreover, within the self-employment category, independent contractor work accounts for the lion's share of self-employment's contribution to the differential for the 65–79 age group, representing over half of the overall differential in employment rates between those with a bachelor's degree or more and those with lower educational attainment.Footnote 14
The large differences in independent contractor activity across education groups at older ages may reflect differences in the types of work done by more- and less-educated workers, and the associated differences in the opportunities for independent contractor work. Figure 3 shows how the age profiles of the shares of workers in different employment arrangements vary by broad occupation (professional-managerial; sales and office; blue-collar; services; and farming, forestry, and fishing). In this figure, the age profiles are shown for three types of employment on the main job – employee, not miscoded; self-employed, not an independent contractor; and independent contractor.Footnote 15 Aside from farming, forestry, and fishing, which is heavily comprised of owner-operators, other occupations have a larger share of self-employment in independent contractor arrangements. The age profiles for independent contractor work, however, differ considerably across occupations. Among professional workers, who are generally highly educated, the share in independent contractor arrangements is relatively stable at a low level through age 65, but then rises sharply with age. By age 70, 40% or more of professional workers are in an independent contractor arrangement. Although the share of blue-collar workers who are in independent contractor arrangements also rises sharply starting at age 65, the overall number of workers in blue-collar occupations past age 65 is small, likely reflecting the physical demands associated with many of these jobs. For workers in services, sales, and office occupations, all groups with relatively low average educational attainment, the share who are independent contractors remains low at older ages, possibly because there are few opportunities for workers in these occupations to transition to that more flexible work arrangement.

Figure 3. Share of workers by employment status on main job, by age and occupation.
Source: Authors' calculations, Gallup Contract Work Module.
Note: This figure shows fitted values from the regressions of dependent variable – an indicator for employment status on main job as shown in each panel, among those with some form of employment other than informal work – on age–occupation group interactions and controls for race, gender, education, ZIP code poverty quintile, and wave. Values capture share of employment other than informal work in each status, by age group and occupation group. Prof/Mngr corresponds to professionals and managers (SOC codes 11–29); Services corresponds to SOC codes 31–39; Sales/Office corresponds to SOC codes 41–43; Farm corresponds to SOC codes 45; and Blue collar corresponds to SOC codes 47–53. IC is independent contractor. Informal work pertains to individuals who reported only informal work not captured by standard employment and self-employment questions. See text for details.
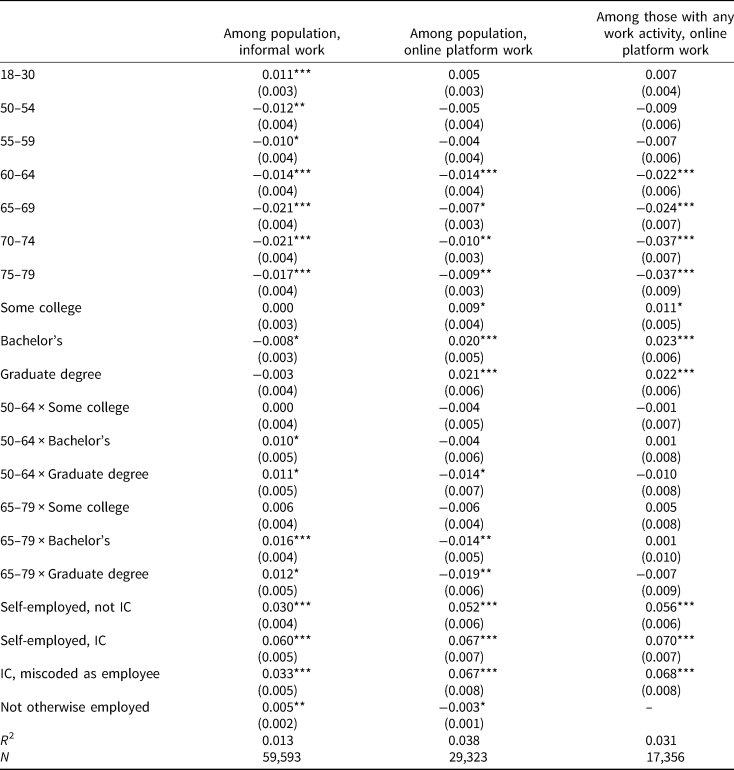
Figures 1 through 3 illustrate age trends for arrangements on the main job. We also are interested in the characteristics associated with participation in informal work, whether as a person's main job or as a supplement to other work activity, and in participation in online platform work. The first column of Table 3 reports results from a linear probability model for whether respondents engaged in any informal work in the prior 7 days. Because just 2.4% of the (unweighted) sample did so, we include a slightly smaller set of covariates in these models than were used to estimate the earlier age profiles. In addition to indicators for race, gender, ZIP code poverty quintile, and wave, the model includes age group indicators, education indicators, interactions of broad age group (50–64 and 65–79) with education, and controls for the type of main employment arrangement if any (self-employed but not an independent contractor, self-employed independent contractor, miscoded employee or no other job, with true employees the omitted group). For the less educated, there is a distinct negative age gradient to the reporting of informal work. More-educated individuals are somewhat less likely to report such work at younger ages, but the negative age gradient is much flatter for them. Consequently, more-educated older individuals are significantly more likely to have informal work than less-educated older individuals, a reversal of the pattern at younger ages. Interestingly, there is a strong positive association between being in a non-employee arrangement on the main job and reporting informal work. Those whose main job is some form of self-employment are 3–6 percentage points more likely than those who are employees, conditional on other covariates, to report informal work in the prior week.Footnote 16 These findings suggest that many of the self-employed earn money from multiple work activities.
Table 3. Correlates of having informal work or platform work
Source: Authors' estimates, Gallup Contract Work Module.
Note: Each column represents a separate regression with the indicated sample and dependent variable. Last two columns are based on Gallup module's third and fourth waves only. Respective sample means 0.024, 0.017, and 0.029. Regressions also include controls for race, gender, ZIP code poverty quintile, and wave. Robust standard errors in parentheses. Statistical significance: *p < 0.05, **p < 0.01, ***p < 0.001.
In the remaining columns of Table 3, we examine the factors associated with online platform work. The sample for the second column is all respondents and that for the third column is restricted to those with work activity in the preceding week. As with informal work, there is a negative age gradient in platform work participation that is especially pronounced when the sample is restricted to workers. Also, as with informal work, rates of participation in platform work are higher among those who are working but whose main job is not a traditional employee arrangement. Conditional on other covariates, those whose main job involves independent contractor work are 7 percentage points more likely to have used a mobile app or online platform to secure work during the prior week than are employees, and even the self-employed who are not independent contractors are 5–6 percentage points more likely to have done so.
3.3 Differences by gender in patterns of contract work
The analysis presented thus far does not consider whether and how the patterns of independent contractor work differ by gender. Online Appendix D replicates several of the tables and figures separately for men and women. As can be seen in Tables D1 and D2, which reproduce the tabulations from Table 1 separately by gender, the share of workers who are self-employed rises sharply after age 60 for both men and women, but the gradient is steeper for men. At younger ages, male and female workers have similar self-employment rates, but the gender gap in self-employment widens to 7–8 percentage points among workers in their 60s and 11–12 percentage points among workers in their 70s. Much of the widening gap is due to the larger share of older working men who are independent contractors.
Tables D3 and D4, which reproduce the tabulations from Table 2 separately by gender, show, not surprisingly, that women at every age are more likely to work part-time than men. Up to age 60, however, this differential is especially apparent among the self-employed. Self-employment may provide a means for some working women to control their hours during years when that flexibility is especially valued (Booth and Van Ours, Reference Booth and van Ours2008). Starting around age 60, however, the share of self-employed men who work part-time increases sharply and the gender gap in the share of self-employment that is part-time shrinks. Consistent with their higher part-time rates, working women are less likely to have multiple jobs and to combine self-employment with other work, though the gender differences in these outcomes are smaller than the gender difference in part-time work.
Online Appendix Figures D1–D4, which replicate Figures 1 and 2 separately by gender, show employment profiles by age and education. Educated individuals of both genders are substantially more likely to be working at every age. As is true in the aggregate, in both groups, the differences in employment rates between those with a bachelor's degree or higher and those with lower education are due primarily to higher rates of wage and salary work at younger ages; at older ages, however, the differences are primarily due to higher rates of independent contractor work. Consistent with that pattern, self-employment generally and work as an independent contractor specifically account for rising shares of both men's and women's employment at older ages. Work as an independent contractor plays an especially important role for the most highly educated men and women.
3.4 Why older workers are in independent contractor arrangements
Given the importance of independent contractor work at older ages, we are interested in how older adults end up doing such work and their motivations for doing it. To learn about pathways and motivations, we asked independent contractors aged 50 and older whether they ever had been an employee at the firm where they were now doing independent contractor work and their main reason for working as an independent contractor. As noted earlier, there are two ways that respondents to the Gallup module may be identified as independent contractors. First, a person may report working for an employer, but with further probing indicate that she is actually an independent contractor, not an employee. Second, a person may report being self-employed and then indicate that she is an independent contractor, independent consultant, or freelance worker.
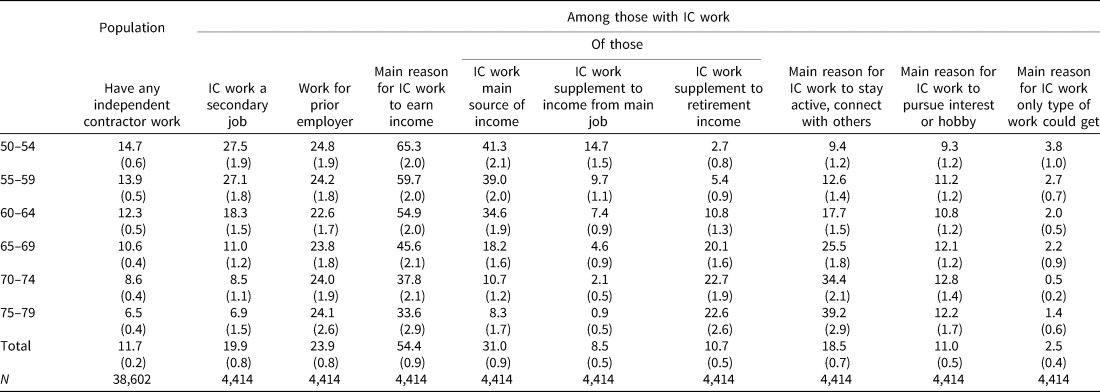
Table 4 summarizes the responses to the added questions about independent contractor work by 5-year age group from age 50 onward. The first column shows the percentage of respondents who report any work as an independent contractor, either as a main job or as a secondary work activity. This rate falls steadily with age from 14.7% among those aged 50–54 to 6.5% among those aged 75–79. For most of these independent contractors, that work is the respondent's main job. As shown in the second column, independent contractor work is a secondary activity for 27.5% of those with such work in their early 50s, declining to just 6.9% for those with such work in their late 70s.
Table 4. Incidence of and reasons for independent contractor work, by age
Source: Authors' tabulations, Gallup Contract Work Module.
Note: Sample persons age 50–79. Shares expressed as percentages. Main reasons are mutually exclusive but do not sum to 100 due to a catchall ‘other’ reason and some nonresponse; the specific reasons for earning income specified in columns five through seven similarly do not sum to total who gave earning income as main reason for IC work. Standard errors in parentheses. IC is independent contractor. Tabulations are weighted.
A sizable share of those with independent contractor work – between 23% and 25% for each age group past age 50 – report working for a former employer. Our data cannot shed light on the important question of whether this transition reflects employer or employee preferences. In some cases, it may represent an employer seeking to shed the responsibilities associated with having an employee. In other cases, the move to independent contractor status may be a way to accommodate an employee's desire for a more flexible work schedule.
The remaining columns of Table 4 report information on the reasons these workers are in independent contractor arrangements. Given policy interest in independent contractor work as a mechanism for helping older individuals meet financial needs later in life, it is striking how the share of independent contractors who report earning income as the main reason for this work declines with age. As shown in the fourth column, about two-thirds of those aged 50–54 who are doing independent contractor work report earning income as the main reason, but this share falls to under half for those aged 65–69 and to about one-third for those aged 70–79. In contrast, staying active and connecting with others become more important as a reason for independent contractor work with age.Footnote 17 As would be expected, the share who indicates that independent contractor work is their main source of income or supplements income from a main job falls with age while the share indicating that independent contractor work supplements retirement income rises.
To explore whether the motivation for work as an independent contractor differs between men and women, we show the statistics reported in Table 4 separately by gender in online Appendix Tables D5 and D6. Prior to age 65, men are 6–10 percentage points more likely than women to say their main reason for working as an independent contractor is to earn money, but that gap shrinks at older ages, as both become more likely to give other reasons for independent contractor work.
In Table 5, to better understand the circumstances and motivations of older independent contractors, we estimate linear probability models to explore the factors associated with working for a former employer and working primarily to earn income. These models include age group indicators, education indicators, interactions of an indicator for being aged 65–79 with education, and an indicator for having been a miscoded employee, together with controls for race, gender, ZIP code poverty quintile, and wave. Perhaps not surprisingly, as shown in the first column, independent contractors who initially reported working for an employer (and so were miscoded as employees) are about 15 percentage points more likely than those who reported being self-employed to work for a former employer. As can be seen in the second column, miscoded employees also are significantly more likely (6 percentage points) to report earning income as their main reason for being in an independent contractor arrangement. As suggested by the tabulations in the prior table, conditional on having independent contractor work, there is no association between age and working for a prior employer, and the probability of reporting income as the main reason for this work declines with age. Interestingly, there is no apparent association between education and the probability of working either for a former employer or as an independent contractor to earn money.
Table 5. Correlates of ICs working for prior employer or working primarily to earn money

Source: Authors' estimates, Gallup Contract Work Module.
Note: Sample persons age 50–79 reporting independent contract work. Each column represents a separate regression with the indicated dependent variable. Regressions also include controls for race, gender, ZIP code poverty quintile, and wave. Robust standard errors in parentheses. Statistical significance: *p < 0.05, **p < 0.01, ***p < 0.001.
4. Discussion
The rate of self-employment among those who are working rises sharply with age. Given considerable concerns among policymakers about the adequacy of retirement savings and the resulting policy interest in increasing employment among older Americans, it is important to understand the incidence of various types of self-employment work and the factors that influence seniors' engagement in them. Findings from the Gallup module data provide several insights into these issues and suggest areas for future research.
First, the Gallup data suggest that the incidence of self-employment may be even higher than is measured in standard household surveys. While it is possible that the respondents to the Gallup survey are unrepresentative of the population in unobserved ways such that they are more likely to be self-employed, at least two other factors appear to contribute to the higher self-employment rates in the Gallup module. First, responses to the module questions suggest that a sizable share of workers at all ages are independent contractors but miscoded as employees. Second, the Gallup module questions are designed to capture low-hours work that may be missed in other surveys such as the CPS. To the extent that standard surveys are miscoding independent contractors as wage and salary workers or missing some low-hours work (or both), the resulting estimates of the prevalence of and trends in self-employment could be misleading, especially for older workers.
Additionally, the data from the Gallup module point to the importance of independent contracting among older workers. Even without accounting for independent contractors who are miscoded as employees, they indicate that independent contractor work is as prevalent as other types of self-employment; with the inclusion of miscoded employees, independent contractor work is considerably more prevalent than other types of self-employment. Work for a former employer is an important component of independent contractor work among older workers; about one-quarter of independent contractors aged 50 and older report having previously worked for their client as an employee. Whether the implied change in employment arrangement from employee to independent contractor is driven primarily by employers' preferences or by workers' desire for greater flexibility warrants further exploration. Additionally, a significant minority of those aged 65 and older (2–6%) report informal work as their only form of employment. Informal work tends to be associated with low and sporadic hours and so is especially apt to be missed in other surveys.
The data from the Gallup module also underscore the importance of self-employment as a secondary work activity among older workers. Although highest at younger ages, multiple-job-holding rates remain quite high among workers aged 50 and older (between 15% and 20% of workers). The high rate of multiple-job holding in the Gallup data likely reflects, at least in part, the survey's ability to capture all types of work activity, including low-hours work. A majority of multiple-job holders combine wage and salary work with self-employment, a phenomenon we plan to explore in future work.
Online platform work has garnered considerable attention in recent years as a potential source of work for older Americans. Although the incidence of online platform work in the Gallup data is higher than that found in the 2017 CWS fielded by BLS, only a few percent of workers say they do such work and its prevalence is even lower among older workers. Nevertheless, the prevalence of platform work at older ages may grow over time, and this will be important to monitor.
Among the most robust findings from our analysis is the strong positive association at older ages between education and self-employment, particularly independent contractor work. At all ages, the highly educated are more likely than those with less education to be employed. At older ages, differences in the prevalence of independent contractor work account for a large share of that gap in employment rates. Our analysis provides suggestive evidence that, among seniors, the differential rates of independent contracting across education groups may reflect differential access to this type of work. Professional and managerial workers have high levels of educational attainment compared to other occupational groups, and the share of those in this occupational category in independent contractor arrangements rises sharply starting at age 65. In contrast, for lower-education occupations such as sales, office, and services, the share in independent contractor arrangements remains flat at older ages. To the extent that financial circumstances compel Americans to work later in life, any impediments to independent contractor work they face – and whether these might be addressed with training, improved access to technology, or other measures – warrant further study.
Supplementary material
The supplementary material for this article can be found at https://doi.org/10.1017/S1474747220000098.
Acknowledgement
The research reported herein was performed pursuant to grant RDR18000003 from the US Social Security Administration (SSA) funded as part of the Retirement and Disability Research Consortium. The opinions and conclusions expressed are solely those of the author(s) and do not represent the opinions or policy of SSA, any agency of the Federal Government, or NBER. Neither the United States Government nor any agency thereof, nor any of their employees, makes any warranty, express or implied, or assumes any legal liability or responsibility for the accuracy, completeness, or usefulness of the contents of this report. Reference herein to any specific commercial product, process or service by trade name, trademark, manufacturer, or otherwise does not necessarily constitute or imply endorsement, recommendation, or favoring by the United States Government or any agency thereof. The Ewing Marion Kauffman Foundation, the Russell Sage Foundation, the Kellogg Foundation, and the Sloan Foundation provided additional support for this project. We thank Joe Daly, Jeff Jones, Stephanie Marken, and Jonathan Rothwell at Gallup for assistance with implementing the survey module on which many of the results we report are based and with understanding details of the underlying Education Consumer Pulse Survey. We also thank Lillian Petrovic for outstanding research assistance.


