INTRODUCTION
Although there are well-understood mechanisms by which permanent and perfectly understood changes in the rate of inflation can have real effects, most conventional thinking holds that these effects cannot plausibly be regarded as empirically very important.1
For instance, the Mundell-Tobin effect provides a mechanism by which increases in the rate of inflation cause agents to shift their portfolio allocations away from holdings of real balances and into capital investments. This promotes long-run real activity. Alternatively, cash-in-advance models with variable labor supply (Cooley and Hansen, 1989), or with investment subject to a cash-in-advance constraint (Stockman, 1981), have the feature that inflation acts like a tax on labor supply, or investment, so that increases in inflation are detrimental to real activity. But it is commonly held that the effects generated via such mechanisms are relatively small.
Going beyond the results of Bullard and Keating, there is now substantial work indicating that the empirical relationship between inflation and real activity is characterized by nonlinearities and by the existence of thresholds. Using panel data, Fischer (1993) noted the existence of a positive relationship between long-run growth and inflation at low rates of inflation, and a negative one as inflation rose. Following Fischer (1993), there have been a number of formal empirical attempts to identify threshold effects in the inflation-growth relationship. These include, for example, papers by Sarel (1996), Ghosh and Phillips (1998), Bruno and Easterly (1998), and Khan and Senhadji (2001). These studies generally find that for economies with initially low rates of inflation, modest increases in the rate of inflation have little effect on long-run rates of real growth. But for economies with initially high rates of inflation, further increases in the inflation rate have adverse effects on real growth. In the most recent study of this issue, Khan and Senhadji (2001) find that the threshold rate of inflation is fairly low—around 1–3 percent for industrial countries, and 7–11 percent for developing countries. These results certainly have considerable significance for the conduct of economic policy. Basically, they suggest that governments should adopt a low positive inflation rate policy.
The empirical evidence, particularly that based on time-averaged data, seems to suggest that even permanent and predictable changes in the rate of inflation have real effects.2
Note, however, that it is difficult to disentangle the effects of the level of inflation from the effects of its variability, as they are highly correlated in the data. Indeed, for most samples, the correlation coefficient between the average rate of inflation and the standard deviation of inflation is quite high. This high correlation makes it virtually impossible to be sure whether it is the level of inflation, inflation variability, or some combination of the two that matters for growth performance.
In this paper, we pursue the idea that the real effects of inflation derive from the consequences of inflation for financial market conditions. There are good reasons to think so. First, there is now both empirical and theoretical literature suggesting that financial markets play an important role in the growth process.3
Thus, if changes in the rate of inflation do affect activity in financial markets, it is likely that such changes also would have implications for long-run real activity. Second, there also is both theoretical and empirical literature suggesting that increases in the rate of inflation can adversely affect financial market conditions. Moreover, this literature explains why the effects of increases in the rate of inflation might be very different at initially low versus initially high rates of inflation.Although, as discussed earlier, there has been considerable theoretical analysis of the inflation and financial depth link, empirical evidence is remarkably scarce. Indeed, the only related empirical study is by Boyd, Levine, and Smith (2001), who examine time-averaged data on bank credit extension to the private sector, the volume of bank liabilities outstanding, stock market capitalization and trading volume (all as ratios to GDP), and inflation for a cross-country sample. The empirical model they specify relates the various measures of financial depth to inflation and a set of control variables. The authors find that, increases in the annual rate of inflation above 15 percent lead to markedly lower volumes of bank lending to the private sector, lower levels of bank liabilities outstanding, and significantly reduced levels of stock market capitalization and trading volume. They also find that a given percentage point increase in the rate of inflation has a much larger effect on financial development at low than at high rates of inflation. In addition, they obtain similar results using nonoverlapping panels of data averaged over five-year intervals.
However, Boyd, Levine, and Smith do not explicitly test for the presence of threshold effects in the inflation-financial depth relationship. Nor do their results easily permit a comparison with the empirical findings on the links between long-run inflation and long-run growth. The purpose of this paper is to test for this nonlinear relationship between inflation and financial depth for a large cross-country sample utilizing new econometric methods for threshold estimation and inference developed recently by Chan and Tsay (1998) and Hansen (1999, 2000).
We start by reviewing briefly the theoretical literature on the relationship between inflation, financial depth, and growth. The remainder of the paper is then devoted to exploring the empirical plausibility of the inflation-financial market link as an explanation of the relationship between inflation and real activity. In order to explore this link, we consider several measures of financial market activity. These include bank lending to the private sector, measures that aggregate both bank lending and stock market activity, and measures that aggregate bank lending, stock markets, and bond markets.
With respect to all of these measures, we find that there are significant threshold effects in the relationship between inflation and financial market performance. For rates of inflation below the threshold, modest increases in the rate of inflation either have no significant effect on financial market conditions, or have small positive effects on the level of financial activity. The latter finding is consistent with two other results: that increases in financial depth have positive long-run real effects, and that—at low initial rates of inflation—modest increases in the rate of inflation can have positive real effects. However, for rates of inflation above the threshold level, further increases in the rate of inflation have strongly negative effects on financial development. Given what is known about the relationship between financial markets and growth, it is then not surprising that sufficiently high rates of inflation are detrimental to growth. Finally, we find that the thresholds in the inflation-financial depth relationship range from 3 to 6 percent. Such thresholds are quite consistent with existing estimates of thresholds in the inflation-growth relationship. Thus, the relationship between inflation and financial markets appears to provide an empirically plausible explanation of the observed relationship between inflation and real growth.
INFLATION AND FINANCIAL DEPTH: SOME THEORETICAL CONSIDERATIONS
As we have said, there is now considerable evidence that inflation—even secular and, presumably, predictable inflation—has adverse effects on an economy's long-run level of real activity. But why should changes in the inflationary environment that have come to be reflected in agents' expectations have any long-run real effects whatsoever? The purpose of this section is to review some theoretical answers that have been proposed to this question.
It is empirically well established that there are very strong correlations between various measures of an economy's financial depth and its long-run real activity, as reflected in either its long-run rate of growth or its level of production. This is true both for measures of banking activity, and for measures of stock market development. King and Levine (1993a, b) and Beck, Levine, and Loayza (2000), for example, demonstrate that measures of both bank lending to the private sector, and measures of bank liabilities outstanding, are strongly positively correlated with an economy's level of real production, and with its real rate of growth. Indeed, King and Levine (1993a, b) find that measures of banking activity are the only “robustly significant” predictors of future growth performance. Similarly, Levine and Zervos (1998) show that measures of stock market development are strongly associated with both higher levels of real activity and higher real growth rates. Although the direction of causation is difficult to establish, Beck, Levine, and Loayza (2000) purport to find evidence that causality runs from financial development to real development. Finally, Khan and Senhadji (2000), in the most recent study of this subject, find that the effect of financial development on growth is positive, although the size of the effect varies with different measures of financial development, estimation method, data frequency, and the functional form of the relationship.
In addition, there are a number of well-understood theoretical mechanisms by which financial development promotes growth. The earliest contributions (Greenwood and Jovanovic, 1990; Bencivenga and Smith, 1991) show how information acquisition by the financial system promotes the efficient allocation of investment capital, and how bank liquidity provision can alter the social composition of savings in a way that promotes both physical and human capital accumulation. Subsequent contributions (Huybens and Smith, 1999) demonstrate that secondary capital (equity) markets also should be expected to contribute to the growth process. As Hicks (1969) argued earlier, technological developments alone are inadequate to promote growth. Agents are willing to tie up resources in new technologies requiring large-scale investments only if capital markets exist that make these investments sufficiently liquid.
If inflation affects the development of the financial system, it will almost necessarily have long-run real effects. Here we briefly review some theoretical mechanisms demonstrating how even permanent and predictable changes in the rate of inflation affect the financial system and, through this channel, long-run real activity. Moreover, as we have shown, there is now considerable evidence that there are thresholds in the empirical relationship between inflation and real growth. The effects of an increase in the rate of inflation are potentially quite different depending on whether the rate of inflation is above or below some threshold level. The theories deliver the prediction that there are thresholds—possibly more than one—in the theoretical relationship between inflation and financial activity and, therefore, in the relationship between inflation and real activity.
The common theme in all of the theoretical literature is that financial market institutions arise to address endogenous frictions that are present in the process of allocating credit and investment capital. Indeed, such frictions seem essential in understanding the role of financial institutions in development: in the absence of such frictions the Modigliani-Miller Theorem would obtain, and the nature of finance would be irrelevant for allocations. Moreover, the severity of financial market frictions is itself endogenous in the models we describe. Inflation matters because it affects the severity of these frictions.
Among the frictions examined in the literature, adverse selection or moral hazard problems in credit markets have received the most attention.4
In this literature, the transmission mechanism from inflation to financial depth works as follows: increases in inflation lower long-run real rates of return on a broad class of assets (through the inflation tax on nominal balances and the imposition of the nonarbitrage condition, which yields equalization of risk-adjusted rates of return), which leads to more severe rationing of credit, reductions in financial depth.5Khan, Senhadji, and Smith (2001) show that these theoretical predictions also can be derived using alternative frictions such as costly state verification frictions in credit markets.
In these models, threshold effects arise because at low enough rates of inflation the credit market operates in a totally Walrasian way with a Mundell-Tobin effect. If the initial rate of inflation is sufficiently low, and real rates of return are sufficiently high, an increase in the rate of inflation causes agents to substitute away from cash and into investments in physical or human capital. As a result, long-run growth or real activity is stimulated.
However, if the rate of inflation is increased excessively, real returns will be driven down to the point where credit market frictions become binding. Once the rate of inflation exceeds this threshold level, further increases in inflation will lead to credit rationing, and have negative consequences on the financial system and growth. Thus, there is a critical rate of inflation. Below this threshold rate, modest increases in inflation can stimulate real activity and promote financial depth. Above this threshold rate, increases in the rate of inflation interfere with the efficient allocation of investment capital, and consequently have negative growth consequences.
DATA ISSUES
The dataset utilized in this paper includes 168 countries (comprising both industrial and developing countries) and generally covers the period 1960–1999. Data for a number of developing countries, however, have a shorter span. Because of the uneven coverage, the analysis is conducted using unbalanced panels. The data come primarily from a new financial development dataset developed by Beck, Demirguc-Kunt, and Levine (1999) and the International Financial Statistics of the International Monetary Fund. Financial depth is measured by several alternative indicators: (i) fd1: defined as domestic credit to the private sector as a share of GDP; (ii) fd2: defined as fd1 plus stock market capitalization as a share of GDP; and (iii) fd3: defined as fd2 plus private and public bond market capitalization as a share of GDP. By definition, fd3 is the most exhaustive indicator of financial depth, but is only available for advanced countries and for a shorter time span (starting 1975). By contrast, fd1 is widely available, but is a more limited proxy for financial depth.
The set of explanatory variables includes: inflation computed as the growth rate of the CPI index (πit, GDP per capita measured in 1987 PPP prices (pppgdp), the degree of openness (open) defined as exports plus imports over GDP, and the share of public consumption in GDP (cg). We include a measure of real activity to control for the fact that the level of economic development influences financial depth. Similarly, openness in goods trade may be related to openness to trade in financial services, thereby influencing the level of financial depth. And, finally, high levels of government expenditure (a variable more widely available than the government budget deficit) may affect the incentives of the government to “repress” the financial system.6
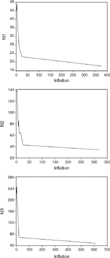
It, therefore, also represents an appropriate right-hand side variable in the regressions.Figure 1 plots the indicators fd1, fd2, and fd3 against inflation. The data have been smoothed out by reducing the full sample to ten observations. The latter are the arithmetic means of ten equal subsamples corresponding to increasing levels of inflation. The relationship between inflation and all three indicators of financial depth are remarkably similar. There is in each case a very small region over which financial depth increases with inflation. Financial depth then declines as inflation rises and then flattens out strongly suggesting a nonlinear relationship between inflation and financial depth.

Averaged relationship between inflation and financial depth. Note: The relationship between three indicators of financial depth (fd1, fd2, and fd3) and inflation. The data have been smoothed out by reducing the full sample to ten observations. The latter are the arithmetic means of five equal subsamples corresponding to increasing levels of inflation.
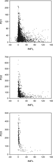
Further insights can be gathered by analyzing Figure 2 which gives the scatter plot of the three indicators of financial depth against inflation. Because very high inflation observations distort the scale of the graph and mask the most relevant range of the graph (most observations are below 100 percent), inflation rates above 100 percent have been excluded. All three plots show a clear relationship between inflation and financial depth. Furthermore, the relationship is clearly convex rather than linear (or piece-wise linear).

Scatter plot of inflation and financial depth. Note: The three panels show the scatter plot of financial depth indicators (fd1, fd2, fd3) against inflation (infl) for annual inflation rates below 100 percent.
MODEL SPECIFICATION AND ESTIMATION
To test for the existence of a threshold effect, we utilized the empirical model utilized by Boyd, Levine, and Smith (2001), which can be written as follows:

where fdit is one of the indicators of financial depth, πit is inflation based on the CPI index, π* is the threshold level of inflation,
is a dummy variable that takes a value of one for inflation levels greater than π* percent and zero otherwise,
is a vector of control variables that includes the log of pppgdp, open, cg, a time trend (trend) that captures a potential time trend in the financial development variable that is not adequately captured by the explanatory variables, and three regional dummies—a dummy for Latin American countries (d_la), a dummy variable for Asian countries (d_as), and a dummy variable for advanced countries (d_adv)—which capture cross-regional variations in financial depth that are not captured by the explanatory variables.7
Because the estimation method requires a large sample, individual equations for these (and other) group of countries cannot be estimated precisely.
Continuity of the relationship given in equation (1) is desirable, otherwise small changes in the inflation rate around the threshold level will yield different impacts on financial depth depending on whether inflation is increasing or decreasing.
Theoretically, the relationship between financial depth and inflation may be characterized by multiple thresholds. However, as it is very difficult to estimate multiple thresholds, equation (1) only considers the single-threshold case.
Note that inflation enters in its inverse form in order to capture the convex relationship between financial depth and inflation as highlighted by Figure 2.10
There is a discontinuity at an inflation rate of zero in equation (1). However, the observations included in the sample are mostly positive with very few negative inflation rates. There are ways of circumventing this problem. For example, one may postulate a logistic relationship (which is continuous everywhere) between financial depth and inflation in which case inflation would enter as 1/[1 + exp(−π)]. Because both specifications yield results that are very close and because zero inflation is a rare phenomenon, the simpler functional form was retained.
contains only a few explanatory variables as income per capita (which is included in the equation) is a good proxy for a variety of other variables that may explain the level of development of the financial sector.
Estimation Method
If the threshold were known, the model could be estimated by ordinary least squares (OLS). Because π* is unknown, it should be estimated along with the other regression parameters. The appropriate estimation method in this case is nonlinear least squares (NLLS). Furthermore, since the regression is nonlinear and nondifferentiable in π*, conventional gradient search techniques to implement NLLS are inappropriate. Instead, estimation has been carried out with a method called conditional least squares, which can be described as follows. For any π*, the model is estimated by OLS, yielding the sum of squared residuals as a function of π*. The least squares estimate of π* is found by selecting the value of π*, which minimizes the sum of squared residuals. Stacking the observation in vectors yields the following compact notation for equation (1):

where FD is the vector of observations on fdi, βπ =(γ1γ2θ′)' is the vector of parameters and Z is the corresponding matrix of observations on the explanatory variables. The coefficient vector β is indexed by π to show its dependence on the threshold level of inflation, the range of which is given by π and
. Define S(π) as the residual sum of squares with the threshold level of inflation fixed at π. The threshold estimate level π* is chosen so as to minimize S(π) as follows:

Inference
It is important to determine whether the threshold effect is statistically significant. In equation (1), to test for no threshold effects amounts simply to testing the null hypothesis H0: γ1=γ2. Under the null hypothesis, the threshold π* is not identified, so classical tests, such as the t test, have nonstandard distributions. Hansen (1999) suggests a bootstrap method to simulate the empirical distribution of the following likelihood ratio test of H0:
where S0 and S1 are the residual sum of squares under H0: γ1 = γ2, and H1: γ1≠ γ2, respectively; and
is the residual variance under H1. In other words, S0 and S1 are the residual sum of squares for equation (1) without and with threshold effects, respectively. The asymptotic distribution of LR0 is nonstandard and strictly dominates the χ2 distribution. The distribution of LR0 depends in general on the moments of the sample; thus critical values cannot be tabulated. Hansen (1999) shows how to bootstrap the distribution of LR0 in the context of a panel.
An interesting question is whether an inflation threshold, for example, of 10 percent is significantly different from a threshold of 8 percent or 15 percent. In other words, can the concept of confidence intervals be generalized to threshold estimates? Chan and Tsay (1998) show that in the case of a continuous threshold model studied here, the asymptotic distribution of all parameters, including the threshold level, have a normal distribution.11
Hansen (2000) derives the asymptotic distribution for the discontinuous threshold model.
of Φ (described earlier) are asymptotically normally distributed:
where
,
,
,
is the vector of all right-hand side variables in equation (1), and NT is the total number of observations. The estimates of U and V are given by
and
, with
.12
An alternative, and perhaps more accurate, method of computing the standard errors of the coefficients and threshold estimates is by a bootstrap method. However, this method is computationally more costly. Furthermore, the sample size used here is large enough for the asymptotic distribution to yield a reasonably accurate approximation.
ESTIMATION AND INFERENCE RESULTS
Test for the Existence of Threshold Effects
The first step is to test for the existence of a threshold effect in the relationship between inflation and financial depth using the likelihood ratio, LR0, discussed earlier. This implies estimating equation (1) and computing the residual sum of squares (RSS) for threshold levels of inflation ranging from π to
. The threshold estimate is the one that minimizes the sequence of RSSs. The test for the existence of threshold effects has been conducted using the three selected indicators of financial depth. The results are summarized in Table 1.

The first column gives the range over which the search for the threshold effect is conducted, which is 1 percent to 100 percent with increments of 1 percent. This yields 100 panel regressions of equation (1). Using fd1 as an indicator of financial depth, the minimization of the vector of 100 RSSs occurs at the inflation level of 6 percent. Repeating the same procedure for fd2, andfd3 yields threshold estimates of 3 percent and 5 percent, respectively. The column LR0 in Table 1 gives the observed value of the likelihood ratio. The significance levels have been computed using the bootstrap distributions (corresponding to the three indicators of financial depth) of LR0.13
For a more detailed discussion on the computation of the bootstrap distribution of LR0, see Hansen (1999).
Estimation Results
Table 2 provides the estimation results of equation (1) for the three indicators of financial depth. The effect of inflation on financial development for inflation rates below or equal to (above) the threshold level is given by the first (second) coefficient. All three equations show a similar effect of inflation on financial depth. For fd1, the first coefficient estimate suggests that a small increase in the rate of inflation (while remaining below the threshold) leads to a very modest reduction in financial depth.14
Recall that inflation enters the specification in inverse form.

The coefficients on the second terms in the fd1, fd2, and fd3 relationships are all large, positive, and highly statistically significant. Thus inflation has powerful negative effects on all measures of financial depth for rates of inflation above the threshold.
Having established the existence of a threshold for all three indicators of financial depth, the next important question is to see how precise these estimates are. This requires the computation of the confidence interval around the threshold estimates. If the confidence intervals are wide, that would imply that there is substantial uncertainty about the threshold level. The 95 percent confidence interval includes inflation rates in the [5.98, 6.02] interval for fd1, in the [2.87, 3.13] interval for fd2, and in the [4.95, 5.05] interval for fd3. These extremely tight confidence intervals suggest that the threshold estimates are very precise. Combining the information given by these three confidence regions, the threshold value of inflation can be narrowed down to the 3–6 percent range, which is quite precise considering that this range is based on three different indicators of financial depth.
The log of income per capita [log(pppgdp)], which measures the level of economic development of a country, and hence proxies for a wide range of variables related to economic and financial development of a country, enters all of the financial development relationships with a positive and highly significant coefficient. A doubling of income per capita will increase fd3 by approximately 45 percent of GDP. The degree of openness (open) is also positively and significantly related to financial depth, corroborating the view that international trade in goods and services may spur the development of financial markets. The size of the government as measured by the share of government consumption in GDP (cg) has a negative effect on financial development. This may be because governments with weak fiscal positions are tempted to engage in financial repression, as argued above. The three regional dummies (d_la for Latin America, d_as for Asia, and d_adv for advanced countries) show a significantly higher level of fd1 for advanced economies and a significantly lower level of fd2 and fd3 for Latin America, even after controlling for the level of income per capita. The fit is quite good for models estimated with annual panel data.
Figure 3 illustrates the economic significance of the regression coefficients estimated in Table 2. For each measure of financial depth, the three panels show the effect of inflation on financial depth as inflation increases from 1 percent to 100 percent. All three indicators of financial depth yield a similar pattern for the effect of inflation on financial depth. Below the threshold, an increase in inflation has a small positive but statistically insignificant effect on financial depth (except for fd1, which shows a small negative but statistically insignificant effect). Above the threshold, increasing inflation significantly hampers financial depth. And, it bears emphasizing that the adverse effects of inflation for the financial system are particularly strong for economies with modest rates of inflation (but ones that exceed the threshold).

Effect of inflation on financial depth. Note: This graph shows the effect of inflation on financial depth (for inflation rates from 1 to 100 percent) using the coefficient estimates given in Table 2. Both inflation and financial depth are expressed in percentage terms.
Correcting for the Potential Endogeneity of Inflation15 As it is well known, the problem of simultaneity bias is a tricky one and very difficult to resolve using econometrics alone. This section should be interpreted in light of Section 2 highlighting theoretical arguments supporting the specification in equation (1) and the direction of causality it implies.
As it is well known, the problem of simultaneity bias is a tricky one and very difficult to resolve using econometrics alone. This section should be interpreted in light of Section 2 highlighting theoretical arguments supporting the specification in equation (1) and the direction of causality it implies.
The NLLS estimates of equation (1) may be biased because of the potential endogeneity of inflation. Therefore, equation (1) was reestimated using NLLS with instrumental variables for all potential endogenous variables, including inflation, PPP GDP, and the degree of openness. The list of instruments for inflation includes its first two lags, the first two lags of real GDP growth, and a time trend. For PPP GDP and openness, the instruments are their respective first two lags and a time trend.16
Data availability restricted our choice of instruments, and thus no experimentation with alternative instruments was undertaken.
Table 3 reports the estimation results which are very close to the NLLS results without instrumental variables in Table 2. The threshold estimates for fd1, fd2, and fd3 are 4 percent (versus 6 percent), 4 percent (versus 3 percent), and 7 percent (versus 5 percent), respectively. The confidence intervals for fd1, fd2, and fd3 are [3.89, 4.11], [3.88, 4.12], and [6.94, 7.06], respectively. The only significant differences between NLLS with and without instrumental variables is the weakening of the effect of inflation on financial depth,17
This is reflected in a decline in the coefficient on the second term for fd1 and fd2.

CONCLUSIONS
The recent empirical growth literature has consistently found a negative but nonlinear relationship between inflation and growth. The nonlinearity in the relationship arises from the existence of threshold effects, that is, there is a threshold level of inflation below which inflation has no significant effect on growth, but beyond which inflation significantly hampers growth. These findings do not accord well with standard macroeconomic models. However, recent theoretical models provide some interesting insights about this relationship. The main mechanism of transmission can be through financial markets. In the presence of frictions (arising from, for example, adverse selection, moral hazard, or costly state verification), inflation impedes financial development (and thus growth) by affecting the severity of these frictions. In particular, higher inflation leads to increased credit rationing and less extension of bank credit and therefore to lower investment and slower growth. These theoretical models further predict a nonlinear relationship between inflation and financial development, and thus between inflation and growth, that is similar to that uncovered in empirical work.
This paper finds that the relationship between inflation and financial depth is indeed nonlinear with threshold effects. The threshold level of inflation beyond which inflation significantly hinders growth is estimated to be in the 3–6 percent range. These estimates are quite precise and are robust with respect to the estimation method and to five alternative financial development indicators. The effect of inflation above the threshold is powerful. The combined effect on a broad financial development indicator fd3, defined as the sum of domestic credit to the private sector, stock market capitalization, and bond market capitalization (private and public) over GDP, of moving from a 5 percent to a 20 percent annual inflation rate is around 90 percent of GDP.
Interestingly, the threshold estimates for the relationship between inflation and financial depth analyzed in this paper fall within the range of threshold estimates found in a recent paper where inflation is directly related to growth [see Khan and Senhadji (2001)]. These combined results provide strong support for the view that financial markets are an important channel through which inflation affects growth in a nonlinear fashion.
Bruce Smith, our friend and coauthor, passed away tragically before this paper was completed. His contribution to the paper was far greater than one third. We will always be indebted to Bruce for what he taught us about money and finance. We also would like to thank Ehsan Choudhri, Magda Kandil, Eduardo Ley, Sunil Sharma, and two anonymous referees for very helpful comments. The views expressed in this paper are those of the authors and do not necessarily represent those of the International Monetary Fund.