


1. Introduction
Economists have been searching for measures beyond gross domestic product (GDP) to assess nations’ sustainable development, and have proposed measures such as net national product (NNP), zero net investment, and, more recently, genuine savings and inclusive wealth. These studies are all based on a Ramsey-type social well-being function that consists of the total utility of the current to future generations. In the analysis of optimal growth, social well-being is something to maximize; in the burgeoning literature on sustainability analysis,Footnote 1 well-being is something to sustain, though in per capita terms, as it is for GDP per capita in growth analyses. The idea itself is simple: wealth, which determines all future paths of welfare in an autonomous system, should be accumulated even more in a country experiencing population growth Arrow et al. (Reference Arrow, Dasgupta and Goulder2004,). Arrow et al. (Reference Arrow, Dasgupta and Goulder2004, Reference Arrow, Dasgupta, Goulder, Mumford and Oleson2012) put population growth in sharp relief by treating the number of people akin to exogenous TFP since sound demographic theory is not available.
In the same vein, a milestone publication, the Inclusive Wealth Report 2012 (UNU-IHDP and UNEP, 2012; henceforth IWR 2012), computes wealth composed of physical, human, and natural capital for selected countries. The IWR actually calculates a nation's wealth per capita simply by dividing by the total population, but assumes the dynamic average utilitarianism (DAU) social welfare function proposed and coined by Dasgupta (Reference Dasgupta2001).
DAU focuses on dynamic wealth per capita, that is, current wealth divided by the present discounted value of population, from the current to future generations combined. One motivation for DAU is to avoid estimating the shadow price of population and the subsistence-level consumption. However, this also looks like a straightforward setting, since inclusive wealth is supposed to be shared by future generations. Of course, on the face of it, some capital assets, such as public infrastructure, exist only for perhaps one or two generations, so it may seem that only these generations may use them. However, other capital assets contain some productive base for many future generations to use in an iterative manner. For example, human capital in one person may exist for several decades or a century, but the embedded knowledge and genes can exist for much longer. An ecosystem as natural capital is another textbook example of assets to be shared by many generations. This characteristic of wealth shared by many generations is in contrast to a flow variable like GDP, which is divided among only the current generation to arrive at GDP per capita.
IWR 2012 reconciles DAU in theory on the one hand, and total utilitarianism (TU) in practice on the other hand, by assuming that (Arrow et al., Reference Arrow, Dasgupta, Goulder, Mumford and Oleson2012; IWR 2012):
-
• population changes at a constant rate, and
-
• each equation reflecting the economy's dynamics can be expressed solely in terms of per capita capital stocks, i.e., they can be simplified by constant returns to scale.
When the above two assumptions hold, it is wealth per capita that affects changes in social well-being. While this is a legitimate starting point, we relax these assumptions, particularly for cases where TU and DAU yield different assessments of sustainability, which is the central focus of this paper. To the best of our knowledge, no follow-up study has appeared since, despite the potentially large effect of population dynamics on sustainability assessment under DAU.
Under this new criterion, DAU affects both the change in wealth per capita and the value of population because the marginal shadow price of population is modified, as shown in Arrow et al. (Reference Arrow, Dasgupta and Mäler2003). Thus, we also check the order of magnitude in the difference DAU makes in the value of population.
The paper offers several unique contributions. First, we adopt DAU as a sustainability criterion, and show its implications. Along the way, it is shown that, in order for an economy to be on a sustainable path under DAU, inclusive wealth should grow at a rate higher than the difference between the discount rate and the share of current population. Second, we compare inclusive wealth per capita empirically under TU vs. DAU, employing the dataset of IWR 2012 and population prospects. Moreover, we present an empirical application of the value of population according to three alternative criteria (TU, DAU, and static average utilitarianism (SAU)) in a way similar to Arrow et al. (Reference Arrow, Dasgupta and Mäler2003) and Asheim (Reference Asheim2004).
Section 2 highlights the theoretical aspects of DAU, by defining and discussing the present discounted population and sustainability assessment under DAU. The section also provides a thus far neglected review of the value of population under DAU in application research. Section 3 applies DAU to the inclusive wealth index of IWR 2012. In section 4, we conclude with a discussion and identify future challenges.
2. Theoretical implications
2.1 The basic model
Models that explicitly treat changing population and well-being per capita typically study TU in either a descriptive or normative sense, in which the economic objective function is social well-being,
 $$V(t)=\int_{t}^{\infty }N(s)U(c(s))e^{-\delta (s-t)}ds,$$
where N(s) is the population at s, U(c(s)) is the instantaneous utility derived from general consumption at s, and δ>0 refers to this economy's pure rate of time preference. TU is often contrasted with average utilitarianism, which accounts only for the average utility of agents in this economy. There are arguments against (static) average utilitarianism (termed SAU hereafter), since it implies unfair treatment of populous generations in the course of intertemporal resource allocation (Dasgupta, Reference Dasgupta2001). Asheim (Reference Asheim2004) cites a counterargument by imagining a maximin criterion to deal with ‘infimum of per capita utilities’.
Assuming a stochastic setting, Dasgupta (Reference Dasgupta2001) proposed an intuitive alternative criterion called DAU, wherein population flows from the present to the future, and society examines a variant of social well-being:
 $$V^{\ast }(t)={V(t) \over N^{\ast }(t)}={\int_{t}^{\infty }N(s)U(c(s))e^{-\delta (s-t)}ds \over \int_{t}^{\infty }N(s)e^{-\delta (s-t)}ds}.$$
The stochastic setting requires some justification. Under a Rawlsian veil of ignorance, we do not know where and when we are born. The society of one's peers might either be in a near future with way too much competition for resources, or a time with a lower population. However, the future population is subject to extinction risk, albeit a very minor one. Following Harsanyi (Reference Harsanyi1955), Dasgupta (Reference Dasgupta2001) studies the intergenerational well-being divided by the discounted present value of the (dynamically) total population. The latter denominator we denote with N*(t).
We first note the following fact:
Proposition 1 (discounted population). The time derivative of the discounted present number of total population is the sum of the discounted present number of population change, i.e.,
 $$\dot{N}^\ast(t) = \int_t^\infty \dot{N}(s) e^{-\delta (s -t)} ds,$$
where
 $\dot{N}(t)=dN(t)/dt$
.
$\dot{N}(t)=dN(t)/dt$
.
Proof: Taking the time derivative of the instantaneous discounted population, we have:
 $${d \over ds} N(s)e^{-\delta (s -t)} =(\dot{N}(s) -\delta N(s)) e^{-\delta (s -t)}.$$
Integrating both sides from t to infinity, we obtain:
 $$\eqalign{ N(t) &=\delta \int_t^\infty N(s)e^{-\delta (s -t)} ds -\int_t^\infty \dot{N} (s)e^{-\delta (s -t)}ds =\delta N^\ast(t) \cr & \quad -\int_t^\infty \dot{N}(s)e^{-\delta (s -t)}ds.}$$
Noting that
 $N+\dot{N}^{\ast}=\delta N^{\ast}$
, we have the result. □
$N+\dot{N}^{\ast}=\delta N^{\ast}$
, we have the result. □
Corollary 1. The rate of change of the discounted population is the integral of the increase in population, normalized by the discounted present population:
 $${\dot{N}^\ast(t) \over N^\ast(t)} =\delta - {N(t) \over N^\ast (t)} ={1 \over N^\ast (t)} \int_t^\infty \dot{N}(s) e^{-\delta (s -t)} ds.$$
Thus, taking a very distant horizon, N* should stabilize as population converges to a certain level. Naturally, high discounting would reflect a near future trend of increasing population in the case of developing countries.
2.2 Sustainability as a wealth change
We follow earlier studies by judging the sustainability of development. Under DAU:
Definition 1. Development is sustainable at t if and only if the social well-being divided by the present discounted population is not declining at t. That is,
 $dV^{\ast }/dt\geq 0$
.
$dV^{\ast }/dt\geq 0$
.
We can use Definition 1 for a straightforward judgment of sustainability. Development is sustainable at t if the current instantaneous utility does not exceed the dynamic average well-being:
Proposition 2 (DAU).
 $dV^{\ast}/dt \geq 0$
if and only if
$dV^{\ast}/dt \geq 0$
if and only if
 $U \leq V/N^{\ast} = V^{\ast}$
.
$U \leq V/N^{\ast} = V^{\ast}$
.
Proof: Taking the time derivative of V*:
 $$\eqalign{ {dV^\ast \over dt} &= {\dot{V}N^\ast - V\dot{N}^\ast \over (N^\ast)^2} = {(-NU+\delta V)N^\ast - V(-N +\delta N^\ast) \over (N^\ast)^2} \cr &={N \over N^\ast} \left( {V \over N^\ast}-U \right).}$$
□
Proposition 2 has an intuitive appeal. Sustainability under DAU requires that instantaneous utility does not exceed the well-being per capita in a dynamic sense. Under this criterion, the return on well-being in the numerator and the return on population in the denominator, both being
 $\delta V/N^{\ast }$
, cancel out, as can be seen from the first to the second line in the proof above.
$\delta V/N^{\ast }$
, cancel out, as can be seen from the first to the second line in the proof above.
Despite its conceptual usefulness, it is not possible to use Proposition 2 directly in practical accounting unless we assume a linear utility of consumption. To see this point, it helps to compare it to the usual case of TU. Note that under TU,
 $\dot{V}=\delta V-NU\geq 0$
if and only if
$\dot{V}=\delta V-NU\geq 0$
if and only if
 $NU\leq \delta V$
, i.e., current utility must not exceed the return on well-being, not the well-being itself. However, the return on well-being is equivalent to the current-value Hamiltonian, so non-declining wealth requires non-negative net investment. In contrast, this return on well-being disappears in DAU, where the return-earning population sits in the denominator of the objective function. This means that one of the advantages of green accounting – that only the change in capital assets should matter to the change in well-being – is lost in the current setting.
$NU\leq \delta V$
, i.e., current utility must not exceed the return on well-being, not the well-being itself. However, the return on well-being is equivalent to the current-value Hamiltonian, so non-declining wealth requires non-negative net investment. In contrast, this return on well-being disappears in DAU, where the return-earning population sits in the denominator of the objective function. This means that one of the advantages of green accounting – that only the change in capital assets should matter to the change in well-being – is lost in the current setting.
So, we turn to a more practical implication of the non-declining wealth criterion under DAU. One can associate the rate of change in dynamic average wealth to the criterion:
Proposition 3 (DAU).
 $\dot{V}^{\ast}/V^{\ast} \geq 0$
if and only if
$\dot{V}^{\ast}/V^{\ast} \geq 0$
if and only if
 $\dot{V}/V \geq \delta - N/N^{\ast}$
.
$\dot{V}/V \geq \delta - N/N^{\ast}$
.
Proof: It is obvious from the rate of change of
 $V^{\ast} =V/N^{\ast}$
and the definition of N*.
$V^{\ast} =V/N^{\ast}$
and the definition of N*.
Corollary 2.
 $\dot{V}^{\ast}/V^{\ast} \geq 0$
if and only if
$\dot{V}^{\ast}/V^{\ast} \geq 0$
if and only if
 $NU/V \leq N/N^{\ast}$
.
$NU/V \leq N/N^{\ast}$
.
In Proposition 3, we observe that sustainability assessment under DAU depends upon our choice of an ethical parameter and population prospects. This is in contrast to TU where a simple rule of non-declining wealth applies. In particular, the rate of change in the usual well-being is associated with the difference between the pure rate of time preference and the share of the current population in the present discounted population, N/N*. The larger the future population to feed, the smaller N/N* becomes. Put another way, if the current population's share is high compared to the future population, there may be more justification for the current decline in inclusive wealth; that is, the bar for the sustainability test becomes lower.
This can go in both directions compared to the usual assessment of sustainability with
 $\dot{V}/V$
. Even if
$\dot{V}/V$
. Even if
 $\dot{V}/V$
is positive, when the future population is expected to grow considerably, such that the weight of current population N/N* is small compared to the social discount rate, it is easy to determine that the economy is non-sustainable under non-declining dynamic average well-being. In contrast, an economy on an unsustainable path in terms of conventional well-being, V, may be reassessed as sustainable if the current share of population is large relative to the present discounted population. In this case, current wealth decline may be rationalized because the country is having difficulties in terms of population pressure. The choice of the pure rate of time preference, or the social discount rate of utility, also works in both ways because a higher discount rate, δ, also decreases the present discounted value of population, which is the denominator in the second term in the RHS of Proposition 3. Note also from Corollary 1 that
$\dot{V}/V$
is positive, when the future population is expected to grow considerably, such that the weight of current population N/N* is small compared to the social discount rate, it is easy to determine that the economy is non-sustainable under non-declining dynamic average well-being. In contrast, an economy on an unsustainable path in terms of conventional well-being, V, may be reassessed as sustainable if the current share of population is large relative to the present discounted population. In this case, current wealth decline may be rationalized because the country is having difficulties in terms of population pressure. The choice of the pure rate of time preference, or the social discount rate of utility, also works in both ways because a higher discount rate, δ, also decreases the present discounted value of population, which is the denominator in the second term in the RHS of Proposition 3. Note also from Corollary 1 that
 $\delta -N/N^{\ast}$
represents the rate of change in the discounted present value of population.
$\delta -N/N^{\ast}$
represents the rate of change in the discounted present value of population.
That the social discount rate affects the sustainability of wealth per capita may sound strange. After all, both the numerator and the denominator in (2) are the present discounted utility or population flows. Therefore, presented in the way that Corollary 2 does, the discount rate may not appear in the sustainability assessment. If a component of wealth can be calculated solely by summing up future flows (e.g., Fenichel and Abbott, Reference Fenichel and Abbott2014), then the utility discount should be canceled out since it appears in both the numerator and denominator of equation (2). In reality, the numerator in (2) has to be measured using some existing stock figure.
Corollary 2 is obtained by directly applying
 $\dot{V}=\delta V-NU$
to Proposition 3. Corollary 2 also has an intuitive interpretation: the current share of utility in (conventional) intergenerational well-being should not be more than the current share of the intergenerational population. If we wish, we can further transform the RHS of Corollary 2 as
$\dot{V}=\delta V-NU$
to Proposition 3. Corollary 2 also has an intuitive interpretation: the current share of utility in (conventional) intergenerational well-being should not be more than the current share of the intergenerational population. If we wish, we can further transform the RHS of Corollary 2 as
 $$N^{\ast }U\leq V,$$
implying that, if the current utility level were to be enjoyed by all the (discounted) future generations, that total utility should not exceed social well-being. These expressions are free from the social discount rate. However, the utility on the LHS of the inequality is difficult to measure in practice. In application, we have no choice but to use Proposition 3. We will get back to this point in later sections.
In addition, it proves useful to mention another derived criterion for later purposes. Often used in practical accounting (Arrow et al., Reference Arrow, Dasgupta, Goulder, Mumford and Oleson2012; UNU-IHDP and UNEP, 2012, 2014) is
 $${V(t) \over N(t)}=\int_{t}^{\infty }{N(s) \over N(t)}U(c(s))e^{-\delta (s-t)}ds,$$
which we may call TU per capita. TU per capita is a simple extension of TU, whose objective function is divided by the present population. This is in contrast to SAU, where per capita utility is divided by current population (see Definition 2). The following is immediate, from Corollary 1:
Corollary 3 (TU per capita vs. DAU). The change rate of social well-being under TU per capita is larger (smaller) than that under DAU, if and only if
 $$\left( {\dot{V} \over V}-{\dot{N} \over N}\right) -{\dot{V}^{\ast} \over V^{\ast }}\gtrless 0\ \ \Leftrightarrow \ \ {\dot{N}^{\ast} \over N^{\ast }} =\delta -{N \over N^{\ast }}\gtrless {\dot{N} \over N}.$$
Sustainability under TU per capita is better (worse) than DAU, if and only if the social discount rate is larger (smaller) than the sum of population growth rate and the share of current population out of the present discounted population. Note that this relationship does not entail anything related to the change in inclusive wealth, in contrast to Proposition 3 which compares TU vs. DAU; what matters in the difference between TU per capita and DAU is an ethical parameter (δ ) and facts (
 $\dot{N}/N$
) and prospects on population (N/N*).
$\dot{N}/N$
) and prospects on population (N/N*).
2.3 Value of population under DAU
Arrow et al. (Reference Arrow, Dasgupta and Mäler2003) and Asheim (Reference Asheim2004) show that, in principle, the value of the change in capital stock per capita is not a correct measure of well-being improvement if population is included as another class of capital asset. Practical accounting exercises, including Arrow et al. (Reference Arrow, Dasgupta, Goulder, Mumford and Oleson2012) and UNU-IHDP and UNEP (2012) become legitimate even if population is also an asset by assuming that population growth is constant and that capital per capita figures fully describe the economy's dynamics. Arrow et al. (Reference Arrow, Dasgupta and Mäler2003) also show that, however, in general cases where these assumptions do not hold, the correct indicator of well-being improvement includes an additional term due to population change.
We confine our analysis in this subsection to a capital-population economy where there are no other stocks for simplicity.Footnote
2
Suppose that the dynamics of physical capital is governed by
 $\dot{K}=F(K,N)-Nc$
. Assume a logistical population change
$\dot{K}=F(K,N)-Nc$
. Assume a logistical population change
 $$\dot{N}(t)=\phi (N)=\nu (N(t))N(t)=AN(\bar{N}-N).$$
Let
 $G=\dot{K}+q\dot{N}$
and
$G=\dot{K}+q\dot{N}$
and
 $G^{\ast }=\dot{K}+q^{\ast }\dot{N}$
denote the increase in capital assets in monetary terms under TU and DAU, respectively. p
K
and p
N
are the shadow prices of K and N in utility terms. q and q* represent the marginal shadow prices of population in monetary terms under TU per capita and DAU, respectively. We then have:
$G^{\ast }=\dot{K}+q^{\ast }\dot{N}$
denote the increase in capital assets in monetary terms under TU and DAU, respectively. p
K
and p
N
are the shadow prices of K and N in utility terms. q and q* represent the marginal shadow prices of population in monetary terms under TU per capita and DAU, respectively. We then have:
Proposition 4. (Arrow et al. Reference Arrow, Dasgupta and Mäler2003). 4 Along an optimal path, the well-being improvement under TU per capita and DAU can be measured by, respectively:
 $${G \over N}=\dot{k}+(q+k){\dot{N} \over N},$$
 $${G^{\ast } \over N}=\dot{k}+\left( q+k-{V \over p_{k}}{\delta-N/N^{\ast } \over \dot{N}}\right) {\dot{N} \over N}$$
where
 $$q(t)=-k(t)+\int_{t}^{\infty }\left( {U(s) \over U^{\prime }(s)}-\nu^{\prime }(N(s))K(s)\right) {\dot{N}(s) \over \dot{N}(t)}e^{-\int_{t}^{s}F_{K}(K(\tau ),N(\tau ))d\tau }ds.$$
Proof: See Arrow et al., Reference Arrow, Dasgupta and Mäler2003 for details. We sketch an outline here. Establish the current-value Hamiltonian:
 $$H=NU(c)+p_{K}[F(K,N)-Nc]+p_{N}\phi (N).$$
Since
 $q\equiv p_{N}/p_{K}$
, the first-order conditions for optimality suggest
$q\equiv p_{N}/p_{K}$
, the first-order conditions for optimality suggest
 $\dot{q}=(F_{K}-\phi ^{\prime })q+U/p_{K}-(F_{N}-c)$
. Constant returns to scale applied to the dynamics of capital yields
$\dot{q}=(F_{K}-\phi ^{\prime })q+U/p_{K}-(F_{N}-c)$
. Constant returns to scale applied to the dynamics of capital yields
 $\dot{k} =F_{K}k+F_{N}-c-\nu k$
. Summing these two equations, noting that
$\dot{k} =F_{K}k+F_{N}-c-\nu k$
. Summing these two equations, noting that
 $\nu ^{\prime }K=\phi ^{\prime }k-vk$
, and integrating it forward into the future, we obtain q + k. □
$\nu ^{\prime }K=\phi ^{\prime }k-vk$
, and integrating it forward into the future, we obtain q + k. □
Proposition 4 says that the value of capital change divided by population, G/N, is not generally equal to the change in capital per capita because we must set aside extra units of capital stock for newborns represented by
 $k\dot{N}/N$
. Under TU per capita (equation (6)), this disappears only if it is equal to the negative of the marginal shadow price of population,
$k\dot{N}/N$
. Under TU per capita (equation (6)), this disappears only if it is equal to the negative of the marginal shadow price of population,
 $-q\dot{N}/N$
; that is to say, only if the integral term of equation (8) is null.
$-q\dot{N}/N$
; that is to say, only if the integral term of equation (8) is null.
To see how DAU affects the shadow price of the population, note that the added term in equation (7) is
 $-V^{\ast }\dot{N}^{\ast }/\dot{N}$
in monetary units.Footnote
3
Thus, when population is increasing, if the discounted present value of the total population is increasing disproportionately to the current population, the marginal value of population under DAU is naturally discounted more than that under TU along an optimal path. In another interpretation of (7), suppose that the equality holds in Proposition 3, i.e.,
$-V^{\ast }\dot{N}^{\ast }/\dot{N}$
in monetary units.Footnote
3
Thus, when population is increasing, if the discounted present value of the total population is increasing disproportionately to the current population, the marginal value of population under DAU is naturally discounted more than that under TU along an optimal path. In another interpretation of (7), suppose that the equality holds in Proposition 3, i.e.,
 $\dot{V}/V=\delta -N/N^{\ast }$
, which implies constant social well-being according to DAU. The added term then becomes
$\dot{V}/V=\delta -N/N^{\ast }$
, which implies constant social well-being according to DAU. The added term then becomes
 $-\dot{V}/\dot{N}$
in monetary units, implying that we should deduct the change of well-being relative to that of population from the value of population since social well-being is already kept constant.
$-\dot{V}/\dot{N}$
in monetary units, implying that we should deduct the change of well-being relative to that of population from the value of population since social well-being is already kept constant.
Another point requiring justification relates to the value of life term, U/U
′, in equation (8). Apparently, the absolute value of life depends on the specification of the utility function, especially on the consumption level that yields zero utility. For example, if we assume a constant relative risk aversion, η > 1, the value of life term would become
 $c/(1-\eta )<0.$
As Asheim (Reference Asheim2004) notes, if a person is brought to the economy with an endowed per capita consumption, instantaneous well-being is reduced. If utility is logarithmic, the value of life can be expressed as cln c ≥ 0 as long as c ≥ 1. The latter level of consumption could be conceived of as subsistence-level (Dasgupta, Reference Dasgupta2001). In the application section, we will use the value of a statistical life year (VSLY) following the treatment of health capital accounting in the literature (Arrow et al., Reference Arrow, Dasgupta, Goulder, Mumford and Oleson2012). The exercise presupposes that consumption is above the subsistence level.
$c/(1-\eta )<0.$
As Asheim (Reference Asheim2004) notes, if a person is brought to the economy with an endowed per capita consumption, instantaneous well-being is reduced. If utility is logarithmic, the value of life can be expressed as cln c ≥ 0 as long as c ≥ 1. The latter level of consumption could be conceived of as subsistence-level (Dasgupta, Reference Dasgupta2001). In the application section, we will use the value of a statistical life year (VSLY) following the treatment of health capital accounting in the literature (Arrow et al., Reference Arrow, Dasgupta, Goulder, Mumford and Oleson2012). The exercise presupposes that consumption is above the subsistence level.
The social discount rate and the return on physical capital influence the value of population in different ways. The value of population, q, can become negative when the value of living longer is small relative to the required capital for marginal relative population growth, ν′ K. A higher return on capital also decreases the value of population. The social discount rate, δ, only affects the increased value of population under DAU, as in equation (7).
2.4 Value of population under discounted SAU
Welfare analysis under DAU has its critics. It is often argued that it is at least debatable to discount future population at a constant rate, δ, to derive N*. However, population discounting can be rationalized by considering choice under uncertainty with the risk of extinction in parallel with hazard rate, which is naturally derived in a Harsanyi-Rawls veil-of-ignorance setting.
Another criticism is that it is much more straightforward to adopt (discounted) average utilitarianism defined to maximize the sum of per capita utilities, regardless of population change. However, the SAU also has a downside: all else being equal, it would recommend a higher distribution to more populous generations in an optimal economy (Dasgupta, Reference Dasgupta2001). In addition, average utilitarianism implies that a life (not) worth living can have negative (positive) value of life. Recent proposals of rank-discounted utilitarianism are one way to get around this point (Zuber and Asheim, Reference Zuber and Asheim2012; Asheim and Zuber, Reference Asheim and Zuber2014).Footnote 4 It is possible to defend the discounted SAU in specific settings: it could be useful in maximin criteria where a social planner maximizes the infimum of per capita utilities within generations and ensures sustainability.Footnote 5 In an immediate follow-up study to Arrow et al. (Reference Arrow, Dasgupta and Mäler2003), Asheim (Reference Asheim2004) also considers this utilitarianism when only per capita, rather than total, utility matters. Per capita utility is considered in Pezzey (Reference Pezzey2004) as well. While this is not the focus of our argument, it helps to have a comparison to this alternative criterion.
Definition 2. Under SAU, development is sustainable at t if and only if the per capita social well-being is not declining at t. That is,
 $${dv \over dt}\equiv \int_{t}^{\infty }{dU(c(s)) \over ds}e^{-\delta (s-t)}ds\geq 0.$$
By Definition 2, we have the following:
Proposition 5 (Asheim, 2004, Proposition 6). Along an optimal path, well-being improvements under SAU can be measured by
 $${\hat{G} \over N}=\dot{k}+(\hat{q}+k){\dot{N} \over N},$$
where
 $$\hat{q}(t)=-k(t)-\int_{t}^{\infty }\nu ^{\prime }(N(s))K(s){\dot{N}(s) \over \dot{N}(t)}e^{-\int_{t}^{s}F_{K}(K(\tau ),N(\tau ))d\tau }ds.$$
Proof: The one and only important change from the TU or DAU case in Proposition 4 lies in the adjoint equation for the relative price of the population. The current-value Hamiltonian now reads:
 $$\hat{H}=U(c)+\hat{p}_{K}[F(K,N)-Nc]+\hat{p}_{N}\phi (N).$$
Since
 $\hat{q}\equiv \hat{p}_{N}/\hat{p}_{K}$
, the first-order conditions for optimality include:
$\hat{q}\equiv \hat{p}_{N}/\hat{p}_{K}$
, the first-order conditions for optimality include:
 $$\dot{\hat{q}}=(F_{K}-\phi ^{\prime })\hat{q}-(F_{N}-c).$$
An analogous treatment to Proposition 4 yields q̂ + k as in (11).
As shown in the proof, the dynamics of the relative shadow price of the population, q̂, does not entail current utility because the current population number does not matter under per capita utilitarianism. While acknowledging the pros and cons of TU, DAU, and SAU, it is fair to say SAU also merits a separate discussion for its simplicity. In particular, unlike (8), it does not depend on the consumption level that yields zero utility; the value of life term does not appear in (11). It is also easy to see that, even under SAU, only when assuming constant population (
 $\nu ^{\prime }(N(s))=0$
for all s) is it legitimate to simplify and use the increase in physical stock per capita as the well-being indicator.
$\nu ^{\prime }(N(s))=0$
for all s) is it legitimate to simplify and use the increase in physical stock per capita as the well-being indicator.
3. Application to the inclusive wealth index
The validity of the arguments sought in the previous sections is an empirical question, as are assumptions about parameters and population prospects. In the following sections, we therefore apply the theory to data obtained from recent publications on green and wealth accounting. It is worth stressing that, in this application section, V and V* stand for inclusive wealth, not well-being, under TU and DAU, respectively. This slight abuse of notation should not create confusion in what follows, since it is impossible to directly measure social well-being in practice.
Specifically, data in this section are obtained from the Inclusive Wealth Report 2012 (UNU-IHDP and UNEP, 2012), combined with past and future population estimates reported in the United Nations Population Division (2013). As such, samples are limited to the twenty countries in the pilot study of IWR 2012. In this application section, we call
 $$\sum_{i}{p_{i} \over p_{K}}K_{i}$$
the (inclusive) wealth in dollar terms. Here K i denotes physical, human, and natural capital. Their shadow prices are p i . The default value of the social discount rate of utility is δ=0.05 and we use the medium fertility scenario.
3.1 Wealth per capita under DAU
To recap, Proposition 3 demonstrates that the key factor in sustainability under DAU is whether well-being grows sufficiently to feed the future population, which grows at a speed of
 $\delta -N/N^{\ast }$
. As is expected from this expression, the social discount rate, relative to the current share of the dynamic total population, plays a pivotal role in the new assessment. When the discount rate is large, the difference,
$\delta -N/N^{\ast }$
. As is expected from this expression, the social discount rate, relative to the current share of the dynamic total population, plays a pivotal role in the new assessment. When the discount rate is large, the difference,
 $\delta -N/N^{\ast }$
, easily becomes positive, which means a higher bar to overcome for those countries with low growth in inclusive wealth.
$\delta -N/N^{\ast }$
, easily becomes positive, which means a higher bar to overcome for those countries with low growth in inclusive wealth.
Figure 1 presents the graphical comparison of inclusive wealth under TU per capita vs. DAU for selected countries. First, the dashed line measures inclusive wealth per capita under TU per capita in dollar value, V/N, which is simply taken from the ‘per capita inclusive wealth index’ in UNU-IHDP and UNEP (2012). Second, our new estimate of inclusive wealth per capita under DAU,
 $V^{\ast }=V/N^{\ast }$
, appears as the solid line. We construct this figure by dividing current inclusive wealth in dollar value, V, as reported in ‘inclusive wealth index’ in UNU-IHDP and UNEP (2012), by the discounted value of total population, N*. We calculate the latter N* by simply aggregating the discounted population from the current period to 2400.Footnote
6
For the population data, we employ actual values for 1990–2008 and estimates for 2009–2100, reported in the medium fertility case of United Nations Population Division (2013), assuming that population does not change from 2100 to 2400.Footnote
7
$V^{\ast }=V/N^{\ast }$
, appears as the solid line. We construct this figure by dividing current inclusive wealth in dollar value, V, as reported in ‘inclusive wealth index’ in UNU-IHDP and UNEP (2012), by the discounted value of total population, N*. We calculate the latter N* by simply aggregating the discounted population from the current period to 2400.Footnote
6
For the population data, we employ actual values for 1990–2008 and estimates for 2009–2100, reported in the medium fertility case of United Nations Population Division (2013), assuming that population does not change from 2100 to 2400.Footnote
7
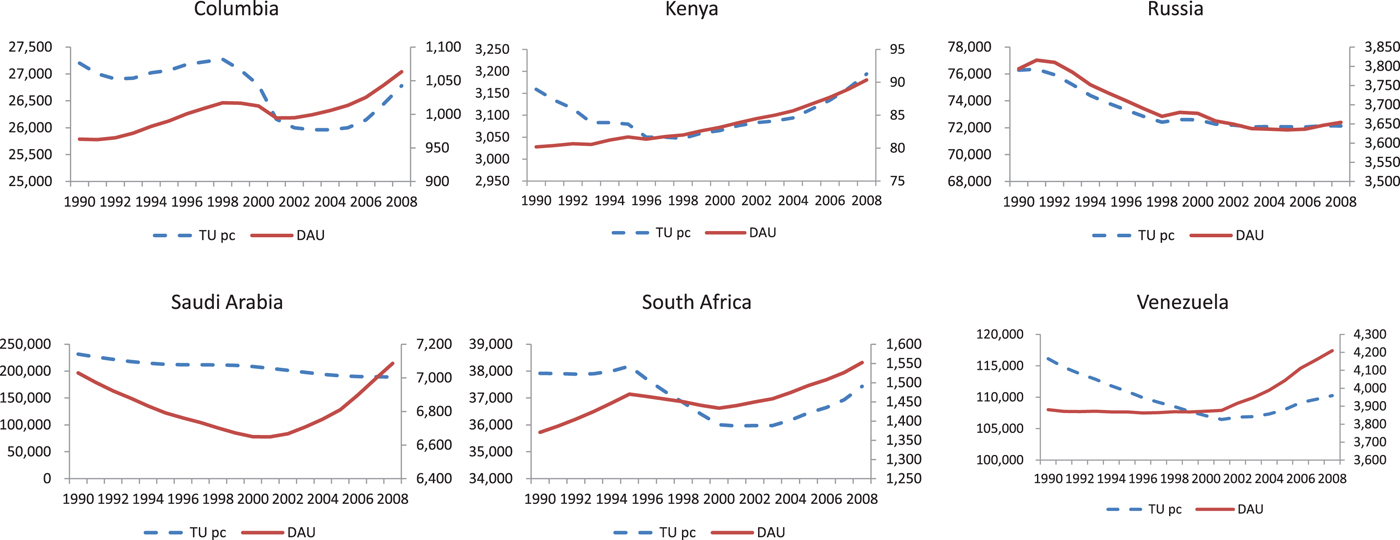
Figure 1. Inclusive wealth under TU per capita (dashed line) and under DAU (solid line), selected countries, 1990–2008. Based on IWR 2012 and the author's calculation
Figures A2 and A3 in online appendix B, available at http://dx.doi.org/10.1017/S1355770X17000274, provide another presentation showing the change rates of inclusive wealth under TU (
 $\dot{V}/V$
), under TU per capita (
$\dot{V}/V$
), under TU per capita (
 $\dot{V}/V-\dot{N}/N$
), and under DAU (
$\dot{V}/V-\dot{N}/N$
), and under DAU (
 $\dot{V}/V+N/N^{\ast }-\delta $
). Wealth under TU shows the best picture of sustainability of the three criteria, as long as population is increasing. However, whether or not wealth under DAU (solid line) performs ‘better’ than TU per capita (dashed line) differs from country to country, as we have seen in section 2.2.
$\dot{V}/V+N/N^{\ast }-\delta $
). Wealth under TU shows the best picture of sustainability of the three criteria, as long as population is increasing. However, whether or not wealth under DAU (solid line) performs ‘better’ than TU per capita (dashed line) differs from country to country, as we have seen in section 2.2.
The key element in sustainability assessment is whether wealth has increased during the studied period, regardless of the absolute values. In this sense, a comparison of the figures for 1990 and 2008 show that we would have different assessments of whether nations have accumulated inclusive wealth per capita for the following four countries: Colombia, Saudi Arabia, South Africa and Venezuela. It seems that Russia has decreased inclusive wealth in light of both TU per capita and DAU. For the other 15 countries in the sample, inclusive wealth has increased in either criteria (see figure A1 in online appendix A).
We thus focus on those four countries that show deviations from the original inclusive wealth path under TU per capita. As can be seen in figure 1, Colombia and South Africa experienced volatile wealth changes, even in terms of TU per capita. The volatility itself is not smoothed by applying DAU, but the sustainability assessment based on the period 1990–2008 improves for both countries. From Proposition 3, sustainability is ensured under DAU if and only if
 $\dot{V}/V+N/N^{\ast }-\delta \geq 0$
. Take South Africa, for example. The share of current population of the dynamic total population, N/N*, inches ahead monotonically from 3.6 to 4.2 per cent. In contrast, the change in value of inclusive wealth under TU started from 2.4 per cent, decreased to 0.2 per cent in 1999, and went up again to 2.3 per cent. Taken together,
$\dot{V}/V+N/N^{\ast }-\delta \geq 0$
. Take South Africa, for example. The share of current population of the dynamic total population, N/N*, inches ahead monotonically from 3.6 to 4.2 per cent. In contrast, the change in value of inclusive wealth under TU started from 2.4 per cent, decreased to 0.2 per cent in 1999, and went up again to 2.3 per cent. Taken together,
 $\dot{V}/V+N/N^{\ast }$
moved from 6 per cent, down to 4 per cent and ended at 7 per cent. Set against this is the social discount rate of δ= 5 per cent. Consequently, inclusive wealth under DAU has been increasing for most of the period. In another example for Colombia, the share of current population of the dynamic total population, N/N*, was also relatively stable, moving from 3.6 to 4.0 per cent. The value of the change in wealth under TU started at
$\dot{V}/V+N/N^{\ast }$
moved from 6 per cent, down to 4 per cent and ended at 7 per cent. Set against this is the social discount rate of δ= 5 per cent. Consequently, inclusive wealth under DAU has been increasing for most of the period. In another example for Colombia, the share of current population of the dynamic total population, N/N*, was also relatively stable, moving from 3.6 to 4.0 per cent. The value of the change in wealth under TU started at
 $\dot{V}/V$
= 1.2 per cent, became negative once, and then recovered to 2.8 per cent.
$\dot{V}/V$
= 1.2 per cent, became negative once, and then recovered to 2.8 per cent.
A U-shaped wealth per capita path emerges for Saudi Arabia under DAU, whose wealth growth has been on the order of
 $\dot{V}/V$
= 1 per cent for the 1990s and then 2 per cent for the 2000s under TU. Population pressure has been constantly on the decline from N/N*= 3 to 4 per cent throughout. All things considered, sustainability under DAU is ensured only after 2000.
$\dot{V}/V$
= 1 per cent for the 1990s and then 2 per cent for the 2000s under TU. Population pressure has been constantly on the decline from N/N*= 3 to 4 per cent throughout. All things considered, sustainability under DAU is ensured only after 2000.
The oil-rich Venezuela is also an interesting case, as wealth per capita under DAU was almost unchanged in the 1990s, i.e., the country is on a sustainable path under DAU in those days, in contrast to assessments under TU per capita. The wealth growth improved, from the order of
 $\dot{V}/V$
= 1 to 2 per cent during the studied period. Meanwhile, the share of population out of the discounted population, N/N*, has been on the order of 3 per cent throughout. They together have turned sustainability under DAU from negative to positive across the border.
$\dot{V}/V$
= 1 to 2 per cent during the studied period. Meanwhile, the share of population out of the discounted population, N/N*, has been on the order of 3 per cent throughout. They together have turned sustainability under DAU from negative to positive across the border.
3.2 Sensitivity analysis
Our theoretical results suggest that sustainability under DAU hinges on our choice of the ethical parameter (δ ), as well as three scenarios of population growth from the United Nations Population Division, 2013. The upper panel of figure 2 reports sensitivity of the average annual change rate of inclusive wealth for 1990–2008. Different discount rates of 2, 5 (base case), and 8 per cent, as well as TU per capita results, are shown. The proper discount rate to be applied to (2) is not known; we follow Arrow et al., Reference Arrow, Dasgupta, Goulder, Mumford and Oleson2012 who adopted 5 per cent as a base case for discounting additional life years remaining in sustainability analysis.

Figure 2. Sensitivity analysis of the change rates (%) in the values of inclusive wealth under DAU. The upper and lower panels show sensitivity of discount rates (2%, 5%, and 8%), and population scenarios (low, medium, and high fertility cases), respectively. The dots indicate TU per capita. Based on IWR 2012, United Nations Population Division (2013), and the author's calculation
The effect of the discount rate δ on
 $\delta -N/N^{\ast }$
is ambiguous, as higher (lower) discounting makes the discounted future population smaller (larger):
$\delta -N/N^{\ast }$
is ambiguous, as higher (lower) discounting makes the discounted future population smaller (larger):
 $${\partial \over \partial \delta }\left( \delta -{N \over N^{\ast }}\right) =1-{N \over N^{\ast }}{\int_{t}^{\infty }(\tau -t)N(\tau )e^{-\delta (\tau -t)}d\tau \over N^{\ast }}.$$
Empirically, a lower (higher) discount rate is likely to make
 $\delta -N/N^{\ast }$
smaller (larger), thus raising the sustainability bar lower (higher). If this is the case, application of a low discount rate makes up for negative growth in inclusive wealth for sustainability assessments under TU (see Proposition 3). A lower discount rate implies that the present discounted population, N*, absorbs more future generations. Because this translates into inclusive wealth divided up by an increasing number of (distant) people, annual changes in inclusive wealth under TU per capita becomes increasingly negligible. In fact, it turns out that the low discounting case (2 per cent) improves performance of many countries, leaving only Nigeria and Russia assessed as unsustainable under DAU. It is also apparent from Proposition 3 that an even lower discount rate that is used in climate change economics, say, 0.1 per cent, would bring almost all the countries, including Nigeria, on a sustainable path under DAU, with Russia being the only exception. To see this more clearly, table 1 presents the variable share of the current population out of the dynamic future population for different discount rates. Inclusive wealth change under TU in Russia (−0.5 per cent on the average) cannot be justified for any discount rate under DAU for currently available population scenarios. The high discounting case (8 per cent) changes sustainability assessments from positive to negative in Australia, Columbia, Saudi Arabia, and Venezuela.
$\delta -N/N^{\ast }$
smaller (larger), thus raising the sustainability bar lower (higher). If this is the case, application of a low discount rate makes up for negative growth in inclusive wealth for sustainability assessments under TU (see Proposition 3). A lower discount rate implies that the present discounted population, N*, absorbs more future generations. Because this translates into inclusive wealth divided up by an increasing number of (distant) people, annual changes in inclusive wealth under TU per capita becomes increasingly negligible. In fact, it turns out that the low discounting case (2 per cent) improves performance of many countries, leaving only Nigeria and Russia assessed as unsustainable under DAU. It is also apparent from Proposition 3 that an even lower discount rate that is used in climate change economics, say, 0.1 per cent, would bring almost all the countries, including Nigeria, on a sustainable path under DAU, with Russia being the only exception. To see this more clearly, table 1 presents the variable share of the current population out of the dynamic future population for different discount rates. Inclusive wealth change under TU in Russia (−0.5 per cent on the average) cannot be justified for any discount rate under DAU for currently available population scenarios. The high discounting case (8 per cent) changes sustainability assessments from positive to negative in Australia, Columbia, Saudi Arabia, and Venezuela.
Table 1. Sensitivity of N/N* for different discount rates (unit: %)

In contrast, the lower panel of figure 2 suggests that our results of DAU are fairly robust regarding different population scenarios. Only in Australia does the change rate in inclusive wealth under DAU turn negative slightly. On the whole, low (high) fertility cases tend to make the change rates of inclusive wealth under DAU better (worse) than the base case of medium fertility case. The only exceptions are France and United Kingdom. On the whole, the DAU results shown are relatively robust with regard to discount rates and population scenarios.
3.3 Value of population under DAU
We now turn to explore the order of the magnitude of the value of population as another type of capital asset under DAU, as proposed by Arrow et al., Reference Arrow, Dasgupta and Mäler2003. In line with Propositions 4 and 5, the figures are compared to the TU and SAU.Footnote 8
We first prepare the same population prospects dataset for the medium fertility case from the United Nations Population Division, 2013, from 2011 to 2100. From 2100 on, there is no official estimate, so we assume that population will be at a steady state till 2400. Second, to obtain the relative growth rate for population in equations (8) and (11) for each country, we estimate the population growth function from the past data and future projections for the 1950–2100 period. We use only the positive growth period for the estimation. For details, see table A1 in online appendix C. Third, for the value of life, U/U ′, required to analyze TU and DAU, we use the VSLY to compute health capital as reported in Arrow et al., Reference Arrow, Dasgupta, Goulder, Mumford and Oleson2012. VSLY is adjusted for the sample countries according to the rule of thumb that VSLY is proportional to 0.6 power of GDP per capita in 2010, based on the VSLY figure for the U.S. at 6.3 million dollars (Viscusi and Aldy, Reference Viscusi and Aldy2003). We assume the discounted remaining years of life expectancy to be 16 years for all countries.Footnote 9 Finally, the real rate of return on capital, F K , is set at 5 per cent.
Table 2 shows the estimated change of wealth from t=2008 when population is another class of capital asset. Column 2 shows the change in inclusive wealth per capita in dollar terms in 2008, the latest figure reported in IWR 2012. Columns 3–5 show the value of population change in 2008, according to TU, DAU, and SAU.Footnote 10 The sum of columns 2 and 3 correspond to the change in wealth per capita inclusive of population, as expressed in equation (6) in Proposition 4. Likewise, the sum of columns 2 and 4 expresses the same metric under DAU, as in equation (7). Finally, the sum of columns 2 and 5 show the change in wealth per capita inclusive of population under SAU, corresponding to equation (11) in Proposition 5.
Table 2. Change in the value of inclusive wealth per capita (
 $\sum_i ({p_i}/{p_K}) \dot{K_i}$
) and the value of population change under TU, DAU, and SAU in 2008
$\sum_i ({p_i}/{p_K}) \dot{K_i}$
) and the value of population change under TU, DAU, and SAU in 2008

Note: The value of population change is
 $(q+k)\dot{N}/N$
under TU,
$(q+k)\dot{N}/N$
under TU,
 $(q+k-({V^{\ast}}/{p_{k}}) ({dN^{\ast}}/{dN}))\dot{N}/N$
under DAU, and
$(q+k-({V^{\ast}}/{p_{k}}) ({dN^{\ast}}/{dN}))\dot{N}/N$
under DAU, and
 $(\hat{q}+k)\dot{N}/N$
under SAU. For details, see Propositions 4 and 5. Unit: constant 2005 US$. Based on IWR 2012 and the author's calculation. See footnote 9 for VSLY figures.
$(\hat{q}+k)\dot{N}/N$
under SAU. For details, see Propositions 4 and 5. Unit: constant 2005 US$. Based on IWR 2012 and the author's calculation. See footnote 9 for VSLY figures.
Several remarks are in order. The immediate thing to note is that, as is the case with the debate on health capital in inclusive wealth accounting (UNU-IHDP and UNEP, 2012), the value of population change is higher than the change in inclusive wealth per capita by one or two orders of magnitude. Consequently, including the value of population in inclusive wealth would increase (decrease) the wealth estimates significantly in countries with increasing (decreasing) population. Second, comparing columns 3 (TU) and 4 (DAU), the difference between TU and DAU is relatively small compared to the magnitude of annual change in the value of population. In a country whose population is increasing (decreasing), the value of population under TU is larger (smaller) than that under DAU, as expected from Proposition 4. Third, the value of population under SAU is much smaller than under its alternative criteria, sometimes at around the same order as inclusive wealth per capita. As we have seen in Proposition 5, the controversial value of life is irrelevant under SAU, so here, the value of population only includes the demographic effect. Therefore, one way to avoid controversy while still analyzing the value of population might be to start from SAU and then go on to TU or DAU figures.
4. Concluding remarks
Given future population prospects, Dasgupta's (Reference Dasgupta2001) interesting DAU proposal does not change optimal policy, but may change sustainability assessments, especially in the context of uncertain population dynamics in the future. It therefore has the potential to affect the wealth accounting discussion as well. Our study shows that, as long as wealth should be measured as stocks, the social discount rate applied to future population, as well as population dynamics, has a role in wealth accounting under DAU. In particular, inclusive wealth under TU should grow at a rate higher than the difference between the discount rate and the share of current population of the discounted future population. Our empirical results suggest that DAU changes sustainability assessments of some developing countries. Sensitivity analysis also suggests the importance of the choice of the discount rate. In contrast, our results were not sensitive to the UN's three fertility scenarios; however, population prospects are far from rock solid (see, e.g., a recent update by Gerland et al., Reference Gerland, Raftery and Ševčíková2014), because it is actually an endogenous function of many socioeconomic variables, compounded by the environment, development, and poverty. Moreover, with uncertain consequences of climate change to come over the next decades or centuries, migration will be all the more important (e.g., Marchiori and Schumacher, Reference Marchiori and Schumacher2011).
We have also applied relevant theoretical results to measure the value of population. In this exercise, the difference between TU and DAU does not matter so much in terms of the order of magnitude, although the data we used are still far from complete. It is also worthwhile noting that both Propositions 4 and 5 are analyses of optimal paths, which is a good starting point that may be extended to more general cases in the future.
One is tempted to draw policy implications, but it is unarguably difficult to control a country's population. As such, it is safe to say that we are asked to accumulate sufficient wealth such that it does not fall short of the dynamics of the present discounted value of population. Even if one's take on sustainable development is ‘strong,’ implying that investing in physical or human capital does not compensate for degrading natural capital, then our sustainability-related caution under DAU can be even stronger. Finally, along with sustainability assessments, different criteria may yield different assessments regarding intergenerational equity as well (cf. Yamaguchi, Reference Yamaguchi2017). With all these caveats, as wealth accounting grows ever more exhaustive and accurate, analysis under DAU is expected to show more relevant development policy implications.
Supplementary material.
The supplementary material for this article can be found at https://doi.org/10.1017/S1355770X17000274.
Acknowledgements
The author would like to thank Sir Partha Dasgupta for encouraging and invaluable comments. He is also grateful to Pablo Muñoz for extensive discussion on dynamic population. For helpful comments, the author would also like to thank Geir Asheim, Youngho Chang, Anantha Duraiappah, Reyer Gerlagh, Shunsuke Managi, Masao Ogaki, Ayumi Onuma, Martin Quaas, Hiroaki Sakamoto, Samuel Wills, anonymous referees, the editor Eswaran Somanathan, and participants of the 21st Annual Conference of the European Association of Environmental and Resource Economists (EAERE) in Helsinki, the Singapore Economic Review Conference (SERC), the workshop on ‘Sustainable Metropolis: Population, Productivity and Parity’ at Nanyang Technological University (NTU), and seminars in Keio, Kobe, Kyoto and Kyushu. The research has been partially supported by Grant-in-Aid for Specially Promoted Research (26000001) from the Japan Society for the Promotion of Science.


