Explanation and conservation in archaeology require detailed representations of the archaeological record. For conservation purposes, our goal is to document the current configuration of the record with as much detail as possible. For archaeological analysis, we often seek to generate accurate descriptions of artifacts that include measures of shape and a record of physical attributes. Structure from motion (SfM) mapping offers a cost-effective method of achieving these goals by extracting three-dimensional data from overlapping sets of two-dimensional images. In this paper, we demonstrate the effectiveness of SfM mapping for studying and documenting the pukao of Rapa Nui (Easter Island, Chile). The products of SfM mapping illustrate how the technique provides essential data for archaeological explanation and preserves a record of form and existing rock art. Information about pukao variability in form and surface details contributes directly to explanations of pukao transport and the placement of pukao atop statues (moai). Given that pukao are exposed and at risk of degradation, the use of SfM also attends to the need for preservation of existing petroglyphs for this UNESCO World Heritage Site (Carrero-Pazos et al. Reference Carrero-Pazos, Vázquez-Martínez and Vilas-Estévez2016).
PHOTOGRAMMETRY AND STRUCTURE FROM MOTION (SfM)
Photogrammetry is the practice of using photographs to make measurements. SfM is a subset of photogrammetry that consists of a range imaging technique that models three-dimensional structure. Applications of SfM mapping in archaeological analysis have rapidly expanded in the past decade (e.g., De Reu, De Clercq et al. Reference De Reu, De Clercq, Sergant, Deconynck and Laloo2013; De Reu, Plets et al. Reference De Reu, Plets, Verhoeven, De Smedt, Bats, Cherretté, De Maeyer, Deconynck, Herremans and Laloo2013; Fritz et al. Reference Fritz, Willis and Tosello2016; Lerma and Muir Reference Lerma and Muir2014; McCarthy and Benjamin Reference McCarthy and Benjamin2014; Meijer Reference Meijer2015), but the idea of using photogrammetry in archaeology is not new. Nearly 50 years ago, Atkinson (Reference Atkinson1968) used a stereometric camera system and Thompson-Watts photogrammetric plotter to record petroglyphs at Stonehenge, and others continued this practice (e.g., Dann and Jones Reference Dann and Jones1984; Fussell Reference Fussell1982; Ogleby and Rivett Reference Ogleby and Rivett1985). While SfM has its roots in analog photography, the emergence of inexpensive high-resolution digital imagery offers new areas for systematically and computationally extracting three-dimensional information across large numbers of overlapping photographs. Spurred by the ubiquity of digital photographs of scenes on the Internet that recorded common tourist destinations, University of Washington researchers (Snavely et al. Reference Snavely, Seitz and Szeliski2006) created a process that assembles three-dimensional models based on a series of photographs that are matched through an innovative scale-invariant algorithm known as scale-invariant feature transform (SIFT) (Lowe Reference Lowe2004). The fact that the photograph matching was scale-invariant enabled the process to produce models with virtually any group of overlapping photographs. All that is required is that any feature is photographed from at least three different views. In this way, the thousands of photographs from a given tourist site that are available online can be algorithmically assembled into a remarkably accurate three-dimensional model. This approach is effective even when those photographs were taken at different times, with different lighting conditions, and from any number of angles. The output of the process includes a threedimensional point cloud that represents the surfaces of the object(s) shown in the shared images as well as a mosaic of overlapping images.
Since these initial developments, SfM has developed into a powerful photogrammetric tool for recording architectural and archaeological features (Pollefeys et al. Reference Pollefeys, Van Gool, Vergauwen, Cornelis, Verbiest and Tops2003a, Reference Pollefeys, Van Gool, Vergauwen, Cornelis, Verbiest and Tops2003b). Though not strictly necessary, if photographs are taken in a systematic way with consistent overlap (usually between 70% and 90% in side and end-lap), then the process can produce remarkably detailed and highly accurate models. SfM mapping, as a result, now can be done routinely to study single objects, buildings, and, with aerial platforms, entire landscapes. With software that extends the basic SfM method to include spatial information, one can now render high-resolution scaled models of three-dimensional objects, produce georeferenced orthophotographs, create digital elevation models (DEMs), and establish contoured topographic representations.
There are many advantages to SfM relative to traditional photogrammetry and laser scanning. Specifically, SfM mapping involves less monetary cost, specialized equipment, and photogrammetric expertise (De Reu, Plets et al. Reference De Reu, Plets, Verhoeven, De Smedt, Bats, Cherretté, De Maeyer, Deconynck, Herremans and Laloo2013; Meijer Reference Meijer2015; Papadaki et al. Reference Papadaki, Agrafiotis, Georgopoulos and Prignitz2015; Rüther et al. Reference Rüther, Held, Bhurtha, Schroeder and Wessels2012). Additionally, a growing number of applications document that SfM mapping and laser scanning produce models with comparable accuracy (e.g., Brutto and Meli Reference Brutto and Meli2012; Galeazzi et al. Reference Galeazzi, Moyes and Aldenderfer2014; Lerma et al. Reference Lerma, Navarro, Seguí and Cabrelles2014; Lerma and Muir Reference Lerma and Muir2014; Mancini et al. Reference Mancini, Dubbini, Gattelli, Stecchi, Fabbri and Gabbianelli2013; Stal et al. Reference Stal, De Wulf, De Maeyer, Goossens and Nuttens2012), and comparable accuracy exists even when mapping small and relatively featureless objects (Clini et al. Reference Clini, Frapiccini, Mengoni, Nespeca and Ruggeri2016; Koutsoudis et al. Reference Koutsoudis, Vidmar and Arnaoutoglou2013).
Laser scanning is an alternative to SfM, but it has not become standard practice in archaeology. In the case of documenting rock art, laser scans can be of high quality (Johansson and Magnusson Reference Johansson and Magnusson2004; Papadaki et al. Reference Papadaki, Agrafiotis, Georgopoulos and Prignitz2015), but the cost of laser scanners is high, which is a factor that limits their application in most projects (Goldhahn and Sevara Reference Goldhahn and Sevara2011). Also, because laser scanners rely on active sensing using emitted electromagnetic radiation, they are sensitive to direct sunlight and often require tents and other materials to control natural light (Johansson and Magnusson Reference Johansson and Magnusson2004). In contrast, SfM mapping is a passive form of remote sensing that operates best under natural light conditions (Vilas-Estevez et al. Reference Vilas-Estevez, Vázquez-Martínez and Carrero-Pazos2016).
The relative benefits of SfM mapping and the absence of negative detractors help explain the growing use of this technique in archaeology. Archaeologists have applied SfM mapping to underwater landscapes (e.g., Bojakowski et al. Reference Bojakowski, Bojakowski and Naughton2015; Henderson et al. Reference Henderson, Pizarro and Mahon2013; Johnson-Roberson et al. Reference Johnson-Roberson, Bryson, Friedman, Pizarro, Troni, Ozog and Henderson2016; McCarthy and Benjamin Reference McCarthy and Benjamin2014; Meline et al. Reference Meline, Triboulet and Jouvencel2012; Mertes et al. Reference Mertes, Thomsen and Gulley2014), terrestrial landscapes (e.g., Doneus et al. Reference Doneus, Verhoeven, Fera, Briese, Kucera and Neubauer2011; Howland et al. Reference Howland, Kuester and Levy2014b; Mancini et al. Reference Mancini, Dubbini, Gattelli, Stecchi, Fabbri and Gabbianelli2013; Schönberger et al. Reference Schönberger, Fraundorfer and Frahm2014; Sevara Reference Sevara2013; Smith et al. Reference Smith, Passone, Al-Said, Al-Farhan and Levy2014; Tscharf et al. Reference Tscharf, Rumpler, Fraundorfer, Mayer and Bischof2015; Verhoeven Reference Verhoeven2011), and complex built structures such as monuments (e.g., Bevan et al. Reference Bevan, Li, Martinón-Torres, Green, Xia, Zhao, Zhao, Ma, Cao and Rehren2014), quarries (e.g., Verhoeven, Taelman et al. Reference Verhoeven, Taelman and Vermeulen2012), houses (e.g., Curry and Gallaway Reference Curry and Gallaway2016), courtyards (e.g., Levy et al. Reference Levy, Vincent, Howland, Kuester and Smith2014), museums (e.g., Jamhawi et al. Reference Jamhawi, Alshawabkeh, Freewan and Al-Gharaibeh2016), and reconstructed villages (e.g., Dunn and Woolford Reference Dunn and Woolford2012; Dunn et al. Reference Dunn, Woolford, Norman, White and Barker2012). Artifacts that are frequently mapped using SfM include pottery (e.g., Koutsoudis and Chamzas Reference Koutsoudis and Chamzas2011), lithics (e.g., Clarkson and Hiscock Reference Clarkson and Hiscock2011; Morales et al. Reference Morales, Lorenzo and Vergès2015), and faunal remains (e.g., Betts et al. Reference Betts, Maschner, Schou, Schlader, Holmes, Clement and Smuin2011; Niven et al. Reference Niven, Steele, Finke, Gernat and Hublin2009).
The use of SfM mapping in documenting other aspects of the archaeological record has also grown in recent years. Specifically, SfM mapping increases detail in the recording of excavations (Arles et al. Reference Arles, Clerc, Sarah, Téreygeol, Bonnamour, Heckes and Klein2013; De Reu, Plets et al. Reference De Reu, Plets, Verhoeven, De Smedt, Bats, Cherretté, De Maeyer, Deconynck, Herremans and Laloo2013; Forte et al. Reference Forte, Dell'Unto, Issavi, Onsurez and Lercari2012; Koenig et al. Reference Koenig, Willis and Black2017; Roosevelt et al. Reference Roosevelt, Cobb, Moss, Olson and Ünlüsoy2015), and the need for photographs and SfM model post-processing provides an avenue for engaging the public through citizen science (Bonacchi et al. Reference Bonacchi, Bevan, Pett, Keinan-Schoonbaert, Sparks, Wexler and Wilkin2014; Keinan Reference Keinan2014; McCarthy Reference McCarthy2014; Means Reference Means2015; Ritsos et al. Reference Ritsos, Wilson, Miles, Williams, Tiddeman, Labrosse, Griffiths, Edwards, Möller and Karl2014). Additionally, archaeologists and museum officials have used the products of SfM mapping to enhance data visualization in museum displays and thus aid public outreach (e.g., Cosmas et al. Reference Cosmas, Itegaki, Green, Grabczewski, Weimer, Van Gool, Zalesny, Vanrintel, Leberl and Grabner2001; Howland et al. Reference Howland, Kuester and Levy2014a; López-Romero Reference López-Romero2014; Means et al. Reference Means, McCuistion and Bowles2013; Smith et al. Reference Smith, Cutchin, Rockwood, Saad, Smith and Levy2012; Vincent et al. Reference Vincent, DeFanti, Schulze, Kuester and Levy2013; Williams and Twohig Reference Williams and Twohig2015).
SfM has the potential to make significant contributions to the documentation of rock art. Because of its ability to record color and subtle surface features, archaeologists have recently used SfM to profile a variety of petroglyphs and pictographs (e.g., Bertilsson Reference Bertilsson2015; Caninas et al. Reference Caninas, Pires, Henriques and Chambino2016; Hameeuw et al. Reference Hameeuw, Devillers and Claes2016; Lerma and Muir Reference Lerma and Muir2014; Plets et al. Reference Plets, Gheyle, Verhoeven, De Reu, Bourgeois, Verhegge and Stichelbaut2012; Tomášková Reference Tomášková2015; Wefers et al. Reference Wefers, Reich, Tietz and Boochs2016; Zeppelzauer et al. Reference Zeppelzauer, Poier, Seidl, Reinbacher, Schulter, Breiteneder and Bischof2016). Traditional recording methods for documenting rock art, such as freehand drawing, tracing, and photography, are relatively limited in terms of the information captured (Bertilsson Reference Bertilsson2015; Caninas et al. Reference Caninas, Pires, Henriques and Chambino2016; Meijer Reference Meijer2015; Stanbury and Clegg Reference Stanbury and Clegg1990). SfM is well-suited for identifying petroglyphs on uneven surfaces, such as those often found in caves (Caninas et al. Reference Caninas, Pires, Henriques and Chambino2016; Fritz et al. Reference Fritz, Willis and Tosello2016), and SfM models give spatial context to petroglyphs that is helpful for interpretation (Alexander et al. Reference Alexander, Pinz and Reinbacher2015; Janik et al. Reference Janik, Roughley and Szcz2007). Because of the value of SfM for the interpretation of rock art, archaeologists have recently explored methods of digitally enhancing model visualization (e.g., Carrero-Pazos et al. Reference Carrero-Pazos, Vázquez-Martínez and Vilas-Estévez2016; Vilas-Estevez et al. Reference Vilas-Estevez, Vázquez-Martínez and Carrero-Pazos2016), have developed specialized tools for efficiently collecting rock art photographs (e.g., Höll et al. Reference Höll, Holler and Pinz2014), and have segmented rock art models to effectively store and query models in databases (e.g., Poier et al. Reference Poier, Seidl, Zeppelzauer, Reinbacher, Schaich, Bellandi, Marretta and Bischof2016; Zeppelzauer et al. Reference Zeppelzauer and Poier2015; Zeppelzauer et al. Reference Zeppelzauer, Poier, Seidl, Reinbacher, Schulter, Breiteneder and Bischof2016). Significantly, SfM mapping has a substantially lower impact on rock art than tracing, and monitoring of archaeological features through SfM mapping can be used to identify conservation priorities (Plets et al. Reference Plets, Gheyle, Verhoeven, De Reu, Bourgeois, Verhegge and Stichelbaut2012). While Chandler (Reference Chandler, Bryan and Fryer2007) notes that analog methods of field recording remain dominant, it is likely that ease of high-resolution rock art mapping through SfM will make this technique a standard field recording strategy.
RAPA NUI MOAI AND PUKAO
Recording the complex form and subtle surface details of pukao through SfM mapping illustrates several of the valuable features of this mapping technique. Pukao are an ideal target for detailed recording through SfM mapping, because (1) current pukao form and past pukao transport are poorly documented and understood despite the frequent reference to pukao in narratives regarding Rapa Nui's past, and (2) pukao surface details are at risk of being erased by weathering.
Polynesians first colonized Rapa Nui around 1200 AD (Hunt and Lipo Reference Hunt and Lipo2006) and, over the course of prehistory, constructed nearly 1,000 monumental statues (moai), which they placed upon platforms (ahu, Hochstetter et al. Reference Hochstetter, Haoa, Lipo and Hunt2011). To top this feat of community-scale ingenuity, islanders also placed massive cylindrical bodies of red scoria (pukao) atop many (ca. 75) of the completed moai. The pukao are made of a relatively soft and coarsely vesicular material (red scoria) that varies in color from bright red to almost black on fresh surfaces. The prehistoric islanders quarried pukao from a volcanic vent known as Puna Pau and transported them to ahu located primarily along the coasts (Figures 1–2). The largest of the pukao is over 2 m in diameter, weighs approximately 12 metric tons, and was transported over 12 km. Quarrying activity at Puna Pau is largely evident during the latter part of prehistoric occupation, between the fourteenth and seventeenth centuries (Hamilton Reference Hamilton2013:100).
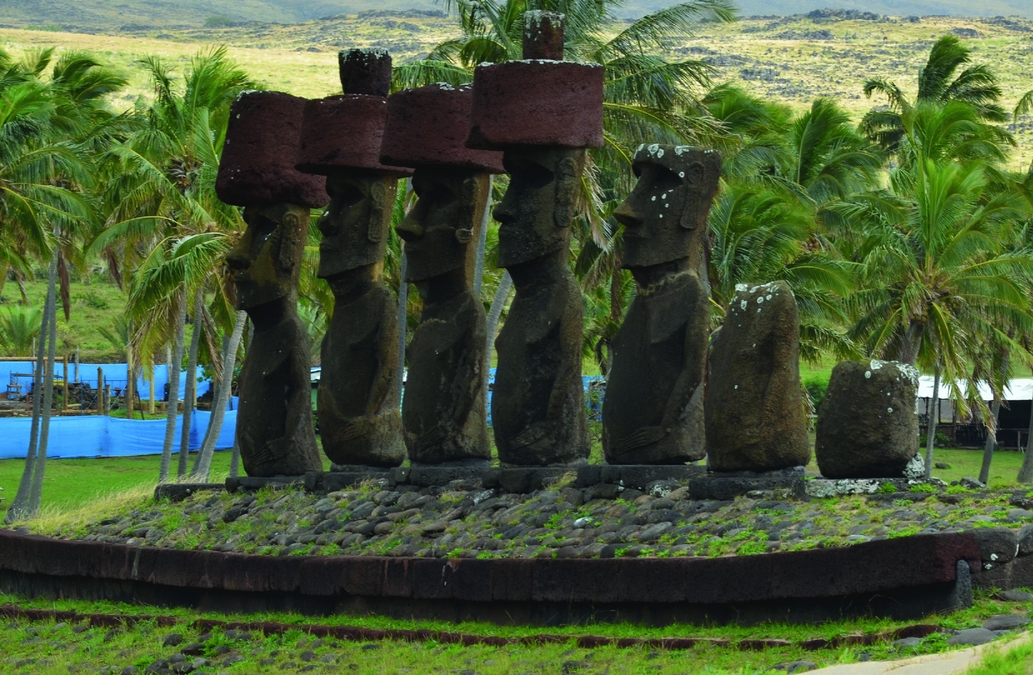
FIGURE 1. Photograph of red scoria pukao restored atop moai on an ahu at Anakena, located on the northern side of the island. Note that red scoria here is also used in the ahu lentils in front of the moai (photograph by T. Hunt).
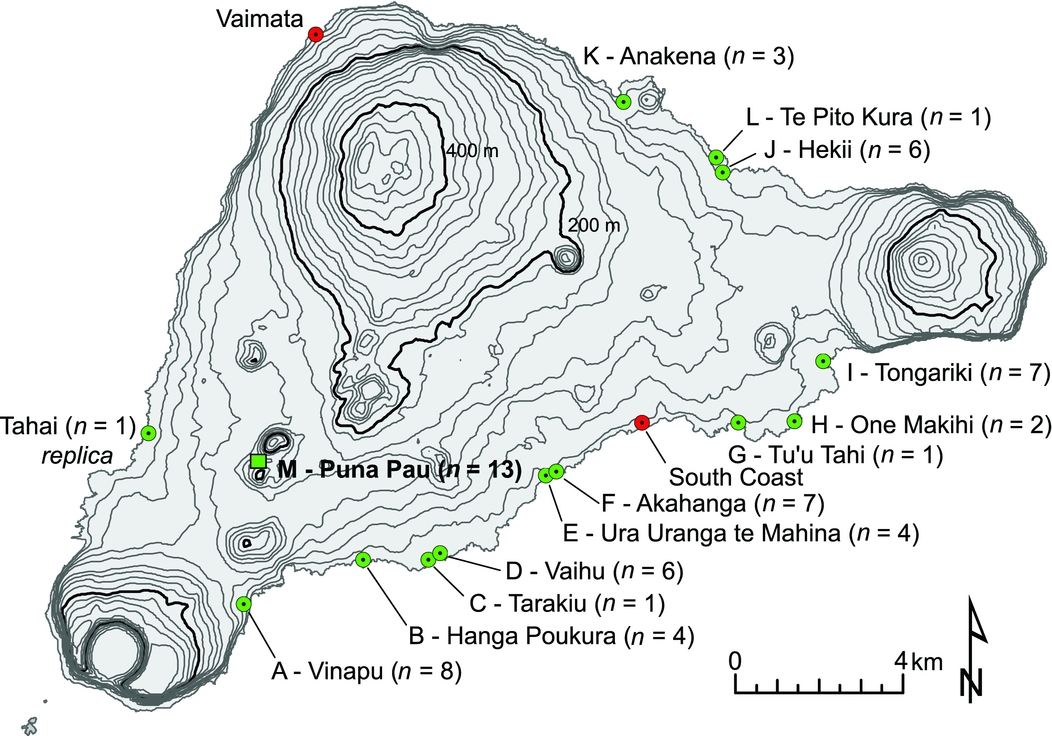
FIGURE 2. Map showing locations on Rapa Nui that yielded n usable models of scoria bodies (green). Locations marked in red include only pukao fragments that were not modeled. Letters associated with sites correspond to labels on pukao images in Figure 6. Note the inland pukao quarry of Puna Pau marked with square and bold in the southwest.
Like much of the monumental architecture on Rapa Nui (Charola Reference Charola1997), pukao have suffered from damage and extensive weathering, and there is significant need for documentation and conservation efforts. Factors that contribute to the decay of pukao come from several sources. First, pukao once rested atop the heads of standing moai, so the initial source of damage occurred when moai fell. Some believe that moai were toppled in intergroup warfare (e.g., Diamond Reference Diamond2005; Flenley and Bahn Reference Flenley and Bahn2003; Snyder et al. Reference Snyder, Bahn and Flenley1994). Roussel gives the earliest reports of moai toppling as the result of warfare in the mid-nineteenth century, but few of Roussel's contemporaries mention such warfare (Edwards et al. Reference Edwards, Marchetti, Dominichetti and Gonzáles-Ferrán1996:13). Scoresby Routledge (Reference Routledge1917:335) recounts one oral account that describes that “the last one [moai with pukao] was overthrown by the fathers of the present old men who as boys assisted their fathers – that is, about 1835.” Social unrest following European contact (Fischer Reference Fischer2005; Hunt and Lipo Reference Hunt and Lipo2011) and catastrophic natural events such as earthquakes (Edwards et al. Reference Edwards, Marchetti, Dominichetti and Gonzáles-Ferrán1996) contributed to the falling of moai over time. James Cook's 1774 visit to the island is the first mention of fallen pukao. Cook's naturalist, Johann Forster, for example, explicitly noted a fallen pukao: “We reached the east side of the island, near a range of seven pillars or statues, of which only four remained standing, and one of them had lost its cap.” (Kahn Reference Kahn1968:336)
Following the toppling of moai, islanders used fallen pukao as a source of raw materials. Katherine Routledge (Reference Routledge1998:199) notes the reuse of pukao “as building materials.” Additionally, Seager Thomas (Reference Seager Thomas2014:107) suggests the possible reuse of red scoria in inhumation burials and mentions a pukao from the vicinity of Ahu Tahai that was carved into a cross for the Catholic cemetery in Hanga Roa. Native Rapanui also informed an archaeological team in the 1960s that another pukao in the vicinity “had been cut up to use as building material” (Charola Reference Charola1994:35). Along the Rapa Nui coastline, there are five pukao with slabs of scoria removed along the upper edge of the body. At least some of these features were present during Cook's visit to the island in 1774, for he notes that “[i]n some, the upper corner of the cylinder was taken off in sort of a concave quarter-round; but in others the cylinder was entire” (Ruiz-Tagle Reference Ruiz-Tagle2005:160). Palmer (Reference Palmer1870:179) noticed two skulls embedded in a pukao with a slab missing, and Katherine Routledge (Reference Routledge1998) and Alfred Métraux (Reference Métraux1971) also noted the association of these pukao with death. Even unfinished pukao at Puna Pau exhibit evidence of being used as a raw material source. For example, Seager Thomas (Reference Seager Thomas2014:106) argues that “over the years, red scoria originally from Puna Pau has been systematically robbed from ahu, with topknots cut and gouged away and granules from these spilled like blood over the ahu and around the heads of fallen moai.”
Pukao also suffer from exposure to weather. Even in 1868, Linton Palmer (Reference Palmer1869:374) noted that pukao “were much decayed by weather.” By the time of his visit, the pukao had already experienced heavy erosion from physical and chemical processes independent of human action. Rapa Nui's coastlines are exposed to the winds and sea spray, and the island experiences an average of 1,130 mm of rainfall each year. The combined heavy showers and winds lead to mechanical erosion of pukao, and the results of the weathering are clays that settle in the interstices of the porous rock. When the clays get wet, they expand and create internal stress that further contributes to the breakdown of rock. Crystallization of salt from sea spray also leads to mechanical breakdown of the red scoria.
In a few cases, intertidal wave action has led to significant erosion of pukao. A scoria body from a possible pukao near Ovahe and several pukao from Vaihu and Tongariki have been subject to this form of erosion. Such processes have a long history: Spanish visitors to the island in 1770 noted the presence of several pukao in the intertidal zone, and this led them to conclude that the “stone of which these columns are made is not native to the island” (Corney et al. Reference Corney, de Haedo and Roggeveen1908). In 1955, the Norwegian Archaeological Expedition rescued the pukao at Vaihu from the intertidal zone (Heyerdahl and Ferdon Reference Heyerdahl and Ferdon1961). These pukao exhibit noticeably ablated surfaces.
Organisms such as algae, lichens, and domestic livestock have also played roles in the degradation of pukao. Algae and lichen leach out iron from red scoria, thus weakening the stone matrix, and the rhizomes or hyphae of lichens induce mechanical stress in the stone (Charola Reference Charola1994:45). Lichens are particularly good at obscuring and destroying petroglyphs through time, since they tend to smooth edges and obliterate fine detail. Only limited conservation has focused on removal of lichen from pukao, because it is difficult to remove lichen without crumbling the stone into which rhizomes have penetrated.
Between 1888 and 1933, the island was host to a large sheep ranch operation of the Compañía Explotadora de Isla de Pascua (Charola Reference Charola1994:27). For 45 years, the ranch administrators allowed 60,000 sheep to roam freely on the island. Coupled with the use of pukao scoria in the construction of historic walls to contain the herds, the sheep trampled over the archaeological record and broke pukao into smaller fragments. Today, grazing animals with access to some pukao continue to have damaging effects.
Many pukao now also contain Western graffiti. Most of the graffiti occurs in the quarry of Puna Pau, although its age is unclear.
Overall, these inorganic and organic processes have degraded the pukao seen today and highlight the importance of maintaining a record of remaining pukao variation. The Rapa Nui Landscapes of Construction Project (Hamilton Reference Hamilton2007, Reference Hamilton2013; Hamilton et al. Reference Hamilton, Thomas and Whitehouse2011) completed some of the most recent work with pukao as part of the broader project of examining the significance of Rapanui stone use. While this project involved detailed surface and subsurface mapping of the pukao quarry of Puna Pau, the published research did not focus on recording existing individual pukao form and surface details. Researchers have made line drawings of some pukao petroglyphs from five ahu (Lee Reference Lee1992; Van Tilburg and Lee Reference Van Tilburg and Lee1987), but the abundance and associations of these surface details and the form of these pukao are poorly documented. Additionally, the form and surface details of pukao from seven additional ahu (Hanga Poukura, Tarakiu, Ura Uranga te Mahina, Tongariki, Te Pito Kura, Anakena, and Tu'u Tahi) are largely unknown. To fully and precisely document the diversity of pukao in a short amount of time, we relied on SfM mapping. SfM mapping provided a cost-effective approach for salvaging data from pukao in remote locations with difficult close access. These data form a baseline for an understanding of past pukao transport and for an appreciation of the diversity of pukao petroglyphs.
THREE-DIMENSIONAL MODEL GENERATION
The generation of models for SfM mapping can be broadly separated into steps of data acquisition and image processing. In May–June 2014, we located and photographed 63 pukao identified during a GPS survey led by Hunt and Lipo in previous years. We used two Nikon D7000 cameras to produce approximately 10,000 photographs that each contained embedded GPS coordinates. We collected all photos from the ground and used tapes to make absolute measurements of pukao dimensions. Absolute measurements provide a reference for the scale that becomes embedded in the SfM models. The requirements for taking photographs useful for SfM are fairly simple: Each photo must be taken in sufficient sunlight and from an array of unique viewpoints with sufficient overlap (Agisoft Reference Agisoft2011). The degree of overlap that is sufficient depends on the nature of the object being mapped, but one typically wants to include 70–90% overlap between images. Minimally, one wants to ensure that every point on the object appears in at least three different images. Increasingly complex surfaces typically require more overlap and thus more photographs. Given the SfM's scale-invariant algorithm for photograph matching, the focal length and resolution of collected images can vary, which further eases data collection for SfM mapping. The distance from the object determines the detail that can be discriminated. The closer one takes images, the more detail will exist in the final model.
In our study of pukao, we used image-processing software (Agisoft PhotoScan 1.0.4, 2014, Agisoft LLC, St. Petersburg, Russia) to match the photographs and to extract a representation of the pukao in the form of a large collection of three-dimensional points (point clouds) and reconstructed surface meshes. Agisoft is one of a variety of software choices, but it is one that archaeologists have used successfully in other contexts. Models produced with Agisoft PhotoScan have comparable accuracy to those produced with laser scanning (Barsanti et al. Reference Barsanti, Remondino and Visintini2012; Brutto and Meli Reference Brutto and Meli2012; Galeazzi Reference Galeazzi2016) and to those produced with other SfM software (Curry and Gallaway Reference Curry and Gallaway2016; Green et al. Reference Green, Bevan and Shapland2014; Kersten and Lindstaedt Reference Kersten and Lindstaedt2012). Archaeologists have used Agisoft PhotoScan to map underwater landscapes (e.g., Balletti, Beltrame et al. Reference Balletti, Beltrame, Costa, Guerra and Vernier2015; Yamafune Reference Yamafune2016), terrestrial landscapes (e.g., Balletti, Guerra et al. Reference Balletti, Beltrame, Costa, Guerra and Vernier2015; Howland et al. Reference Howland, Liss, Najjar and Levy2015; Verhoeven, Doneus et al. Reference Verhoeven, Doneus, Briese and Vermeulen2012), and excavations throughout the world (e.g., De Reu, De Clercq et al. Reference De Reu, De Clercq, Sergant, Deconynck and Laloo2013; De Reu et al. Reference De Reu, De Smedt, Herremans, Van Meirvenne, Laloo and De Clercq2014; De Reu, Plets et al. Reference De Reu, Plets, Verhoeven, De Smedt, Bats, Cherretté, De Maeyer, Deconynck, Herremans and Laloo2013; Forte et al. Reference Forte, Dell'Unto, Issavi, Onsurez and Lercari2012; Koenig et al. Reference Koenig, Willis and Black2017; Roosevelt et al. Reference Roosevelt, Cobb, Moss, Olson and Ünlüsoy2015; Thomas and Kennedy Reference Thomas and Kennedy2016; Weßling et al. Reference Weßling, Maurer and Krenn-Leeb2013; Wilhelmson and Dell'Unto Reference Wilhelmson and Dell'Unto2015). Artifacts and features mapped using the software include rock art (e.g., Fritz et al. Reference Fritz, Willis and Tosello2016; Plets et al. Reference Plets, Gheyle, Verhoeven, De Reu, Bourgeois, Verhegge and Stichelbaut2012), earthen mounds (e.g., Magnani and Schroder Reference Magnani and Schroder2015), roads (e.g., Monterroso-Checa and Gasparini Reference Monterroso-Checa and Gasparini2016), and skeletal remains (e.g., Thanaphatarapornchai Reference Thanaphatarapornchai2012). The ease of using Agisoft PhotoScan has made this software popular also in community-based archaeology (e.g., Haukaas and Hodgetts Reference Haukaas and Hodgetts2016) and conservation (e.g., López-Romero et al. Reference López-Romero, Mañana-Borrazás, Daire and Güimil-Fariña2014).
Once we collected photographs of pukao, the next step involved aligning the camera positions for every photograph (Figure 3). During this step, the computer identifies points shared between photos and computes camera parameters from each photo, which includes relative position, focal length, and skew. The output is a sparse point cloud that displays the points shared by multiple photos. This step typically took between 3 and 13 hours on a standard laptop computer, and was dependent on the number of images being processed. Once aligned, the photographs were then assessed for alignment quality. Low-quality values are a consequence of low coverage or poor focus. We removed from further processing all images that had camera positions with focus-quality values lower than 0.5. In situations with significant photographic overlap, we disabled cameras that had quality values lower than 0.7.
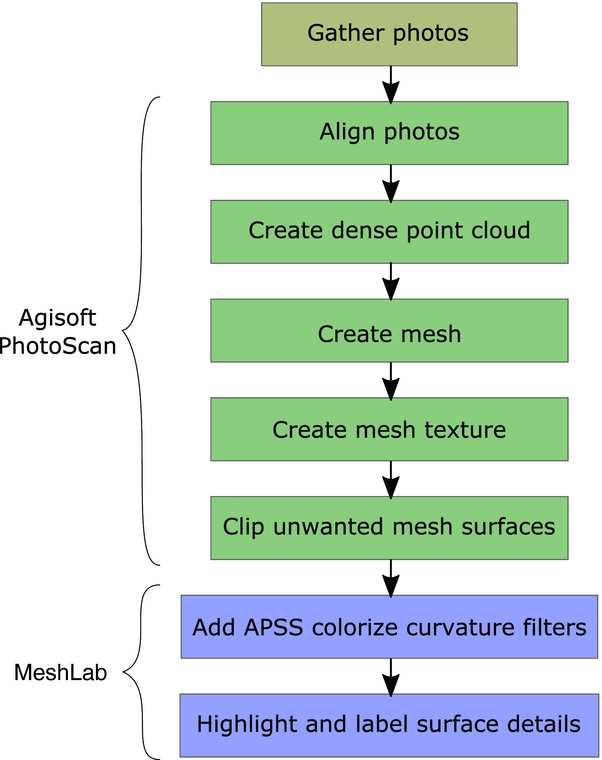
FIGURE 3. Flow chart of pukao model generation and analysis.
The third step of processing involved increasing the density of point clouds (Figures 3–4). During this step, the computer calculates additional depth information from each aligned photo and displays this information as points. We used aggressive filtering to remove outlying points while generating dense point clouds. The point cloud processing typically took between three and seven hours for each pukao.
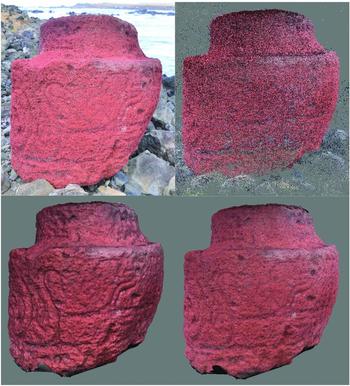
FIGURE 4. One of 198 photographs (upper left) used to generate a PhotoScan cloud of 400,510 points (upper right) that define pukao 18 at Vaihu. After creating the point cloud, it is possible to construct the mesh with approximately 500,000 vertices and one million faces (lower left) and add texture to this mesh (lower right).
The fourth processing step involves generating a surface representation of the object in the images. This surface representation takes the point cloud that was created in the previous step and connects the closest points into a network of polygons. We meshed the pukao as arbitrary surfaces using 1/15 of the points in the dense point cloud. Using more of the dense point cloud (1/5) produces more detailed meshes, but this approach frequently makes models difficult to view in external software. Using less of the dense point cloud (1/45) is less computationally expensive, but it limits the detail in the model. This step typically took about one hour. We then created a texture for the meshed surface by wrapping portions of the original images over the model using the mosaic texture-blending mode. This algorithm determines coarse spatial resolution textures by using weighted averages of textures from multiple photos. Meanwhile, the algorithm uses information from a single photo that is nearly normal to a given model surface to map texture in a higher spatial resolution. Finally, we manually isolated the pukao from surrounding features in the modeled environment by eliminating unwanted mesh surfaces (e.g., cloud and ground surfaces) through masking and clipping. Figure 5 includes images of all completed pukao models.
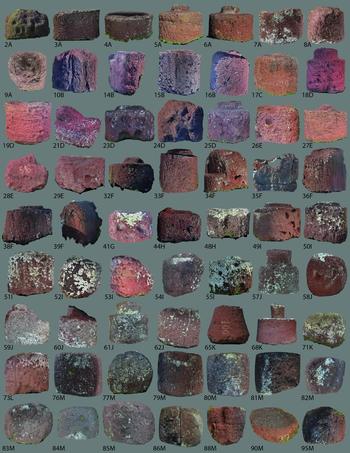
FIGURE 5. Models with textured mesh for all pukao. Note that models are numbered according to database entry and lettered according to location in Figure 2.
The final model has an internally consistent scale that may be georeferenced through ground control points (GCPs) collected in the field. This internal scale simply means that the model is proportional but lacks absolute size information. Often, however, one is interested in extracting direct metric measurements from models. This step can be achieved by applying a scale to the model using a known reference distance that is embedded in the model. Given that pukao morphology and not the relative positions of pukao is of interest, we used the scale bars visible in our photographs to scale the measurements that we derived from the digital models.
Analysis
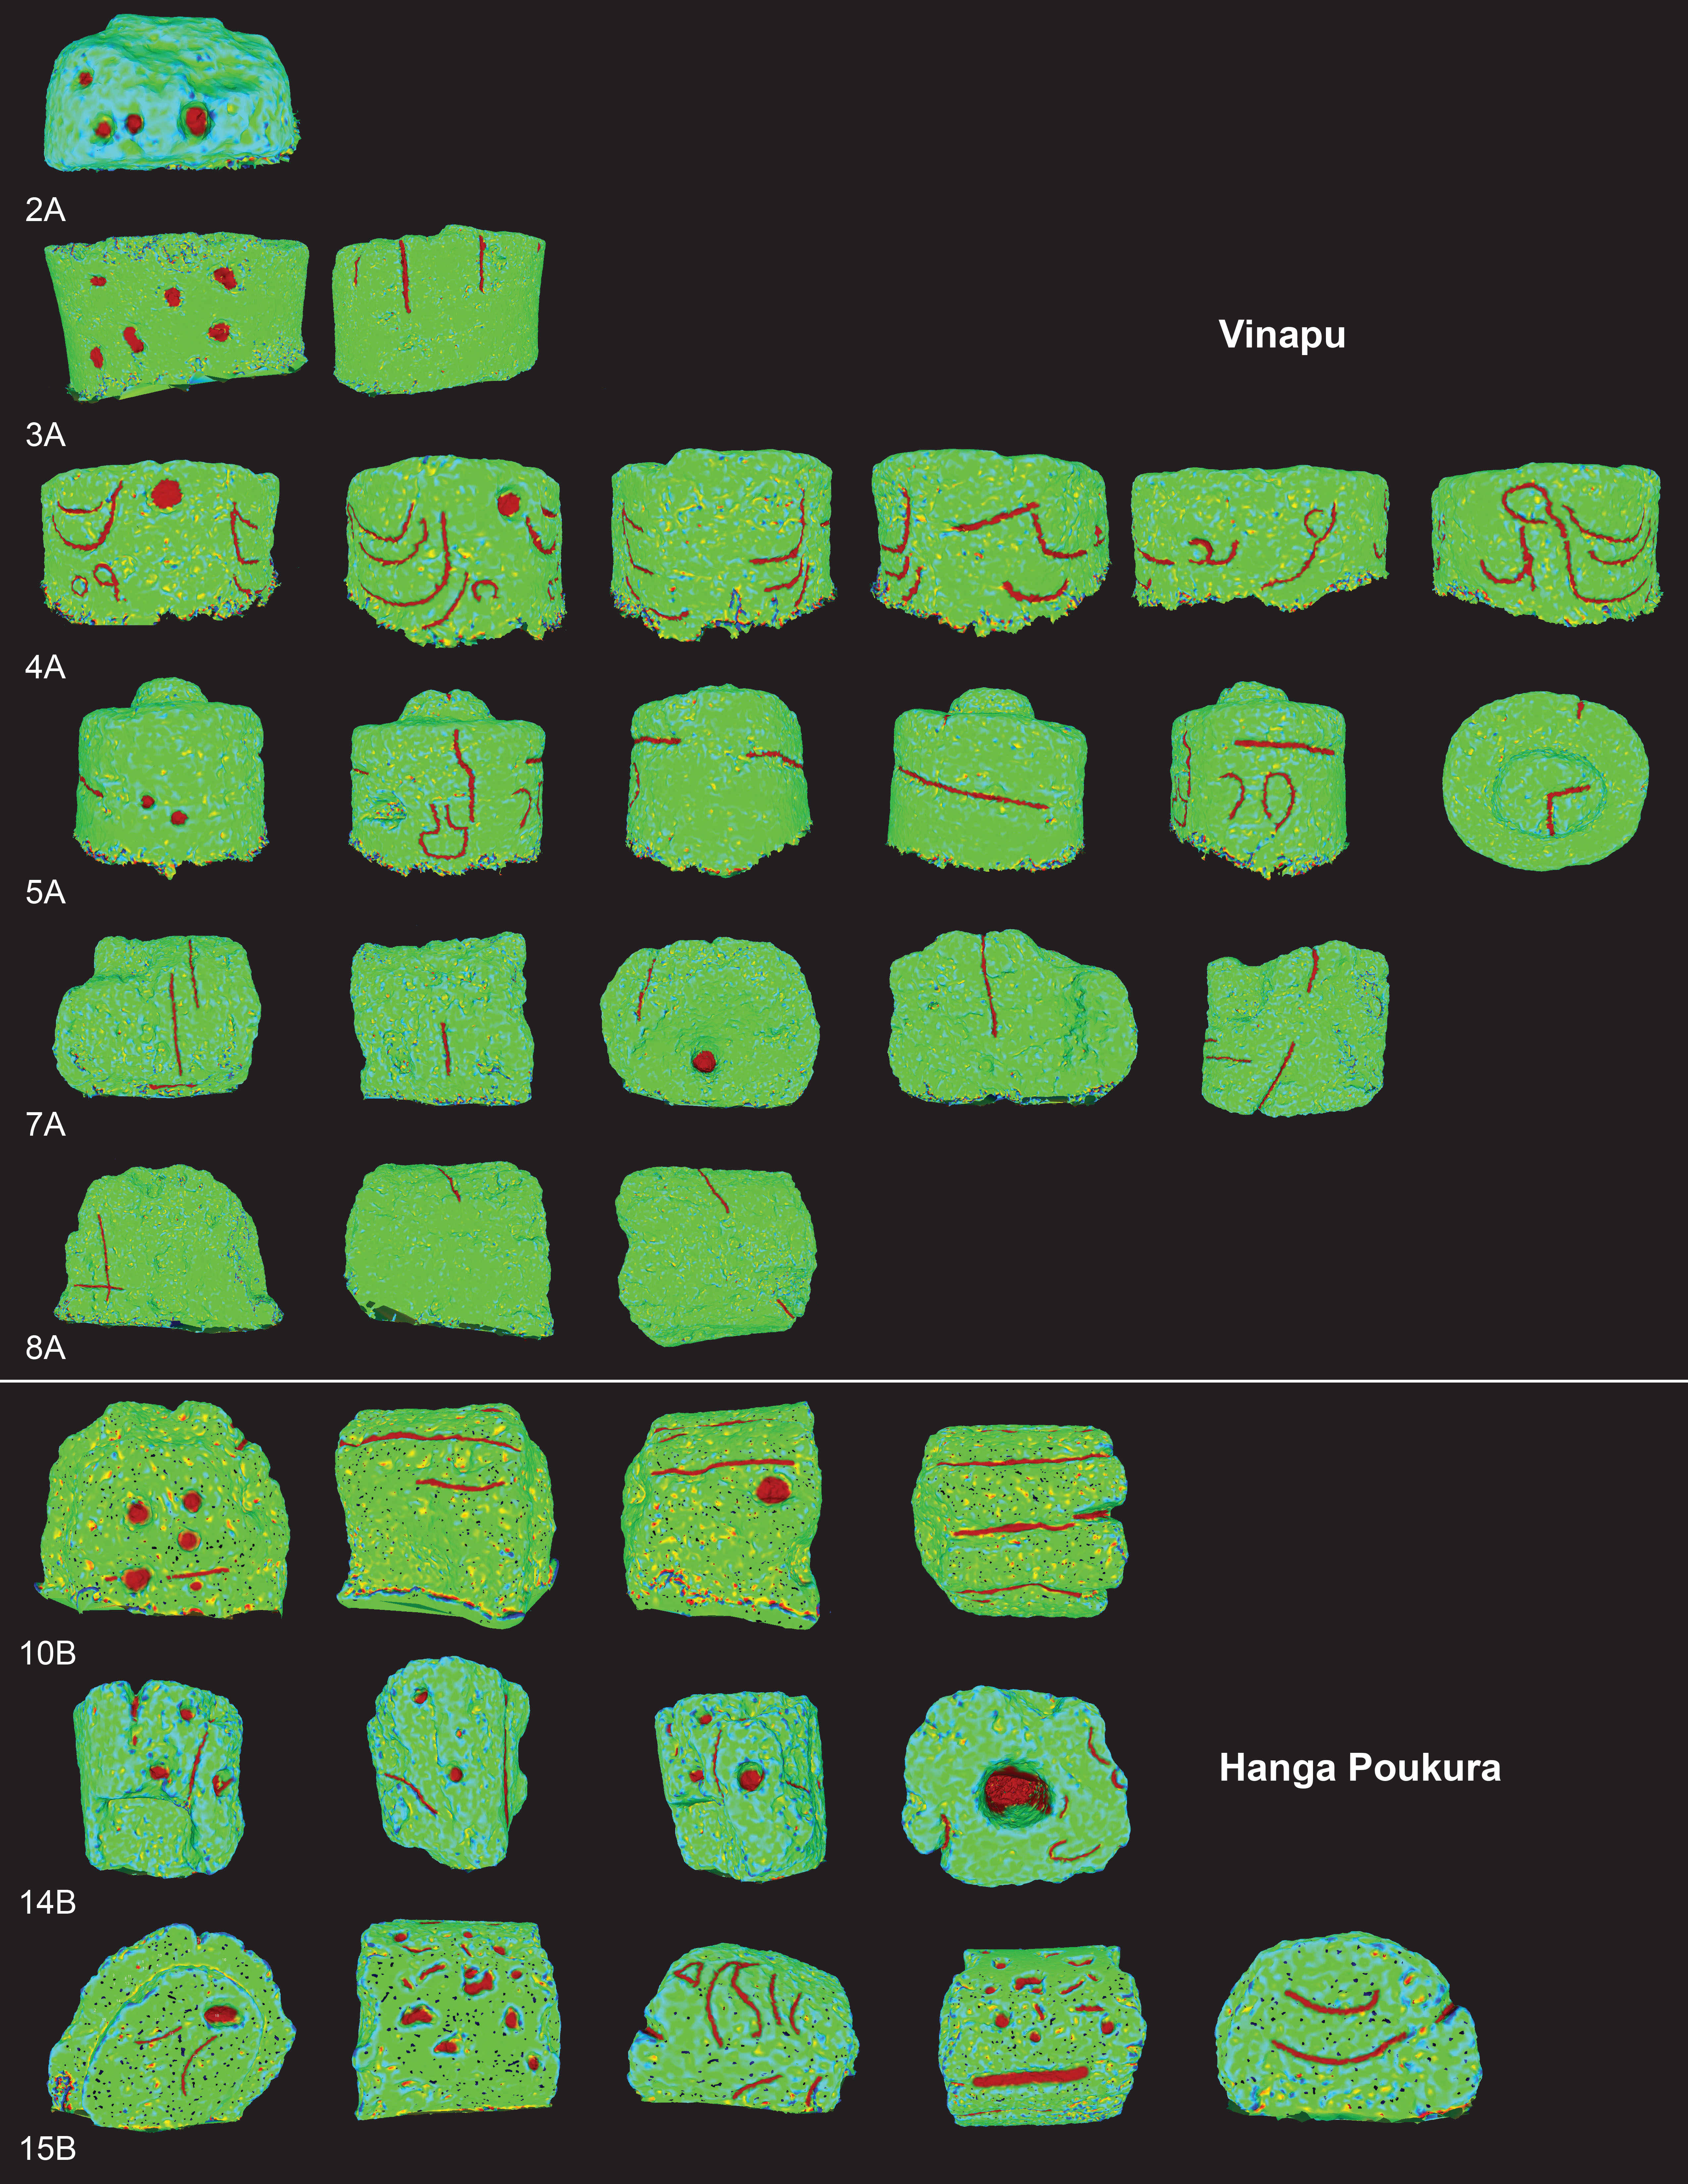
The product of SfM includes a texture layer that represents an approximation of the surface color and detail. This texture can be useful for documenting the surface condition, but it can also obscure topographic detail. In our analysis of pukao, we also simplified our models to isolate surface details. Using the open-source mesh processing tool MeshLab (Cignoni et al. Reference Cignoni, Callieri, Corsini, Dellepiane, Ganovelli and Ranzuglia2008), we achieved this simplification by eliminating the texture and color of the model and colorizing the model using the APSS colorize curvature filter (Figure 6). The APSS colorize curvature filter assigns colors to the vertices of the mesh based on the degree of curvature of the underlying surface. The effect enhances subtle and narrow etchings in rock art (Vilas-Estevez et al. Reference Vilas-Estevez, Vázquez-Martínez and Carrero-Pazos2016) and highlights many details in the pukao surface. Modifying the scale of this filter acts to highlight petroglyphs with different etched line thicknesses. We also marked etchings and indentations in the pukao by using the “z-painting tool,” which colors the surface of a mesh. Finally, we used the “PickPoints tools” in MeshLab to add numbered labels to each distinct cluster of markings.
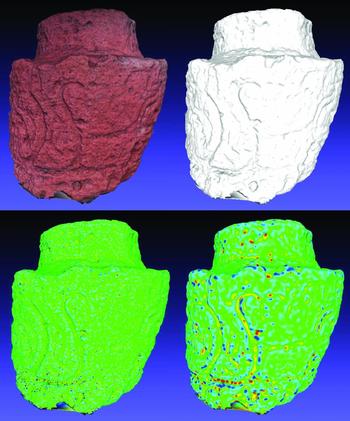
FIGURE 6. The mesh of pukao 18 with and without color (top). The colorless mesh can be colorized using the APSS colorize curvature filter in MeshLab to highlight etchings in the pukao surface (bottom). The scale of the curvature filter applied on the lower left image is 2, and that applied on the bottom right image is 8. Appropriate filters vary based on the width of a given etching.
We used the approach described here to study 50 pukao models and 13 red scoria bodies from Puna Pau (Supplemental Figures 1–6; Supplemental Videos 1–2). These models (1) record surface details that are not visible to the naked eye, (2) record details over complex surfaces, and (3) compare favorably with past sketches and paintings of pukao surface details.
While the coarse texture of the uniformly red scoria aids in the creation of pukao models through SfM mapping, the texture also complicates the detection of shallow surface details with the naked eye. Natural lighting, particularly at dawn and dusk, aids visual identification of surface details in the field. However, even under optimal natural lighting, the subtle nature of the features mixed with varied surface color and texture makes it exceptionally challenging to identify pukao details. Two advantages of SfM models are that they preserve surface details and that we can manipulate models to eliminate features that obscure details and to thus highlight subtle surficial variability (Figure 7). In this way, SfM greatly contributes to the recognition and recording of many previously unrecorded petroglyphs on Rapa Nui. From our studies, we now know that 27 of the 50 (54%) coastal pukao and 12 of the 13 (92%) large scoria bodies at Puna Pau are adorned with petroglyphs.
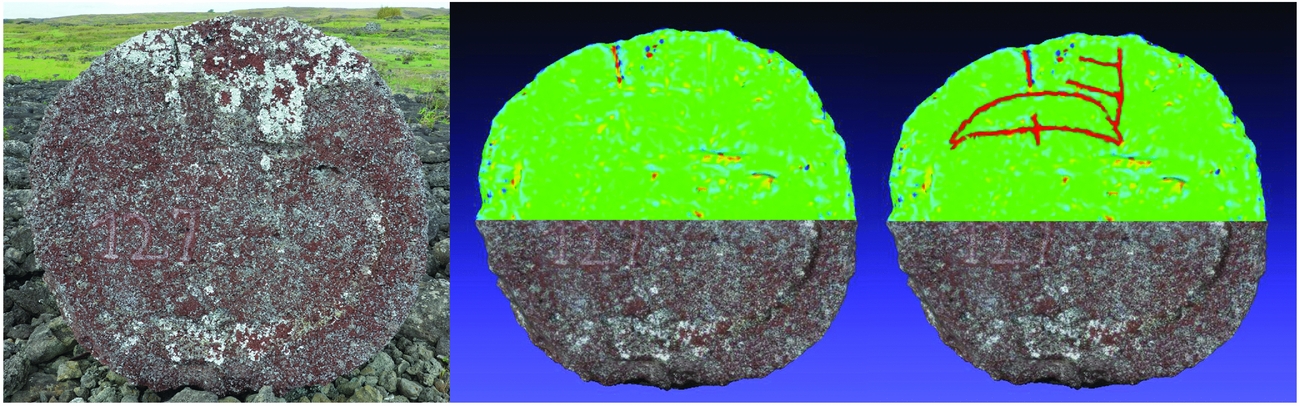
FIGURE 7. Photograph of the base of pukao 57 at Hekii (left). The APSS colorize curvature filter at scale 1.8 in MeshLab has been applied to the top half of the mesh (center). Note the two concave-down etchings that are faintly visible in the top half of the model in MeshLab (colored at right). These etchings and others like them are practically invisible to the naked eye.
Just as Fritz and colleagues (Reference Fritz, Willis and Tosello2016) use SfM to map complex cave surfaces, SfM reveals some of the details on complex surfaces of pukao. Some of the pukao petroglyphs, for example, consist of closed curved forms (Figure 8). These forms (see Figure 8) wrap around the sides and even top of the pukao, which makes documentation by sketching a difficult process that is prone to distortion. Additionally, pukao fragment 35F in Figure 8 would be difficult to sketch due to limited physical access. SfM mapping of this surface, however, provides a noninvasive approach that captures detailed information of this curved surface detail.
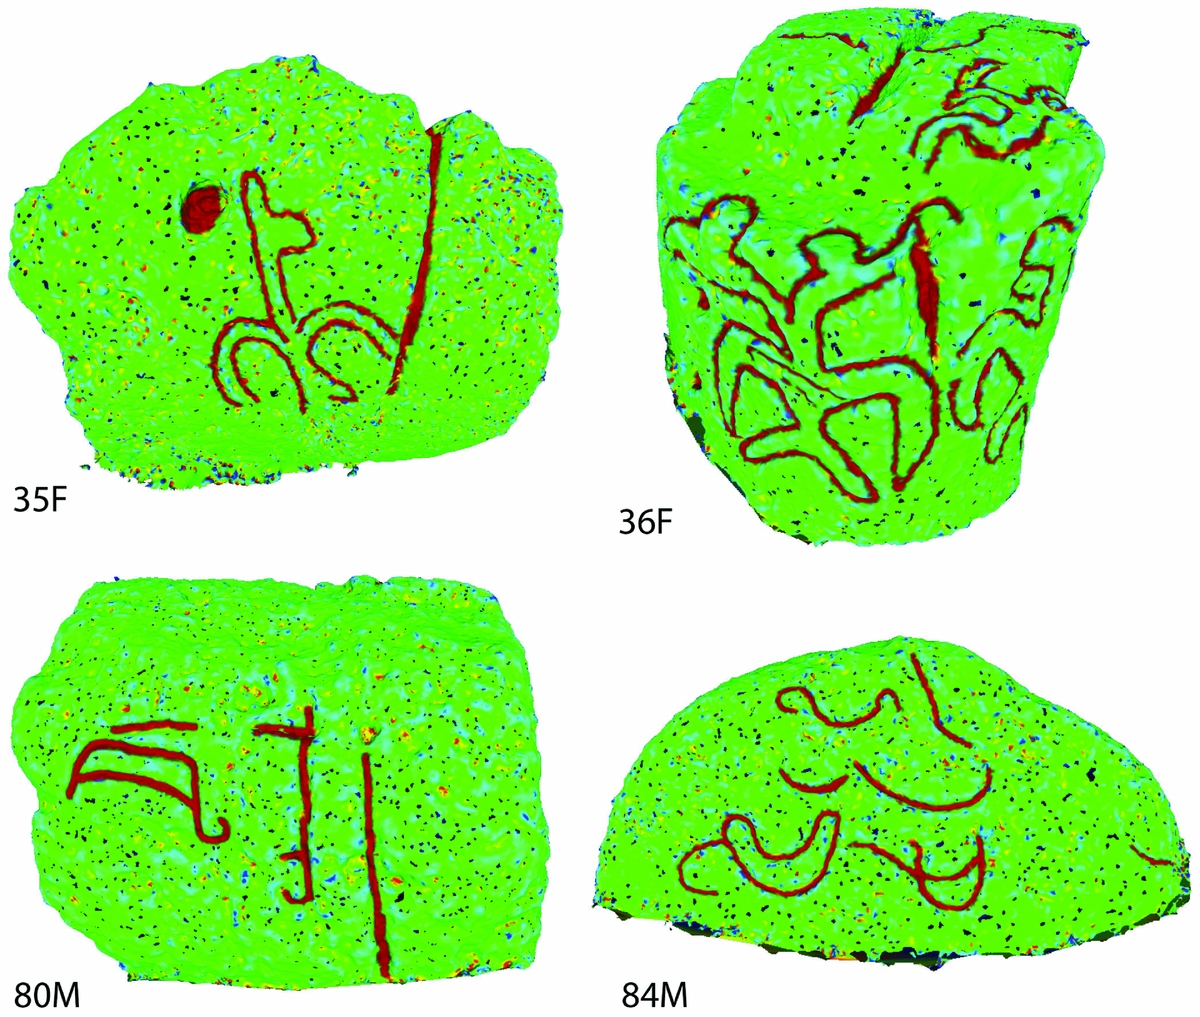
FIGURE 8. Various scoria bodies from Akahanga (F) and Puna Pau (M, see Figure 5) with closed curved form petroglyphs that have been marked in MeshLab using the z-painting tool. Van Tilburg and Lee (Reference Van Tilburg and Lee1987:143) refer to the forms from Akahanga as “birdman symbols,” but Lee (Reference Lee1992:20) refers to the outline in pukao 36 as a two-headed frigate bird.
Previous researchers have noted surface details on pukao, and the results of SfM mapping compare well with these past recordings. Linton Palmer (Reference Palmer1870:176) was the first visitor to Rapa Nui to report that fallen pukao were “all more or less marked by rude carvings of ships, birds, etc.” Van Tilburg and Lee (Reference Van Tilburg and Lee1987:142) have since sketched a variety of the petroglyphs on pukao and other scoria bodies from Puna Pau and five coastal ahu. Figure 9 compares a watercolor by Palmer with the SfM model for this scoria body and demonstrates the similarities and subtle differences in these final products. Our SfM models provide more surface detail and morphological information than do line drawings, and we have achieved greater coverage than previous sketching work.
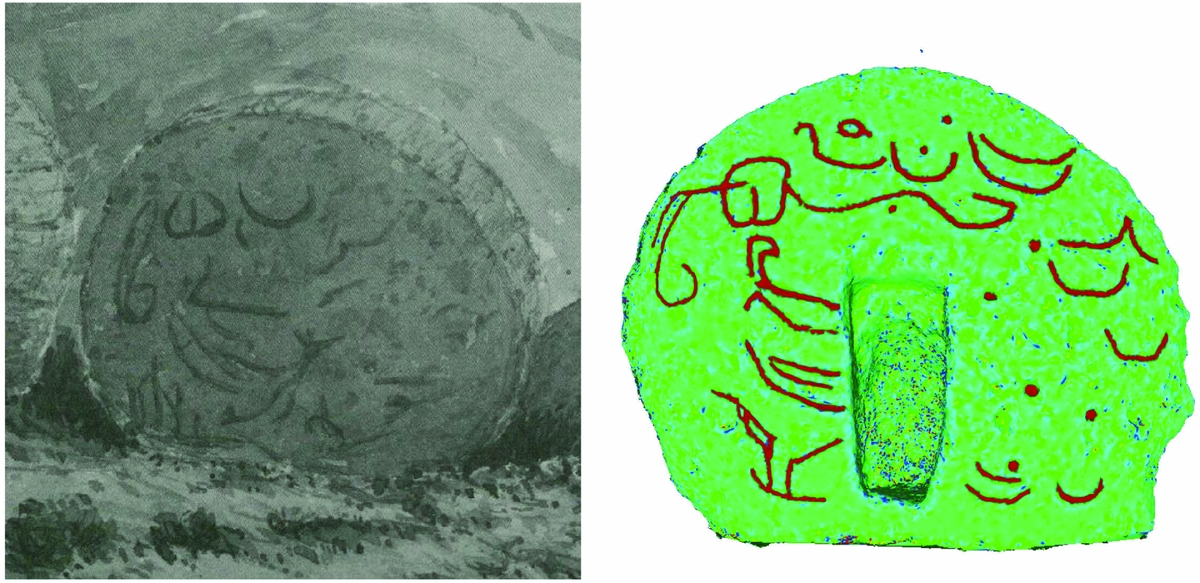
FIGURE 9. A watercolor from Linton Palmer's 1868 visit to the island (left, courtesy of the Royal Geographical Society, London) showing petroglyphs on a Puna Pau scoria body. The petroglyphs on this scoria body match those that we outlined on pukao 77 at Puna Pau. Note that the notch in this scoria body was carved sometime between 1868 and the present recording. Of the Puna Pau scoria bodies recorded through SfM mapping, 92% include petroglyphs. Jaussen interprets the abundant petroglyphs in Puna Pau as the “proprietary marks (rona) of the owners,” but their age is unclear (Métraux Reference Métraux1971:303).
Given that we were able to systematically document the surface variability on every accessible pukao on Rapa Nui, our study documents the variability that exists for pukao petroglyphs. We can see, in particular, quite a few isolated curved lines that have never been fully documented. Heyerdahl and Ferdon (Reference Heyerdahl and Ferdon1961:237) mention the presence of these kinds of markings on fallen pukao and describe them as “incised crescent-shaped boats.” Such a qualitative label masks their diversity, which includes a range of different inflection points and curvature tightnesses. Similarly, Van Tilburg and Lee (Reference Van Tilburg and Lee1987:143) document pukao located at Puna Pau and five coastal ahu, and they emphasize the “high degree of conformity between and among the designs at all six sites.” From this pattern, Lee (Reference Lee1992:126) speculates that the widespread “canoe symbol marked a victory or conquest over another section of the island,” seeming to fit narratives for a violent precontact past on Rapa Nui (e.g., Diamond Reference Diamond2005; Flenley and Bahn Reference Flenley and Bahn2003). Because our study allows us to create more detailed and comprehensive documentation of pukao, we can see that, while every scoria body SfM model with petroglyphs includes evidence of isolated curved lines, the curvature, number of inflection points, and associations of these isolated curved lines are diverse (Figure 10). This diversity of forms cannot represent a standard territory marker and removes pukao petroglyphs from a narrative that involves widespread territorial violence during Rapa Nui's precontact past. Thus, details from SfM models, in contrast to those produced by hand recording, greatly expand the dataset from which we generate our knowledge about the past of the island.
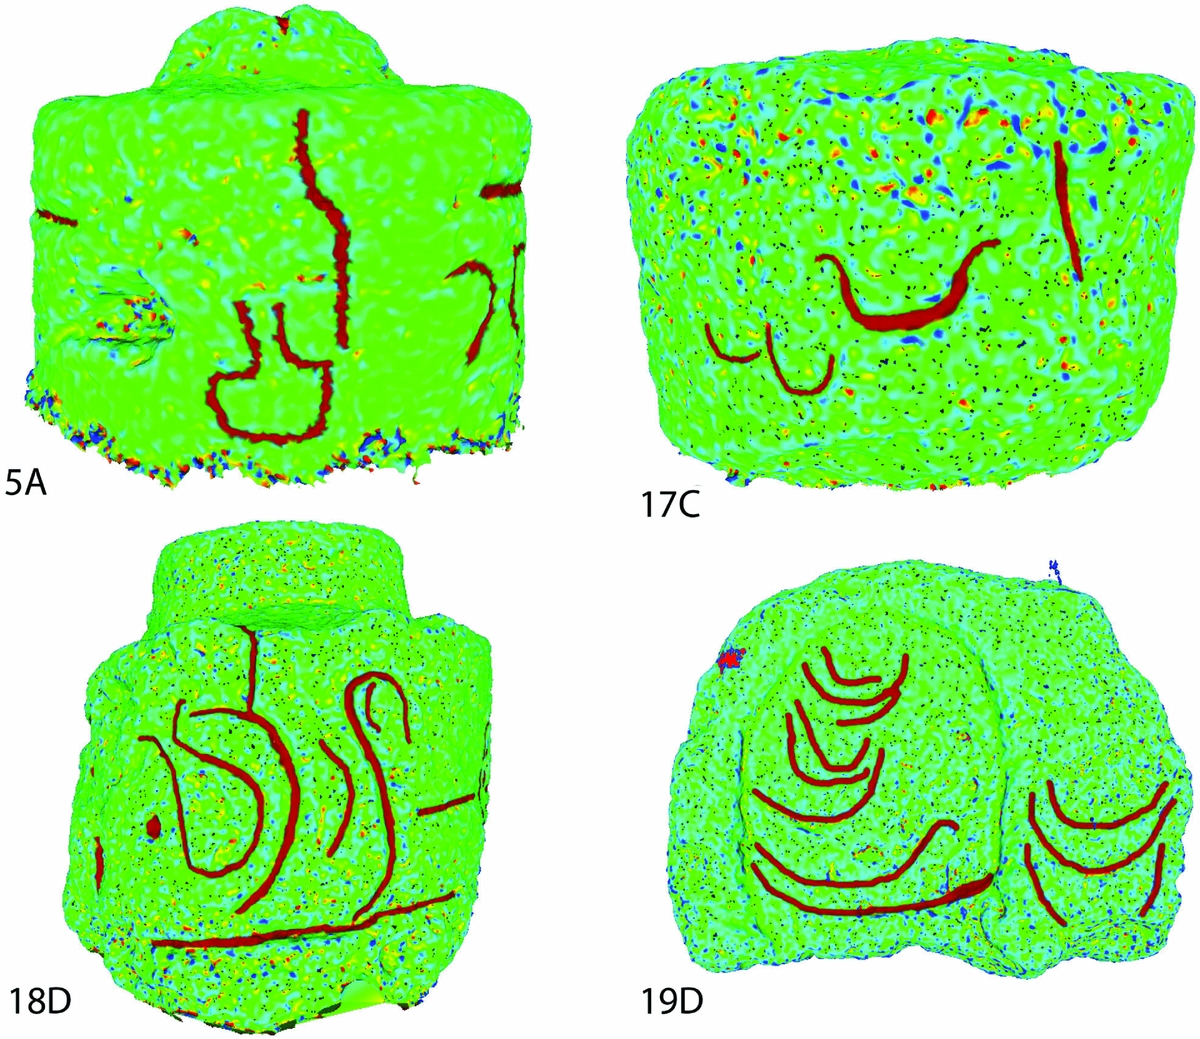
FIGURE 10. Various scoria bodies from Vinapu (A), Tarakiu (C), and Vaihu (D, see Figure 5) with isolated curved line petroglyphs that have been marked in MeshLab using the z-painting tool. Lee (Reference Lee1992:122,126) writes that “The majority of designs are simple canoe shapes” and speculates that their widespread distribution may be because they “marked a victory or conquest over another section of the island.” However, note the extensive variability in the form of curved line petroglyphs among those shown above.
CONCLUSION
SfM mapping of artifacts fulfills the goals of both conservation and analysis with its detailed coverage and ease of reducing detail in meaningful ways. This technique is efficient, cost-effective, and minimally invasive. As illustrated in the discussion regarding pukao, SfM mapping also produces reliable results that record detail over complex surfaces and reveal subtle surface details that may be practically invisible to the naked eye. The great diversity of petroglyphs suggests that it is unlikely that these etchings represent territorial markers associated with warfare. The details in the pukao SfM models also provide the empirical basis for an understanding of past pukao transport. Further research can enhance the existing SfM models by mapping pukao surfaces that are currently concealed. Additionally, by remapping pukao in the future and comparing future models to those produced in 2014, it will be possible to track changes in lichen growth and pukao form and thus identify conservation priorities. Given its various merits, SfM mapping should become a standard recording technique.
Acknowledgments
This work was funded in part by NSF Grant #1005258. We also thank the 2014 NSF-REU Geospatial Research and Mapping group for their support during our field season on Rapa Nui. We are also grateful for the financial support to Hixon for this research from the University of Oregon Center for Teaching and Learning Undergraduate Research Fellowship. Our work was sponsored by the Padre Sebastian Englert Anthropological Museum and conducted in collaboration with CONAF, the Consejo de Monuments, the office of the Provincial Governor of Easter Island, and the Consejo de Ancianos.
Data Availability Statement
MeshLab and PhotoScan files associated with all pukao models are available for download at Binghamton University's open repository (http://orb.binghamton.edu/anthropology_fac/31/). Pukao models may be viewed online on Sketchfab (https://sketchfab.com/clipo/models). Photographs are available upon request.
Supplemental Materials
For supplemental material accompanying this paper, visit https://doi.10.1017/aap.2017.28.
Supplemental Figure 1. Renderings of pukao from Vinapu and Hanga Poukura. Each row shows the sides of individual pukao that bear figures and carvings.
Supplemental Figure 2. Renderings of pukao from Hanga Poukura, Tarakiu, Vaihu, and Ura Uranga te Mahina. Each row shows the sides of individual pukao that bear figures and carvings.
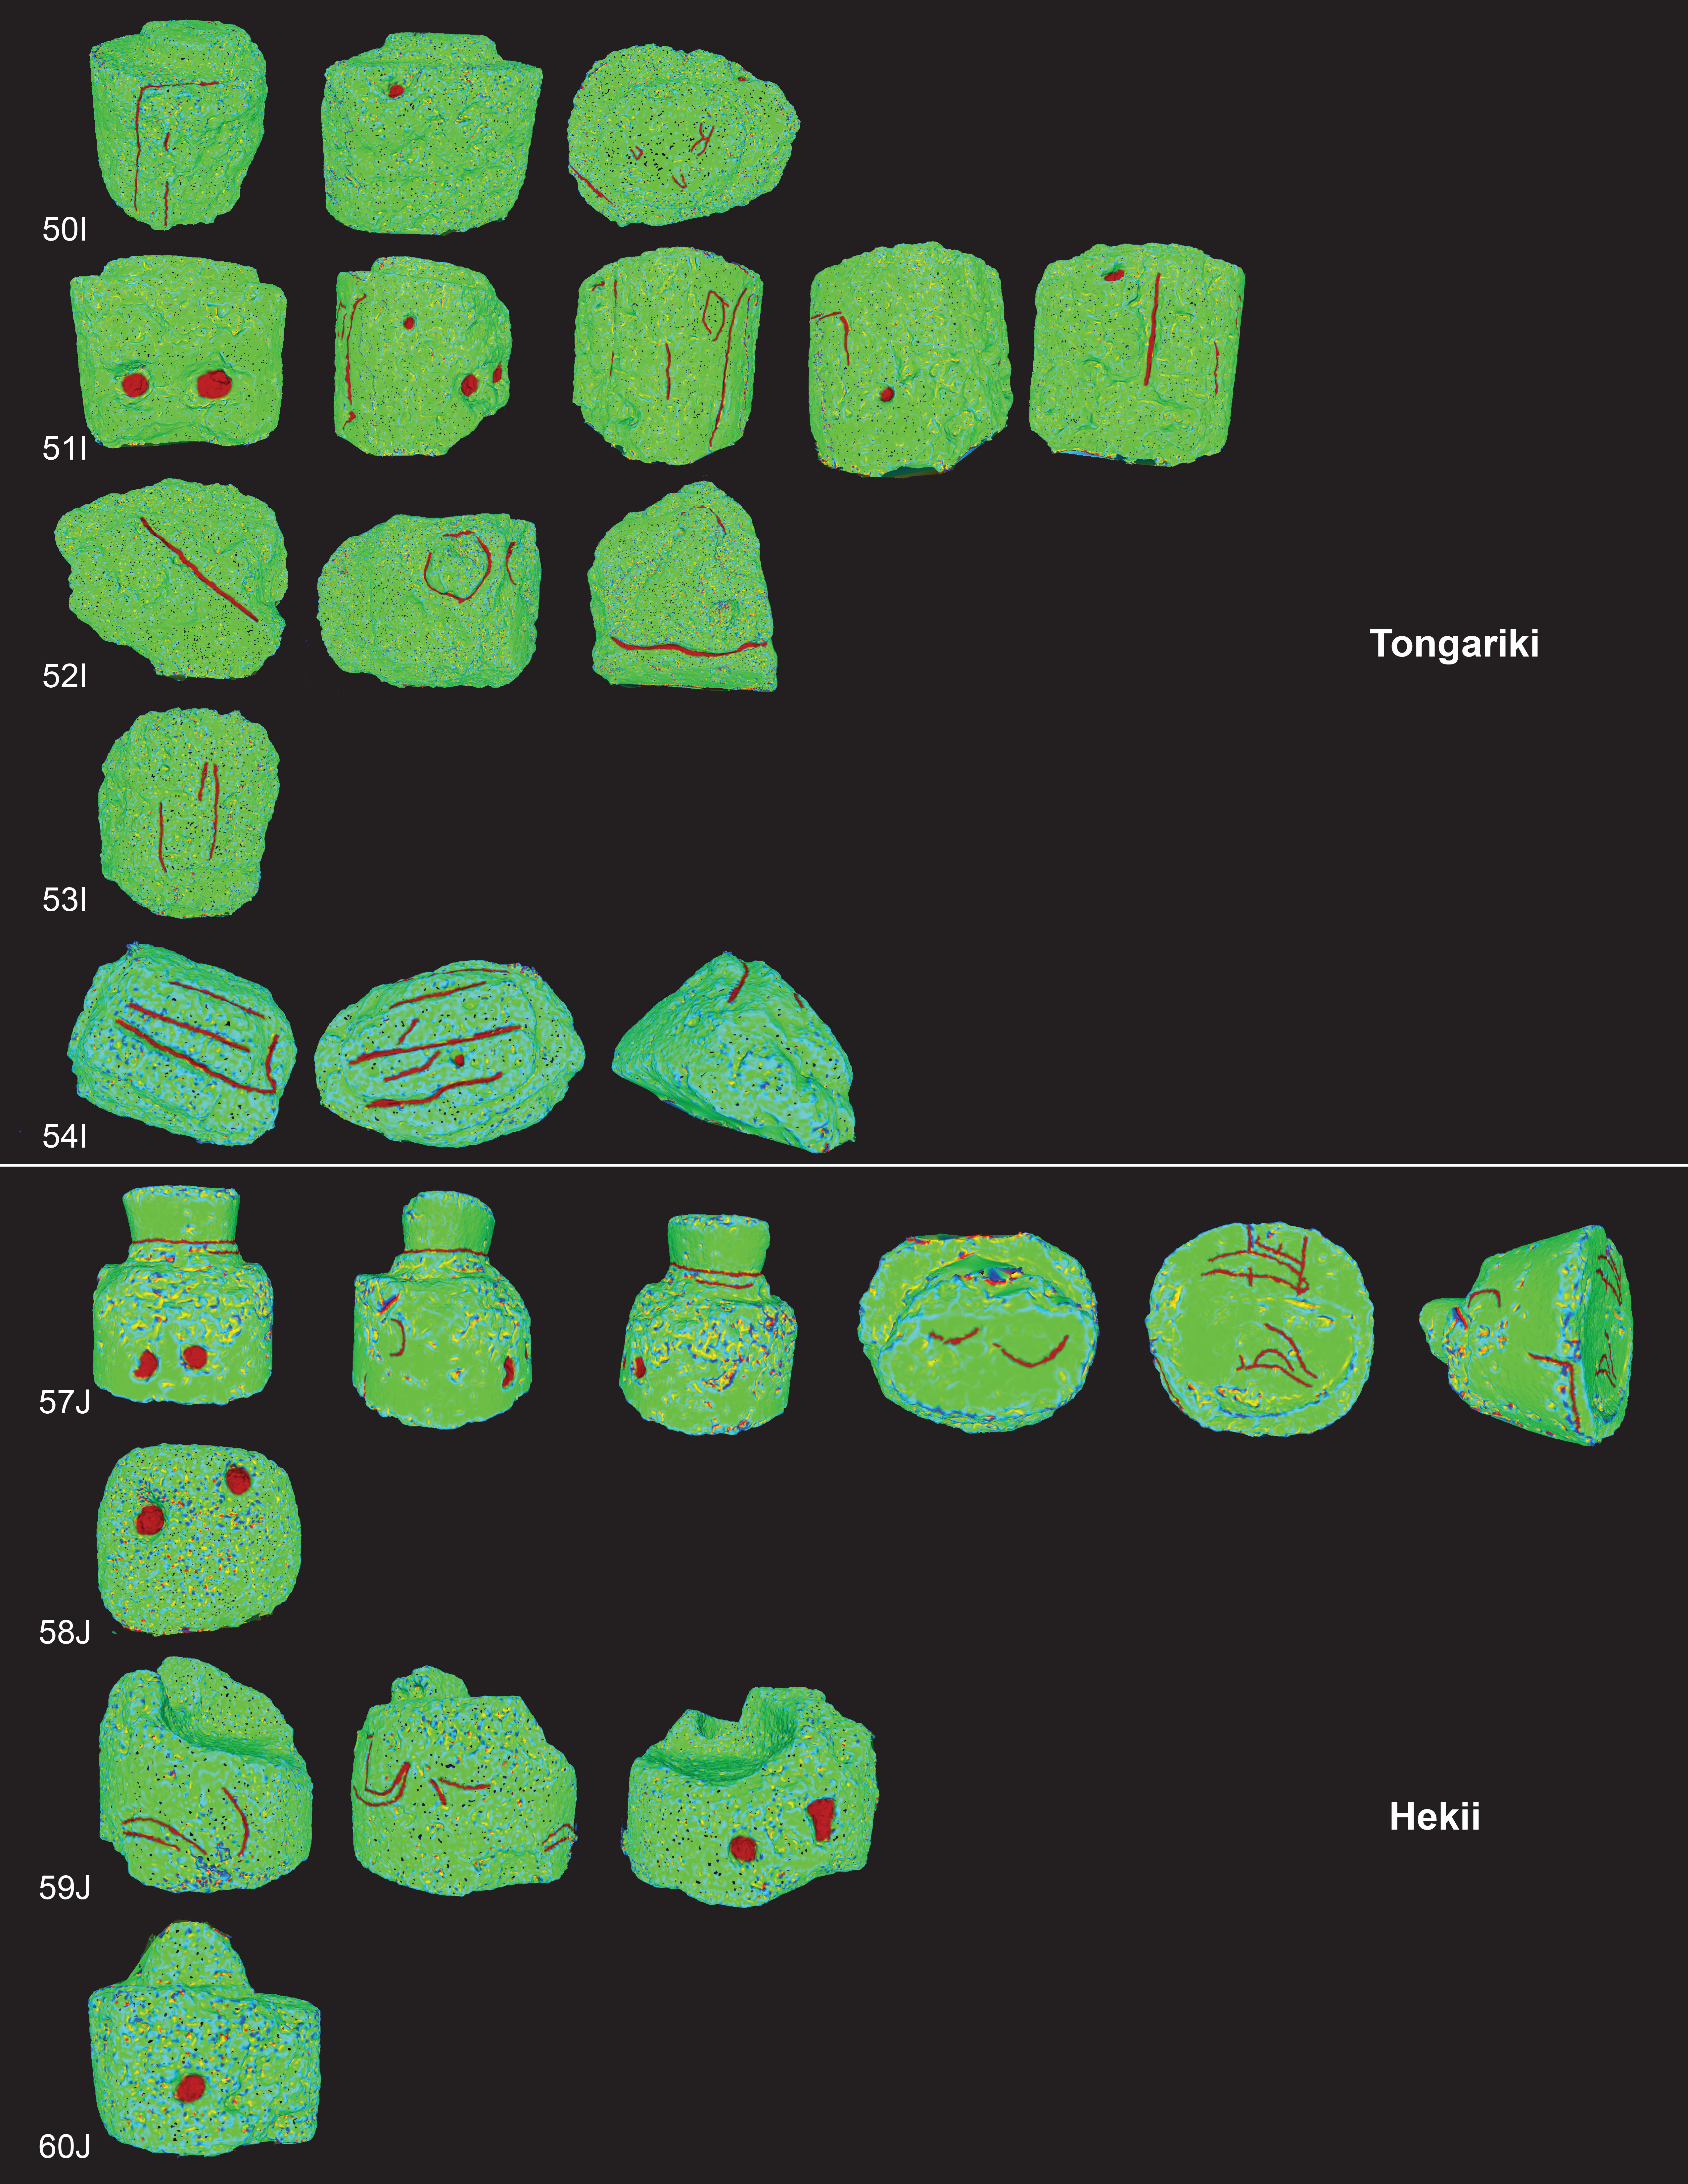
Supplemental Figure 3. Renderings of pukao from Akahanga, Tu'u Tahi, One Makihi, and Tongariki. Each row shows the sides of individual pukao that bear figures and carvings.
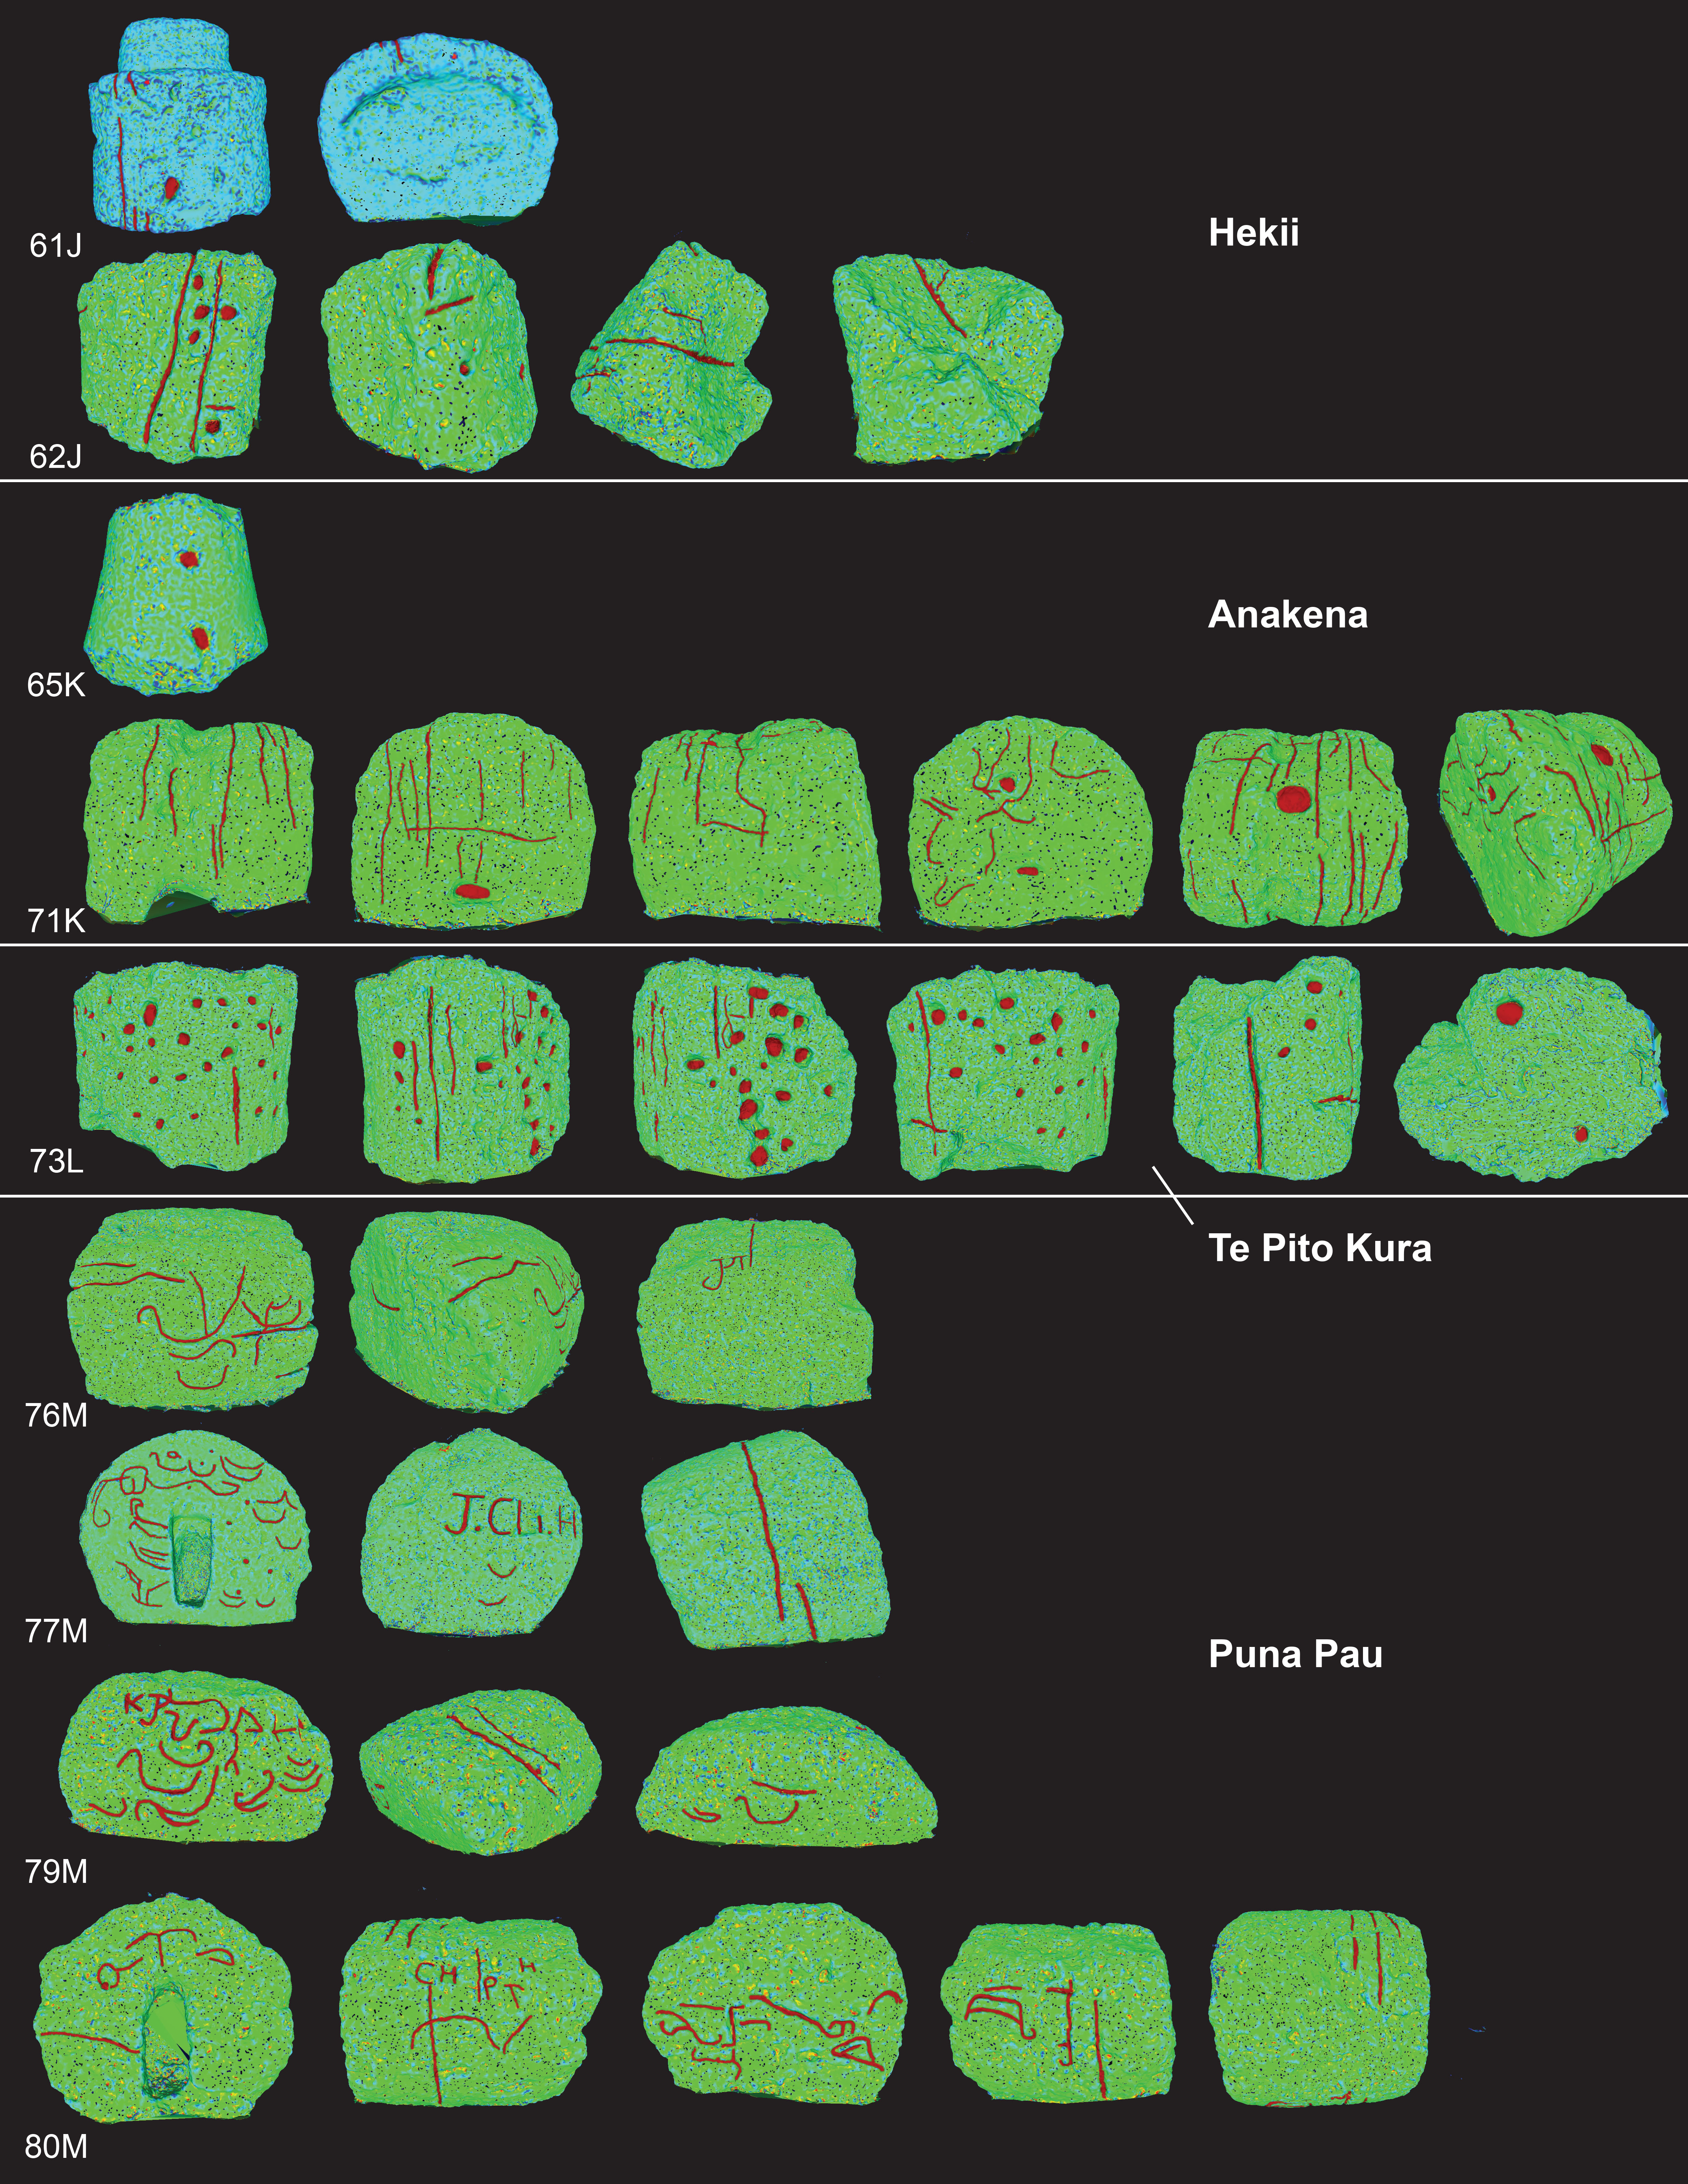
Supplemental Figure 4. Renderings of pukao from Tongariki and Hekii. Each row shows the sides of individual pukao that bear figures and carvings.
Supplemental Figure 5. Renderings of pukao from Hekii, Anakena, Te Pito Kura, and Puna Pau. Each row shows the sides of individual pukao that bear figures and carvings.
Supplemental Figure 6. Renderings of pukao from Puna Pau. Each row shows the sides of individual pukao that bear figures and carvings.
Supplemental Video 1. Three-dimensional rendering of pukao 18D from Vaihu.
Supplemental Video 2. Three-dimensional rendering of pukao 49I from Tongariki.