INTRODUCTION
Tropical rainforests constitute a luxuriant equatorial biome with an extremely diverse array of vegetation and rich endemism. These distinctive rainforests are at present found mainly on detached fragments of Gondwanaland, a supercontinent during the Palaeozoic and early Mesozoic eras, excluding Southeast Asia (Corlett and Primack, Reference Corlett and Primack2006). The Western Ghats (WG) in peninsular India preserve a sizeable relic of these tropical evergreen rainforests, a product of millions of years of evolution (Prasad et al., Reference Prasad, Farooqui, Tripathi, Garg and Thakur2009; Farooqui et al., Reference Farooqui, Ray, Farooqui, Tiwari and Khan2010, Reference Farooqui, Pattan, Parthiban and Srivastava2014) that have been a centre of alpha diversity (Ghate et al., Reference Ghate, Joshi and Gadgil1998; Myers et al., Reference Myers, Mittermeier, Mittermeier, da Fonseca and Kent2000; Bossuyt et al., Reference Bossuyt, Meegaskumbura, Beenaerts, Gowerdd, Pethiyagoda, Roelamts and Mamaert2004; Prasad et al., Reference Prasad, Farooqui, Tripathi, Garg and Thakur2009). The WG, recognized as a UNESCO World Heritage Site and one of the eight “hottest biodiversity hot-spots” (Myers et al., Reference Myers, Mittermeier, Mittermeier, da Fonseca and Kent2000), comprise a continuous mountain range that runs about 1600 km north–south along the western coastline of India (Thomas and Palmer, Reference Thomas and Palmer2007), sheltering 12 national parks and 44 wildlife sanctuaries. The WG include 2600 (75%) out of 3500 total plant species in the subcontinent, of which 1180 species out of 1300 (85%) show endemism (Blasco, Reference Blasco1971).
In the southern part of the WG, a unique kind of vegetation called the shola forest–grassland complex preserves a rich extant storehouse of endemic biodiversity. The word shola is derived from the Tamil word cõlai, meaning “thick vegetation canopy.” The most typical shola occurs on the hilltops and plateaus of the Nilgiris at altitudes above 1800 m asl (Kumaran et al., Reference Kumaran, Limaye, Nair and Padmalal2008) and consists of undulating montane grasslands contiguous with stunted patches of tropical evergreen forest. The vast root systems of the shola help to retain runoff and prevent soil erosion, and therefore play an important role in supplying the headwaters of rivers and maintaining soil moisture (Swarupanandan et al., Reference Swarupanandan, Sasidharan, Chacko and Basha1998). The shola complex falls within the Nilgiri Biosphere Reserve and is of ecological importance, providing a highly distinctive and extensive spectrum of habitats. The Nilgiri biome harbours 208 (55%) endemic plant species out of 365 species (Blasco, Reference Blasco1971), of which many are rare, endangered, or at the brink of extinction. Once widespread, the shola biome is dwindling as a result of natural changes and human activities (Pramod et al., Reference Pramod, Daniels, Joshi and Gadgil1997). Climate change seriously jeopardizes the shola forests by affecting their microclimate and changing rainfall regimes. These alterations include increased variability in duration, magnitude, and timing of the monsoon rainfall.
Climate change has had a discernible impact on monsoon systems, consequently affecting the forest cover and vegetation. The Indian monsoon system, an important feature of global atmospheric circulation and the major seasonal climatic event across the Indian subcontinent is a manifestation of seasonal migration of the intertropical convergence zone (ITCZ) (Gadgil, Reference Gadgil2003). The ITCZ, a subsystem of the global monsoon, is a deep, convective, cumulus cloud band near the equator where northeast and southeast trade winds converge. On seasonal time scales, the ITCZ migrates towards the warming hemisphere between average latitudes of 20°N in summer and 8°S in winter, accompanied by the southwest monsoon (onset phase/summer monsoon) and the northeast monsoon (retreat phase/winter monsoon), respectively, over the Indian landmass. The Nilgiris district receives rainfall from both monsoons (Schneider et al., Reference Schneider, Bischoff and Haug2014) following the seasonal march of the sun and maximum surface heating (Gadgil, Reference Gadgil2003). The mean latitudinal position of the ITCZ and the intensity of convective activity control the onset, strength, duration, variability, and termination of the monsoons (Fleitmann et al., Reference Fleitmann, Burns, Mangini, Mudelsee, Kramers and Villa2007). Variation in the mean latitudinal position of the ITCZ affects the tropical climate on a variety of temporal scales, ranging from annual to millennial. On longer time scales, palaeoclimate records demonstrate that the shift in mean latitudinal position of the ITCZ was similar, moving towards the differentially warming hemisphere and accompanied by significant changes in the hydrological cycle.
The tropical rainforests of the WG, particularly those of the shola, which receive incessant rains from both monsoons, are influenced by effects of variability in rainfall regime over longer time scales that could alter species richness. Annual rainfall and its seasonality are major determinants of species richness and diversity (Davidar et al., Reference Davidar, Rajagopal, Mohandass, Puyravaud, Condit, Wright and Leigh2007). The rainforests are more sensitive to great climatic diversity like drought (Meir et al., Reference Meir, Wood, Galbraith, Brando, Da Costa, Rowland and Ferreira2015), are not resistant to water deficits for an extended period, and change in response to anomalously lower, prolonged, or recurrent precipitation (Angeler and Allen, Reference Angeler and Allen2016) by favouring deciduous species. They are dynamic and undergo directional shifts in structure and composition over decades to millennia (Feeley et al., Reference Feeley, Wright, Supardi, Kassim and Davies2007; Allen et al., Reference Allen, Dupuy, Gei, Hulsho, Medvigy, Pizano and Salgado-Negret2017). Thus, high-amplitude regional rainfall and seasonality gradients due to short-term weather patterns or long-term climate oscillations significantly affect the ecologically sensitive shola, as do regional and local drivers. In addition, present-day sizeable threats to the shola forests result from the combined effects of frost, fire, grazing, invasive species, clearance for agriculture, fragmentation, encroachment, and the prevention of regeneration by rapid soil erosion (Karunakaran et al., Reference Karunakaran, Rawat and Uniyal1998; Jose, Reference Jose2012). Above all, silviculture has transformed these biodiverse forests into commercially valuable plantations of exotic trees. Hence, the shola forests, which took several thousands of years to evolve into their present state, are changing and shrinking at an alarming rate, resulting in loss of habitat for many species. The floristic composition, representing an evergreen forest climax community (Champion, Reference Champion1936), is not regenerating, so the biome is dying and is befittingly termed a “living fossil” community (Vishnu-Mittre and Gupta, Reference Gupta1968).
The pace at which the evergreen forests are declining needs to be monitored and evaluated. Reconstruction of past vegetation successions can provide insight into the relationship between changing climatic conditions over thousands of years and the rate and direction of the long-term vegetation changes (Overpeck, Reference Overpeck1993). Palynological evidence reveals the changing patterns of vegetation on late Quaternary landscapes and provides ample witness (Jacobson and Grimm, Reference Jacobson and Grimm1986) to vegetational changes that are not only climatically controlled but also ecologically mediated by local events such as fire and other disturbances. The study of pollen in stratified lake sediments provides a means for tracing the history of plant communities (Moore et al., Reference Moore, Webb and Collinson1991).
In this paper, quantitative records of sediment textural data, pollen abundance, and δ13C values are interpreted in a 14C-dated lake sediment core spanning ~29,800 cal yr BP. This paper is an attempt to reconstruct the palaeo-vegetation and palaeoclimate of Parsons Valley Lake region in the Nilgiri Hills, in order to illustrate the influence of the climate system on the vegetation, so as to aid in predicting the effects of future climate change.
STUDY AREA
Parsons Valley Lake (11°23′15.69″N, 76°36′10.8″E) lies in the Udhagamandalam Taluk of the Nilgiris District, Tamil Nadu, amidst the shola forests. This freshwater lake lies about 7 km east of Mukurthi National Park in the eastward realm of the WG (Fig. 1). The lake basin, irregular in shape with several bifurcating arms, measures ~3.75 km in length and ~1.5 km at its widest, covering an area of 202 hectares with an average surface elevation of 2200 m asl.
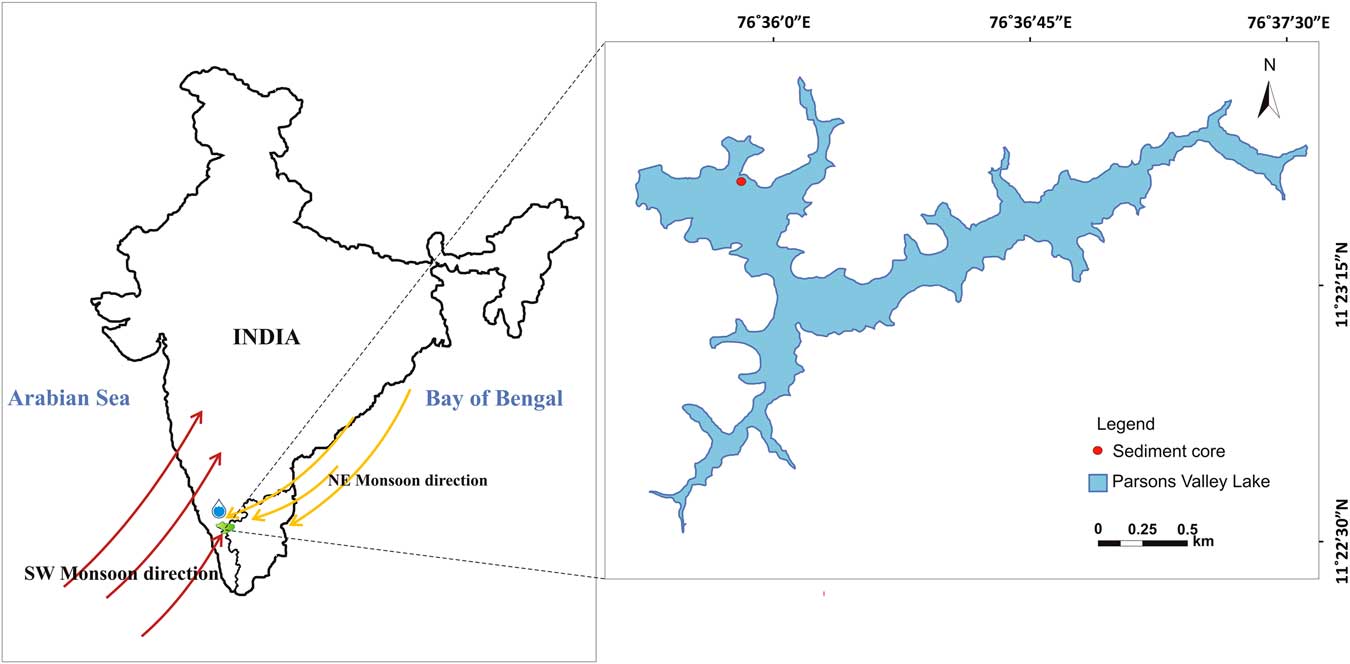
Figure 1 Location map of the Parson’s Valley Lake in the Nilgiri Hills, Tamil Nadu, India.
The geologic sediment in the lake bed and around the catchment is black in colour, due to the accumulation of humus in the top layers of shola soils. The black soil of this higher elevated western region, classified as an Andisol by Caner and Bourgeon (Reference Caner and Bourgeon2001), is highly acidic in nature, with pH ranging from 4.5 to 6 (Mathur et al., Reference Mathur, Francis, Raj and Naithan1984). The shola’s soil texture varies from clay to clay-loam and loam and contains high percentages of iron and alumina along with maximum soil moisture and soil temperature when compared with all other vegetative covers. The bedrock is composed of Precambrian metamorphic rocks, mainly charnockites (gneisses, charnockites, and crystalline schist) (Naqvi and Rogers, Reference Naqvi and Rogers1987; Vasanthy, Reference Vasanthy1988) belonging to the Archean continental landmass.
The climate is classified as tropical monsoon type (Amw) characterized by heavy rainfall and a short dry winter under Köppen climate classification. High elevation of this region results in low temperatures (minimum10.0°C, maximum 29.8°C), which are driven yet lower by the excessive atmospheric moisture content (humidity up to 90%; Suryaprakash, Reference Suryaprakash1999) resulting from the thick vegetation cover. The total annual rainfall in this region ranges between 2500 and 5000 mm (Caner et al., Reference Caner, Lo Seen, Gunnell, Ramesh and Bourgeon2007), and it receives its principal precipitation from the southwest monsoon and less intense northeast monsoon (derived from cooler air mass flowing off the Tibetan Plateau and adjacent regions in autumn, which picks up moisture from the Bay of Bengal and is important for precipitation in eastern parts of the Ghats; Kumaran et al., Reference Kumaran, Limaye, Nair and Padmalal2008), leading to luxuriant evergreen rainforests. The dominant overstory species in the shola belong to the members of Symplocaceae, Dipterocarpaceae, Lauraceae, Myrtaceae, Myrsinaceae, Oleaceae, and Rubiaceae, while understory species are dominated by Fabaceae, Asteraceae, and Acanthaceae. Monocotyledonous understory species are dominated by Cyperaceae, Poaceae, and Orchidaceae (Bunyan et al., Reference Bunyan, Bardhan and Jose2012). Protected shola forests are in many cases surrounded by degraded forests and silviculture plantations of exotic Acacia, Pinus, and Eucalyptus. The natural vegetation of the region ranges from tropical evergreen to moist deciduous forests and swamps, all of which contributes to its high level of biodiversity. The humid west-facing valleys and gullies can maintain monsoonal rainforest under drier conditions, while deciduous elements will survive in drier sites such as ridgetops and eastern slopes.
MATERIALS AND METHODOLOGY
A 72-cm-long sediment core was retrieved manually from the Parsons Valley Lake (Fig. 1) by hammering acid-washed PVC pipe (75 mm [3 inch] diameter) into the lake bed at the selected location (a few meters from the lake margin at <1.5 m water depth, located using a Garmin III global positioning system). The lithology of the sediment core was described using a Munsell colour chart (Fig. 2), and measures of sediment texture and grain size distribution, including roundness and sorting, were collected. The sediment core was subsampled at 2 cm intervals, and each sample was sealed in a ziplock polyethylene bag, labelled, and preserved for further analysis. Samples for sediment and geochemical analyses were oven-dried at 40°C, and eight organic-rich sediment samples were radiocarbon-dated using accelerator mass spectrometry (AMS) at the Inter University Accelerator Center (IUAC), New Delhi (Table 1). The dried sediment samples were pretreated using the ABA (acid–base–acid) protocol after careful removal of plant microfossils either by wet flotation or manual extraction under a microscope. Sediment samples were placed in centrifuge tubes, immersed in 0.5 M HCl, and retained for heating and shaking at 65°C and 750 rpm for about 3 h to remove contaminant carbonates. After repeated washings with ultrapure water and centrifugation, the samples were brought to neutral pH. They were further treated with 0.1 M NaOH to remove humic and fulvic acids by heating and shaking at 65°C and at 750 rpm for about 3 h. After repeated washings and centrifuging, the pH-neutral sample was again treated with 0.5 M HCl to remove dissolved atmospheric carbon dioxide that might have been absorbed during the base wash. Finally, the sample was neutralized by repeated washing and freeze-dried for graphitization. Automated graphitization equipment was used for combustion and graphitization purposes (Wacker et al., Reference Wacker, Nemec and Bourquin2010). Graphitized samples were measured using the AMS facility based on 500 kV tandem ion accelerator at IUAC, New Delhi (Kumar et al., Reference Kumar, Pattanaik, Ojha, Gargari, Joshi, Chopra and Kanjilal2015). An oxalic acid II sample from NIST (SRM 4990C) was used as a standard, and phthalic anhydride from Sigma-Aldrich (product no. 320064) was used as a blank for background correction. The radiocarbon dates were then corrected to the actual δ13C values of the samples.
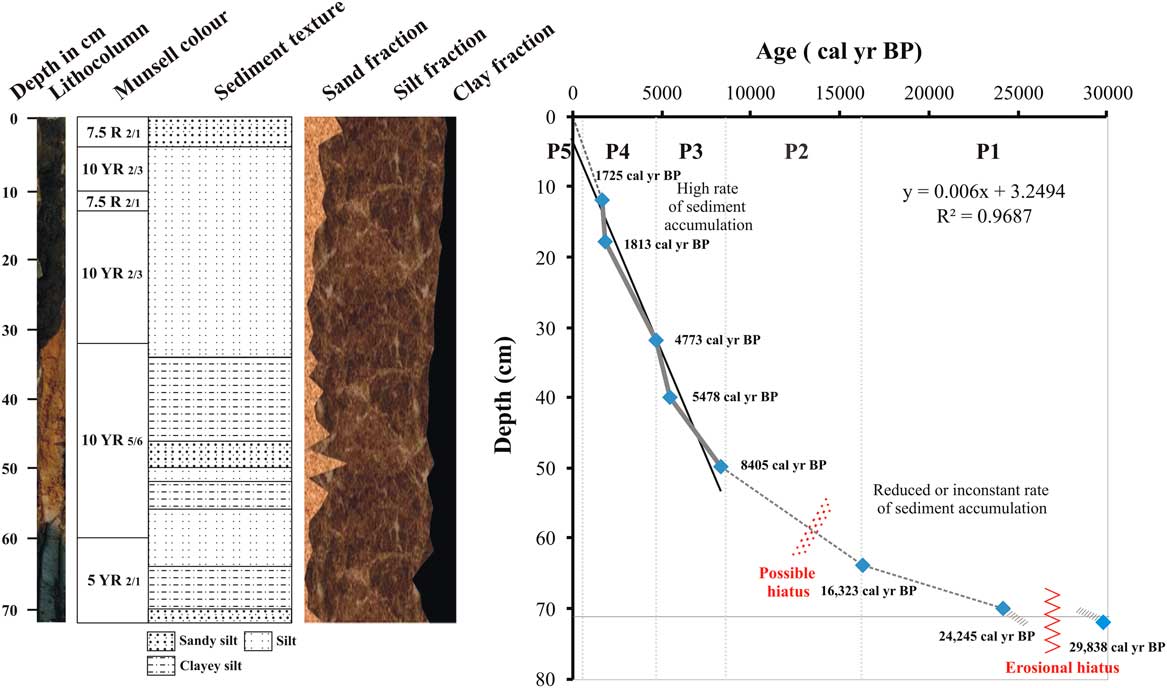
Figure 2 Sediment core lithologic units with depth vs radiocarbon ages.
Table 1 Radiocarbon ages of the lake sediments dated.

a IUAC, Inter University Accelerator Center (IUAC), New Delhi.
Twenty-one sediment samples were analysed for δ13C values at the Physical Research Laboratory, Ahmedabad. Sand, silt, and clay percentages of the sediments were measured using Krumbein and Pettijohn’s (Reference Krumbein and Pettijohn1938) standard pipetting methods. Organic matter (OM) and carbonate content were measured using a loss-on-ignition method following Dean (Reference Dean1974); the sediment moisture was first removed by oven-drying at 50°C, followed by further heating of known weights of the samples at 550°C (for organic carbon) and 950°C (for carbonate). Carbon:nitrogen (C/N) ratios were determined using a Thermo Fisher Scientific FLASH 2000 CHNS-O organic elemental analyzer at the Department of Geology, Anna University, Chennai. The analytical accuracy for the estimation of total nitrogen and total organic carbon (TOC) is ±0.5%.
For palynological analyses, 10 g of each sample was first treated with 10% KOH and passed through a 150 mesh sieve (>106 μm). The filtrate was allowed to settle overnight, and the supernatant was discarded. The residue was acetolysed following Erdtman (Reference Erdtrnan1943) and subsequently filtered through a 650 mesh sieve (>10 µm). The residual matter containing the pollen and spores was mounted on glass slides using glycerine jelly and studied under a high-power light microscope (Olympus BX-51). The palynological spectra represent relative percentages of total counts (250–300) of pollen grains and spores. The total count (sum) excludes Poaceae/Cyperaceae (ubiquitous taxa) and algal and fungal spores and pteridophytic spores, as these taxa are disproportionately abundant, which may obscure vegetation interpretations (Cole et al., Reference Cole, Bhagwat and Willis2015). The recovered pollen grains were categorized as arboreals, nonarboreals, and aquatics, which are arranged accordingly in the same order in the pollen spectrum. Their relative percentages were calculated against the pollen sum. The pollen diagram and the cluster analysis (CONISS) were constructed using Tilia v. 1.7.16 (Grimm, Reference Grimm2011). The cluster analysis allowed us to infer the palynological phases by identifying homogenous segments of taxa (Table 2). The distribution of the recorded floristic types to relative mean precipitation and total number of dry months in the WG has been furnished in Supplementary Tables 1 and 2 to track the compositional shifts.
Table 2 Palaeo-vegetation and its implication for climate change.
RESULTS
Lake sediment lithology
The stratified lake sediment core is divided into six lithologic units based on variations in both colour and texture (Fig. 2). Unit I (59.5–72cm) consists of very fine, blackish-grey clay deposits over a single layer of brownish-black clay (72 cm; 5 YR 2/1) (Fig. 2). Unit I is overlain by yellowish-brown sediments (10 YR 5/6), composed of alternate laminations of clayey silt and silt with one layer of sandy silt texture that occurs between 48 and 50 cm (unit II, 32–59.5 cm). Lithologic unit III (12.5–32 cm) is silty, brownish black in colour (10 YR 2/3), and poorly sorted. Lithologic unit IV (10–12.5 cm) has a gradational contact with unit III and contains coarse red sand grains (7.5 R 2/1). Lithologic unit V (4–10 cm) is silt dominant and brownish black in colour (10 YR 2/3) due to organic carbon. This unit is overlain by a reddish-black layer (7.5R 2/1) containing sandy silt that is poorly sorted and rich in OM and decayed leaves (unit VI, 0–4 cm).
Chronology
Eight organic carbon–rich samples were radiocarbon-dated, and the ages range from ~29,838 cal yr BP at 72 cm to ~1725 cal yr BP at 18 to 12 cm depth (Fig. 2, Table 1). This suggests a nonlinear sedimentation rate from the late Pleistocene to the present, with the apparent rates varying from 0.00006 cm/yr (from 29,838 to 24,245 cal yr BP; 72–70 cm) to 0.003 cm/yr (from 1813 to 1725 cal yr BP) and sedimentation rates generally increasing through the sequence (Fig. 2). Interpolated ages based on the eight measurements will be used here; however, the apparent very low sedimentation rates below 32 cm may indicate erosional episodes on the basin floor.
Sediment texture
The silt fraction (76.5%) is higher than the clay and sand throughout the core (Fig. 3). The clay component ranges from 29.42% (66 cm depth) to 5.91% (4 cm depth), while the sand fraction ranges from 28.52% (50 cm depth) to 0% (66 cm depth). A distinct increase in sand content was observed at the 2–4 cm depth (~570 cal yr BP), 48–50 cm (~8400 cal yr BP), and 52–54 cm (~10,650 cal yr BP).
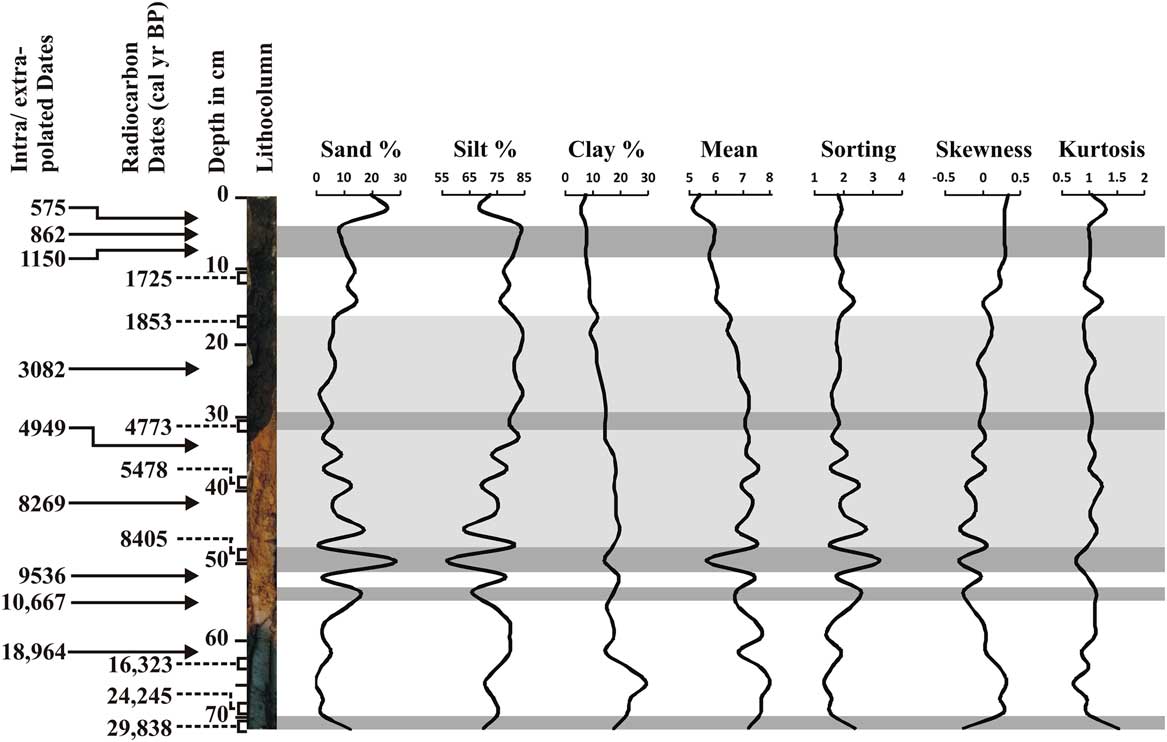
Figure 3 Down-core variations in sand, silt, and clay content; mean; sorting; skewness; and kurtosis. Intra/extrapolated dates refer to the estimation of age within/beyond the range of two known calibrated ages.
OM, TOC, CaCO3, and C/N ratio
The OM content in the sediment core increases abruptly from values averaging about 15% below 32 cm to values ranging between 28% and 34% above. The TOC content shows a similar shift from values less than 4% below 30 cm to values greater than 6% above ranging from 1.14% (depth 70 cm, corresponding to ~24,250 cal yr BP) to 7.71% (depth 18 cm, corresponding to~1850 cal yr BP (Fig. 4). CaCO3 exhibits a slight increase above 32 cm and is at its maximum value around ~290 cal yr BP (2 cm depth). C/N ratios fluctuate, especially in the top 30 cm of the core, but show a general tendency to increase with time. Average values are about 13 below 56 cm, and 17 above 30 cm.
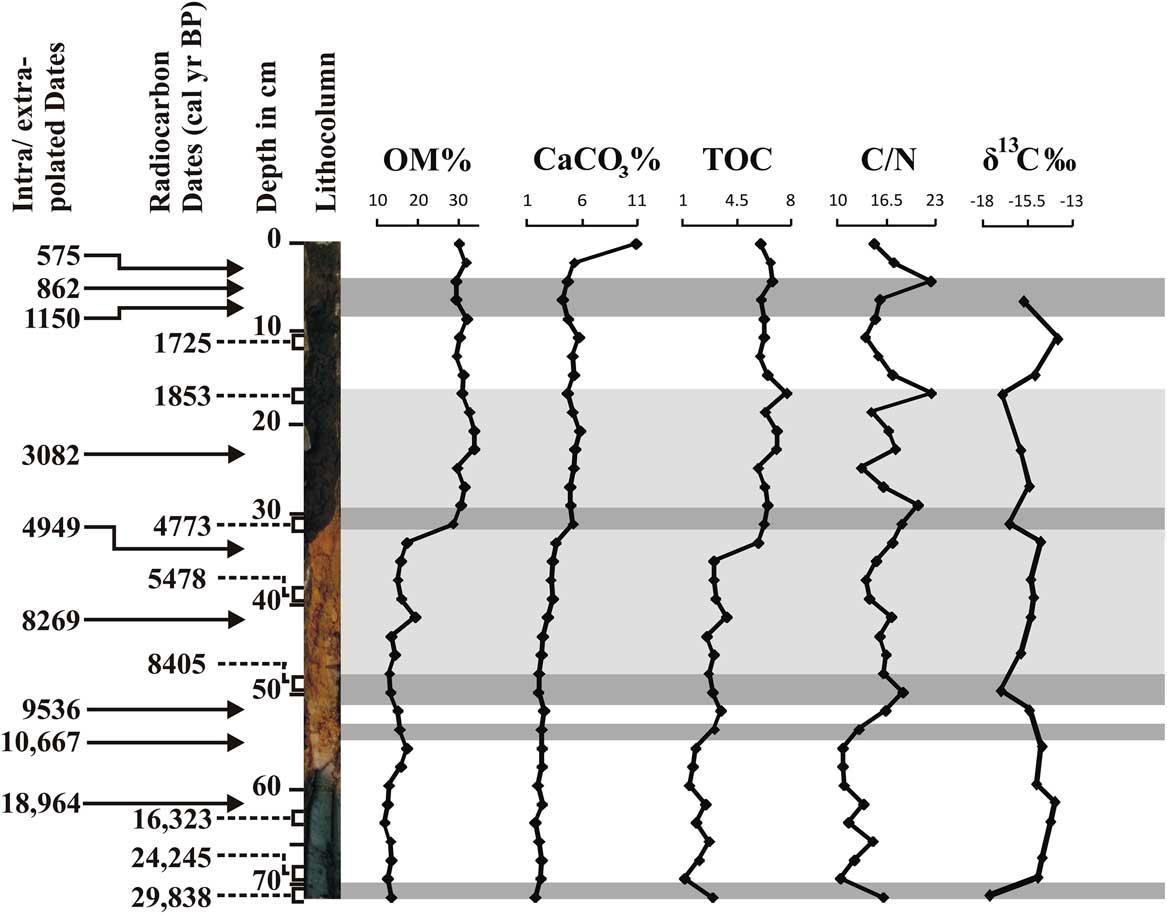
Figure 4 Down-core variations in organic matter (OM), CaCO3, total organic carbon (TOC), C/N, and δ13C. Intra/extrapolated dates refer to the estimation of age within/beyond the range of two known calibrated ages.
Stable C isotope analyses
Lake sediment samples (n = 21) were analysed for δ13C, and the values range from −13.84% to −17.60‰ relative to the VPDB standard (Fig. 4). Around ~29,800 cal yr BP, a reasonably depleted δ13C value of −17.60‰ is observed, which then increases to −14.0‰ by ~15,200 cal yr BP. This enriched zone between ~24,200 to 11,800 cal yr BP indicates a mixture of C4 and C3 vegetation, followed by a declining trend between ~8400 to 4770 cal yr BP (−17.0 to −16.5 ‰). From ~4770 cal yr BP to the present represents a period of fluctuations containing more-negative δ13C values, with an outlier of −13.84‰ at about ~1720 cal yr BP suggesting C4 dominance. Overall, the values fluctuate around a mean of −15.4‰ in the core. An overall upward increase of nearly 3.8‰ in the δ13C values reflects a significant change in the vegetation cover around the lake.
Palynology
Each of the sediment samples analysed revealed excellent preservation of pollen (Supplementary Fig. 1) and yielded a sufficient amount. The pollen sum of arboreal pollen (AP) and nonarboreal pollen (NAP) grains varied from 227 to 280, excluding Poaceae/Cyperaceae, algal and fungal spores, and pteridophytic spores. To delineate and to better understand the effect of climate change and sequential vegetation succession, we identified five distinct climatic phases on the basis of representation of prominent arboreal and nonarboreal species recovered, cluster analysis (CONISS), and other multiproxy data that are furnished separately (Supplementary Figs. 2 and 3).
Palynophase I (72–66 cm)
This pollen zone, with two radiocarbon dates of 29,800 and 24,250 cal yr BP, encompasses the temporal range of ~29,800 to 19,000 cal yr BP and is characterized by being completely dominated by an evergreen–semi-evergreen rainforest community. The total arboreal pollen (AP), constituting 81.3% of the total vegetation, is characterized by much higher values of Myristica (26.2%), followed only at the base by Goniothalamus (13.5%), Annonaceae (12%), Rhododendron (10%), Hopea (8.2%), Hypericum (7.2%), Psychotria (6.2%), Drypetes (3.2%), Semecarpus (2.5%), Anacardiaceae (2.2%), Taraktogenos macrocarpa (2.7%), and Knema (1.7%) at moderate to high frequencies. Other tree taxa, including Terminalia (1.5%), Clausena (1.5%), Bentinckia (1.2%), Mangifera indica (1%), Artocarpus (1%), Nothapodytes (1%), Vateria (0.75%), Alnus (0.75%), Syzygium (0.5%), and Garcinia talbotii (0.5%) are recorded sporadically. Among nonarboreal taxa, Asteraceae (10%) are recorded in high frequencies, followed by Strobilanthes (3%) and Impatiens (1.75%). Ranunculaceae (0.23%) represent the aquatic flora. Compared with the total pollen count, the relative percentage of pollen for the ubiquitous taxa Poaceae (19.08%) is highest, followed by Cyperaceae (8.9%), pteridophytic spores (6.3%), and algal and fungal spores (2.8%). The AP/NAP ratio (7.5) is highest in this phase (Fig. 5).
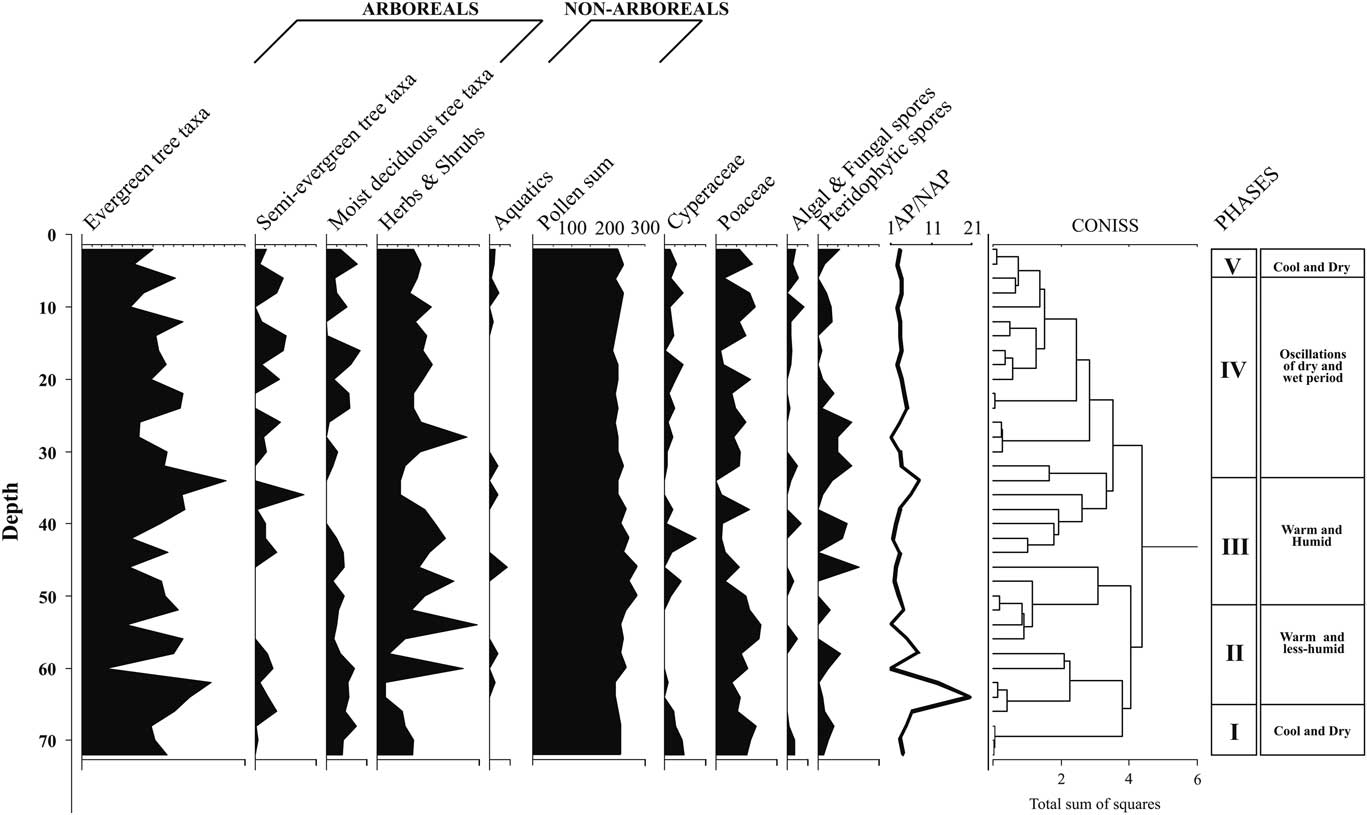
Figure 5 Palynological spectrum of functional types from Parsons Valley Lake core sediment, Nilgiris, India. AP, arboreal pollen; NAP, nonarboreal pollen.
Palynophase II (64–52 cm)
This pollen zone, with a single radiocarbon date of 16,300 cal yr BP, covers an interpolated time interval of ~16,300 to 9500 cal yr BP and also exhibits dominance by arboreals (77.5%), but with a significant increase in nonarboreals. This zone displays a considerable increase in the number of tree taxa in sporadic frequencies, interpreted as indicating high seasonality. The drought-resistant taxa Annonaceae (9.14%) maintains its constant presence in the zone. Hopea (8.71%), Goniothalamus (6.4%), Myristica (3.28%), Macaranga peltata (3.14%), Isonandra (3%), Alnus (2.57%), Garcinia (1.85%), Walsura trifolia (1.85%), Knema attenuata (1.71%), Terminalia (1.28%), Croton (1.28%), Rhododendron (1.14%), Scolopia (1.14%), Artocarpus (1%), Celastraceae (1%), and Pajanelia longifolia (1%) are recorded sporadically with moderate to low values. Enhanced intermittent values are recorded for Vateria (4.28%), Garcinia talbotii (1.14%), and Humboldtia sp. (0.71%) after a lapse, and the first appearance of Gluta travancorica (1.57%), Vernonia travancoria (1%), and Dysoxylum malabaricum (0.57%) in the upper part of this zone indicates the commencement of the Holocene. The nonarboreals show consistently high frequencies of Impatiens (6%) and Asteraceae (4.4%). Myriophyllum (0.57%) and Ranunculaceae (0.85%) represent the aquatic elements. Poaceae (15.02%) show consistently high frequencies followed by pteridophytic spores (3.59%). The marshy element, Cyperaceae (0.2%), along with algal and fungal spores (0.7%), is retrieved occasionally in very low frequencies. The AP/NAP ratio in this zone is 7.44.
Palynophase III (50–34 cm)
This pollen zone, with two 14C dates of 8400 and 5480 cal yr BP and covering the time span of ~8,400 to 4950 cal yr BP, demonstrates further reduction in AP% (74.86%). Annonaceae (7.8%), Hopea (1.4%), Myristica (0.67%), and Goniothalamus (0.6%) have relatively reduced frequencies, in contrast to Croton malabaricus (3.3%) and Artocarpus (1.9%), which have enhanced values. Artocarpus (1.9%), Eurya (1.6%), Poeciloneuron indicum (1.3%), Waltheria indica (1.3%), Oleaceae (1.2%), Kingiodendron pinnatum (0.8%), Otonephelium stipulaceum (0.8%), Caesalpinaceae (0.8%), and Reinwardtiodendron (0.7%) are new entrants, with increased values recorded for them and for Taraktogenos macrocarpa (2.4%), Aglaia (2.3%), Tiliaceae (2.3%), Waltheria indica (1.3%), Garcinia talbotii (1.22%), Celastraceae (1%), Vateria indica (0.89%), and Alnus (0.8%), indicating a thick evergreen–semi-evergreen rainforest cover in the vicinity. Among the herbaceous elements, Asteraceae (6.5%) shows high frequencies followed by Impatiens (3.55%), Cannabis sativa (1.5%), Apiaceae (1.33%), and Chlorophyton (0.55%). The aquatic elements Pistia stratiotes (1.1%) and Ranunculaceae (0.9%) emerge sporadically. The considerably reduced value for Poaceae (5.74%) indicates its growth has been restricted by a dense rainforest community. Increase in the wetland taxa Cyperaceae (3.11%), pteridophytic spores (5.9%), and algal and fungal spores (1.3%) suggests a wetter climate. The AP/NAP ratio is 3.46.
Palynophase IV (32–6 cm)
This pollen zone, represented by three radiocarbon dates of 4700, 1850, and 1720 cal yr BP and with a time bracket from ~4770 to 860 cal yr BP, documents considerably increased numbers of both arboreal (64) and nonarboreal taxa (13) when compared with all other pollen zones. The AP constitutes 76.7% of the total pollen count. About 11% is Annonaceae (11%), followed by Decussocarpus (6.4%), Tiliaceae (5.57%), Myristica (5%), Rhododendron (4.2%), Ilex (3%), Artocarpus (3%), Hopea (2%), Elaeocarpus (2%), Croton malabaricus (2%), Alnus (1.9%), Eurya japonica (1.7%), Otonephelium stipulaceum (1.7%), Poeciloneuron indicum (1. 5%), Celastraceae (1.42%), Taraktogenos macrocarpa (1.4%), Acacia (1.3%), Rubiaceae (1.3%), Isonandra lanceolata (1.3%), Mitracarpus verticillatus (1.2%), Memecylon talbotianum (1.2%), Vernonia travancoria (1.1%), Hypericum (1%), Goniothalamus (1%), Diospyros (1%), and Flacourtiaceae (1%). The NAP assemblage is composed of Impatiens (7%), Asteraceae (7%), Apiaceae (5.8%), Chlorophyton (2.8%), Cannabis sativa (1.6%), Xanthium (1%), Strobilanthes (0.5%), Artemisia (0.4%), and Brassicaceae (0.4%). Ranunculaceae (1%) is the lone, sporadically recorded aquatic element. Poaceae constitutes 13.2%, Cyperaceae 4.3%, pteridophytic spores 7.2%, and algal and fungal spores 2.3%. The AP/NAP ratio is 3.3.
Palynophase V (4–0 cm)
This pollen zone covers the temporal range from ~570 cal yr BP to the present and depicts considerable reduction in arboreal diversity. The total AP constitutes 73.7%, with a drastic decline in the number of arboreals. Pinus (14%), Gluta travancorica (5.5%), Turpinia (3.5%), Reinwardtiodendron (2.5%), Baccaurea courtallensis (2.5%), Scolopia (1.5%), and Symplocos (1%) have relatively increased values in this pollen zone. However, Annonaceae (5.5%), Rubiaceae (2%), Syzygium (1.5%), Ixora (1.5%), Psychotria (1.5%), Meliaceae (1%), and Myristica malabarica (1%) show a decline. Ilex sulcata (1.5%) appears for the first time. The advent of moist deciduous elements such as Terminalia (3.5%), Canarium strictum (2.5%), Nothapodytes (2%), and Acacia (2%), along with Rhododendron (4%), is seen, and these plants are identified in appreciable numbers. The NAP taxa also become less diverse in this zone, with Impatiens (5%), Artemisia (4%), Asteraceae (3.5%), Apiaceae (3%), Strobilanthes (1.5%), Xanthium (1.5%), and Clerodendrum viscosum (1.5%) recorded sporadically with high to moderate values. A spurt in aquatic vegetation is documented with high values for Polygonum plebeium (3.5%) together with Ranunculaceae (0.7%). Poaceae (17.1%), Cyperaceae (5%), pteridophytic spores (8.6%), and algal and fungal spores (4%) are marked by relatively increased values. The AP/NAP ratio is down to 2.8.
DISCUSSION
Based on the integration of our results, we have classified the core into five palaeoecological zones.
Phase I: Climate and vegetation during the pre–last glacial maximum and last glacial maximum
The multiproxy evidence collectively delineates a prominent wet phase in the last glacial period at around ~29,800 cal yr BP (72 cm). The sediment exhibits a brownish-black (5 YR 2/1) colour, probably due to anoxic conditions during periods of stagnation, and has recorded a relatively enhanced sand flux and C/N values indicating greater terrestrial input. The sediments are very poorly sorted, very leptokurtic, and coarse skewed, which suggests hydrodynamic scour caused by high-energy water currents carrying larger clasts into the lake, with the finer sediments travelling to and accumulating in a deeper part of the lake. This phase also shows the most depleted δ13C signature (–17.6‰), suggesting an abundance of C3 vegetation interpreted to be related to high soil moisture (Rajagopalan et al., Reference Rajagopalan, Sukumar and Ramesh1997) (Fig. 4). Thirteen out of 17 tree taxa recorded in this wet phase represent highly diverse evergreen to semi-evergreen rainforest vegetation. The moderate representation of a few emergent moist deciduous elements such as Hypericum, Terminalia, and Rhododendron, which increase at the time of the last glacial maximum (LGM), is possibly a pioneer response attesting to the gradual replacement of the widespread evergreens. The highest percentage of Myristica malabarica and M. fatua are recorded, suggesting swampy areas in the vicinity, which indicates heavy precipitation during this period (Supplementary Fig. 2, Supplementary Table 1). The presence of Hopea, Vateria indica, Artocarpus, Garcinia talbotii, Taraktogenos, and Strobilanthes pollen also indicates high rainfall during this period around ~29,800 cal yr BP, contemporaneous with northward displacement of the ITCZ (Peterson and Haug, Reference Peterson and Haug2006). Such a wet phase might have extended before 29,800 cal yr BP, but lack of data from our present study inhibits our inferences. In their work on peat samples in the Sandynallah region of the Nilgiris, Rajagopalan et al. (Reference Rajagopalan, Sukumar and Ramesh1997) suggested relatively moist conditions between 40,000 and 20,000 years BP in South India, affirming our results. However, this millennial-scale pulse of high precipitation is not observed in the wider region, suggesting a climatic response to local forcings in the Parsons Valley region. This contrasts with several palaeoclimate reconstructions showing a widespread arid phase at this time in low latitudes (Kristen et al., Reference Kristen, Fuhrmann, Thorpe, Röhl, Wilkes and Oberhänsli2007; Tierney et al., Reference Tierney, Russell, Huang, Jaap, Damsté, Hopmans and Cohen2008; Rusella et al., Reference Russella, Vogel, Konecky, Bijaksana, Huang, Melles, Wattrus, Costa and King2014; Dutt et al., Reference Dutt, Gupta, Clemens, Cheng, Singh, Kathayat and Edwards2015).
The subsequent sediment sample (70 cm) of radiocarbon age ~24,250 cal yr BP indicates an apparent erosional hiatus in the sequence, as it encompasses a measurable interval of geologic time (Mitchum, Reference Mitchum1977).
During the Heinrich 2 event (~23,000 cal yr BP; Bard et al., Reference Bard, Rostek, Turon and Gendreau2000) and the global LGM, the climate of the Parsons Valley region was marked by a transition to a cool climate with an estimated temperature drop of 5°C (Farrera et al., Reference Farrera, Harrison, Prentice, Ramstein, Guiot, Bartlein and Bonnefille1999) induced by low solar forcings (Sirocko et al., Reference Sirocko, Sarnthein, Erlenkeuser, Lange, Arnold and Duplessy1993). This zone is associated with very slow sedimentation rates, with clay dominance (avg. 73%), particularly around 18,960 cal yr BP (interpolated age; depth 66 cm), and an absence of sand that indicates a significantly weaker monsoon (Cosford et al., Reference Cosford, Qing, Lin, Eglington, Mattey, Chen, Zhang and Cheng2010). This is corroborated by enriched δ13C values. The pollen assemblage reveals heterogeneity, as both temperate and tropical trees were recorded. The expansion of Rhododendron and Hypericum, along with incursion of Alnus, suggests a cooler climate. Consistent high frequencies of Asteraceae (interpreted as being indicative of cooler, dry conditions), is attributed to a northeast monsoon domination during this period (Tiwari et al., Reference Tiwari, Ramesh, Somayajulu, Jull and Burr2006; Ansari and Vink Reference Ansari and Vink2007; Chabangborn et al., Reference Chabangborn, Brandefelt and Wohlfarth2013). Although cool conditions persisted for a few millennia, the climate also became seasonally drier in the region and saw reduced precipitation overall, as indicated by high percentages of drought-resistant tree taxa like Meliaceae, Terminalia, and Annonaceae (Supplementary Fig. 2). However, the prevalence of such an intensified cool and dry spell did not affect the shola forests, which exhibit high water-retention capacity due to their microenvironment and its higher relative humidity. Furthermore, the cooler temperature would have decreased the evaporation rate (Yu et al., Reference Yu, Xue, Wang and Liu2000) and increased the moisture availability in the Parsons Valley Lake, which is inferred from the blackish-grey colour of the sediments (5 YR 2/1; reduction of minerals) and sediment texture (clayey silt), indicating high lake stands for longer periods. Relating to the moisture availability, the overall AP% of this phase remained high (81.3%), indicating the abundance of less diverse populations with low seasonality (Barboni and Bonnefille, Reference Barboni and Bonnefille2001) (Fig. 5).
The persistent cool and dry climatic conditions that prevailed in the South Asian region during the LGM are attributable to a strengthened northeast monsoon and weakened summer monsoon circulation corresponding to broad insolation minima and a southward-displaced ITCZ (Shin et al., Reference Shin, Liu, Otto-Bliesner, Brady, Kutzbach and Harrison2003; Liu et al., Reference Liu, Colin, Trentesaux, Siani, Frank, Blamart and Farid2005; Kristen et al., Reference Kristen, Fuhrmann, Thorpe, Röhl, Wilkes and Oberhänsli2007; Fleitmann et al., Reference Fleitmann, Burns, Pekala, Mangini, Al-Subbary, Al-Aowah, Kramers and Matter2011; Konecky et al., Reference Konecky, Russell, Johnson, Brown, Berke, Werne and Huang2011; Rusella et al., Reference Russella, Vogel, Konecky, Bijaksana, Huang, Melles, Wattrus, Costa and King2014). Climate model (CCSM3) simulations and reconstructed palaeo-data for the Asian monsoon region indicate a weak LGM summer monsoon over most of the Indian Ocean subregion (Chabangborn et al., Reference Chabangborn, Brandefelt and Wohlfarth2013), suggesting the prevalence of cool and dry conditions.
Phase II: Climate and vegetation during the latest Pleistocene and Pleistocene–Holocene transition
During the post-LGM period (~16,300 to 9500 cal yr BP), the variations in deposition of terrigenous silty sediments and their grain size distribution document large precipitation changes and fluctuating lake levels. This interval demonstrates a general shift towards a wet–dry tropical climate comprising episodes of intense, excessive summer monsoon years interrupted by infrequent monsoon failures, which led to repetitive episodes of desiccation and refilling of the lake. The low rates of sediment accumulation imply sediment hiatuses of erosive origin consistent with periods of stronger monsoons (Sadler, Reference Sadler1999; Servant-Vildary et al., Reference Servant-Vildary, Servant and Jimenez2001) or discontinuous sedimentation associated with intervals of dry conditions and reduced sediment supply (Zhang et al., Reference Zhang, Ming, Shi, Chen, Niu, Lei, Chang and Zhang2014). The sediment texture, characterized by clayey silt, displays a yellowish-brown colour (10 YR 5/6), indicating oxidized conditions—a consequence of historically fluctuating lake levels. This period has a reduced AP% (from 81.3% to 77.5%), but with higher diversity compared with the preceding pollen zone, exhibiting 18 new entrants of largely evergreen rainforest taxa that occur in low frequencies, such as Gluta travancorica, Meiogyne pannosa, Garcinia, Diospyros, Croton malabaricus, Humboldtia sp., Isonandra lanceolata, and Aglaia in response to the stabilized temperatures. Reduced numbers of Rhododendron, Hypericum, and Terminalia, along with extremely low frequencies of Myristica and sedges, point to the termination of cool and waterlogged conditions. However, sporadic representation of a few moisture-loving plants like Myriophyllum and Ranunculaceae indicates occasional high lake stands despite the elevated temperature and strong insolation forcing, suggesting intermittent episodes of higher summer precipitation. During periods of reduced monsoonal activity with lowered effective rainfall, drought-intolerant vegetation shrank and perhaps took refuge around the moister pockets or as riparian forest cover, restricted to locales with edaphic conditions favourable to its sustenance, resulting in a consistent AP record. Most of the species recorded during phase I (Semecarpus, Bentinckia condapanna, Hypericum, Drypetes, Flacourtiaceae, Myristica fatua, and Syzygium sp.) show time-bracketed local extirpations, especially during the latter part of this phase, probably due to weakened regeneration capacity in the changing environment. A distinct, intense wet phase identified during the post-LGM warming phase at about ~10,650 cal yr BP indicates a climatic anomaly pattern of considerably stronger and active precipitation reflected in enhanced sand influx of a very poorly sorted, coarse skewed, and leptokurtic nature, with an elevated TOC value. In the present study, the sediment core is chiefly dominated by fine-grained silts and clays, which reflects sedimentation during perennial water inflows that commonly occur, so the coarse-grained clastic layers punctuating this silty matrix reflect the very highest energy wet environment (Priyanka et al., Reference Priyanka, Achyuthan, Geethanjali, Kumar and Chopra2018). It is possible that the wet events indicated by a major shift in the magnitude of the sediment data in our record are associated with the commencement of the early Holocene intensification of summer monsoons, although our age control is insufficient to constrain their timing within a period of possible unconformity. A relatively high percentage of pollen of Garcinia talbotii, Hopea ponga, and Humboldtia sp., coupled with a decline in drought-resistant taxa like Annonaceae and incursion of Chlorophyton, Vernonia travancoria, Impatiens, and Villebrunea integrifolia interspersed among rainforest tree taxa, indicates rainforests of low diversity occurred in and around the periphery of the Parsons Valley Lake as a result of intense precipitation during the very early Holocene period when summer insolation was the highest (Roy and Singhvi, Reference Roy and Singhvi2016).
The overall shift towards an ameliorated thermal regime during the last deglaciation period synchronises well with the African humid period (Holmes and Hoelzmann, Reference Holmes and Hoelzmann2017) and insolation-driven changes occurring around 16,000 yrs BP with the onset of the Bølling/Allerød warming (Claussen et al., Reference Claussen, Dallmeyer and Bader2017). Oscillating patterns of decadal- and centennial-scale variability of humid periods, punctuated by arid episodes, indicate an alternation of intermediate and shallow lake stands. Higher summer insolation in India with an increase in the Indian Ocean Sea Surface Temperature (SST) shifted the ITCZ to northern latitudes (Peterson and Haug, Reference Peterson and Haug2006; Yancheva et al., Reference Yancheva, Nowaczyk, Mingram, Dulski, Schettler, Negendank, Liu, Sigman, Peterson and Haug2007; Roy and Singhvi, Reference Roy and Singhvi2016), bringing in more summer precipitation during latest Pleistocene and Pleistocene–Holocene transition. However, uninterrupted insolation forcing in the high-montane tropical lake, with intermittent break periods of relatively lesser amounts of summer rainfall, would have probably caused drier spells and shallow lake stands. Consistent AP concentrations in the region are probably the result of local factors that maintained a continuous pollen record of more diverse evergreen landscape in the expansive riparian zones. In their work on land-cover response to climate change in the Nilgiris, Caner et al. (Reference Caner, Lo Seen, Gunnell, Ramesh and Bourgeon2007) demonstrate that, beaten by strong southwest monsoon winds in the western Nilgiris (where Parsons Valley lies), sholas expanded in sheltered valley sites, which led to slow but steady expansion of the forest cover since 18 ka BP. This alternating active and inactive monsoon phase in the Parsons Valley appears to have been interrupted by an intense intervening spell of torrential rains before 10,000 yrs BP. Higher lake levels (Bartlein et al., Reference Bartlein, Harrison, Brewer, Connor, Davis, Gajewski and Guiot2011) associated with temperature increases (Wang et al., Reference Wang, Sarnthein, Erlenkeuser, Grimalt, Grootes, Heilig, Ivanova, Kienast, Pelejero and Pflaumann1999; Markgraf et al., Reference Markgraf, Whitlock and Haberle2007), intensified Indian summer monsoon (Deplazes et al., Reference Deplazes, Luckge, Peterson, Timmermann, Hamann, Hughen and Rohl2013), a weakened northeast monsoon (Wang et al., Reference Wang, Sarnthein, Erlenkeuser, Grimalt, Grootes, Heilig, Ivanova, Kienast, Pelejero and Pflaumann1999), and C3 vegetation dominance in Nilgiris (Sukumar et al., Reference Sukumar, Ramesh, Pant and Rajagopalan1993) support the existence of wet conditions during this time period. The commencement of the early Holocene intensification around 10,650 cal yr BP, as marked by pluvial conditions, corroborates well with the summer insolation maximum (Sirocko et al., Reference Sirocko, Sarnthein, Erlenkeuser, Lange, Arnold and Duplessy1993; Overpeck et al., Reference Overpeck, Anderson, Trumbore and Prell1996) and advancement of the ITCZ more into northern latitudes (Kutzbach and Guetter, Reference Kutzbach and Guetter1986; Liu et al., Reference Liu, Liu, Kutzbach, Clemens and Prell2006; Roy and Singhvi, Reference Roy and Singhvi2016).
Phase III: Climate and vegetation during the early to mid-Holocene and mid-Holocene
The early to mid-Holocene transition around ~8405 cal yr BP witnessed an outbreak in monsoonal precipitation indicated by the highest sand content (28.5%) in the core. This significant seasonal contrast in response to insolation forcing was brought about regional changes in the hydrologic cycle and global monsoons (Berger, Reference Berger1978). Enriched C/N ratios and less positive δ13C values suggest a period of dominant C3 terrestrial input that further supports this wet event interpretation (Fig. 4). The presence of Poeciloneuron indicum, Garcinia talbotii, Terminalia, and Hopea ponga, coupled with re-established populations of Asteraceae and Cyperaceae, indicates a higher relative summer monsoon in the region as well as an active northeast monsoon, corroborating Rajagopalan et al. (Reference Rajagopalan, Sukumar and Ramesh1997), who suggest excess soil moisture (more negative δ13C values) in the Sandynallah basin, Nilgiris (Table 3).
Table 3 Comparison of the observed Parsons Valley Lake δ13C data with values taken from the literature for samples dated from the late Pleistocene to the present.
a LGM, last glacial maximum. (*) = data not available.
During the mid-Holocene, frequent or prolonged breaks in the intensity of rainfall are depicted by fluctuating C/N and TOC trends that indicate short-term climatic variability with an overall subnormal performance of the summer monsoon. Clayey-silt sediments of an oxidised nature indicate decreasing sediment input as a result of variable rainfall and reduced length of the monsoon season in response to changing summer solar insolation in the Northern Hemisphere (Overpeck et al., Reference Overpeck, Anderson, Trumbore and Prell1996; Fleitmann et al., Reference Fleitmann, Burns, Neff, Mudelsee, Mangini, Kramers and Matter2004; Wang et al., Reference Wang, Liu and Herzschuh2010) and a gradual decrease in summer monsoon (Roy and Singhvi, Reference Roy and Singhvi2016). The average δ13C value in this period ranges around −15.6‰, suggesting a shift towards C4 grassland vegetation (Rajagopalan et al., Reference Rajagopalan, Sukumar and Ramesh1997). This zone records a reduction in AP% corresponding to increased representation by nonarboreals. The increase in nonarboreals suggests an opening up of the forest related to a weakened summer monsoon, suggesting lakes with fluctuating margins. The pollen record indicates a dominance of rainforest vegetation interrupted by discontinuous stretches of seasonal tropical forests. There is a scattered presence of rainforest elements comprising members of Oleaceae and Dipterocarpaceae, Goniothalamus, Meiogyne pannosa, Artocarpus, Eurya japonica, Isonandra lanceolata, Garcinia talbotii, Poeciloneuron indicum, Kingiodendron pinnatum, Taraktogenos macrocarpa, Reinwardtiodendron, Aglaia, Myristica malabarica, and Prunus ceylanica, which flourish in the WG in areas of high precipitation (2500–5000 mm/year), along with other low-diversity heterogeneous (semi-evergreen and deciduous) components such as Alnus, Pajanelia, Mallotus, Hydnocarpus, and Croton malabaricus, suggesting frequent long breaks with sparse rainfall during this overall warm period (Roy and Singhvi, Reference Roy and Singhvi2016).
This prominent period, extending from ~8400 to 4950 cal yr BP, corresponds with the Holocene climate optimum (HCO) (Ruiz-Zapata et al., Reference Ruiz-Zapata, Gil-García and Bustamante2010). Similarities between δ13C records from Parsons Valley Lake in Nilgiris, δDleaf wax records of Lake Tanganyika in East Africa (Tierney et al., Reference Tierney, Russell, Huang, Jaap, Damsté, Hopmans and Cohen2008), speleothem records from Mawmluh Cave in East India (Dutt et al., Reference Dutt, Gupta, Clemens, Cheng, Singh, Kathayat and Edwards2015), bulk dry density records from Dahu Swamp in South China (Zhong et al., Reference Zhong, Xue, Zheng, Ma, Cai, Ouyang, Cao and Tang2012), Ti% from the Cariaco basin in Venezuela (Peterson and Haug, Reference Peterson and Haug2006), and SST records from the northwestern Arabian Sea (Böll et al., Reference Böll, Schulz, Munz, Rixen, Gaye and Emeis2015), along with a series of solar maxima (Usoskin et al., Reference Usoskin, Solanki and Kovalstov2007), suggest a strengthened Holocene summer monsoon related to a northward shift in the ITCZ around the early–middle Holocene boundary (Koutavas and Lynch-Stieglitz, Reference Koutavas and Lynch-Stieglitz2004; Schneider et al., Reference Schneider, Bischoff and Haug2014; Roy and Singhvi, Reference Roy and Singhvi2016). Conversely, a gradual reduction in monsoon intensities occurred after the HCO, accompanied by a southward shift in the ITCZ driven primarily by orbitally induced changes in insolation at multidecadal and centennial time scales (Gupta et al., Reference Gupta, Anderson and Overpeck2003; Koutavas and Lynch-Stieglitz, Reference Koutavas and Lynch-Stieglitz2004; Fleitmann et al., Reference Fleitmann, Burns, Mangini, Mudelsee, Kramers and Villa2007; Wanner et al., Reference Wanner, Beer, Bütikofer, Crowley, Cubasch, Flückiger and Goosse2008; Konecky et al., Reference Konecky, Russell, Johnson, Brown, Berke, Werne and Huang2011; Schneider et al., Reference Schneider, Bischoff and Haug2014; Dutt et al., Reference Dutt, Gupta, Clemens, Cheng, Singh, Kathayat and Edwards2015, Ramisch et al., Reference Ramisch, Lockot, Haberzettl, Hartmann, Kuhn, Lehmkuhl and Schimpf2016 ).
Phase IV: Climate and vegetation during the mid- to late Holocene and late Holocene
The mid- to late Holocene transition period records multiple decadal- to centennial-scale wet events associated with a more northward shift of the ITCZ. An environmental threshold during this transition was identified around ~4770 cal yr BP with an abrupt increase in OM and an enhanced C/N ratio interpreted as greater terrestrial input. This is corroborated by a tendency towards a more negative δ13C record (Thevenon et al., Reference Thevenon, Adatte, Spangenberg and Anselmetti2012). Generally, changes in rates of TOC burial in lakes or changes in redox conditions reflect major changes in terrestrial vegetation and climate (Plater et al., Reference Plater, Boyle, Mayers, Turner and Stroud2006). Hence, the increase of terrestrial OM (Fig. 4) can be related to the expansion of a C3 vegetation landscape (Thevenon et al., Reference Thevenon, Adatte, Spangenberg and Anselmetti2012) resulting from abundant moisture availability. Enrichment in rainforest vegetation occurred, with an appreciable number of evergreen tree elements such as Poeciloneuron indicum, Elaeocarpus, Taraktogenos macrocarpa, Artocarpus, Myristica malabarica, and Leptonychia moacurroides becoming established in response to an ameliorated hydrothermal regime. This coincides with increased rainfall in Tatos basin, Mauritius, around 4750 cal yr BP (de Boer et al., Reference de Boer, Tjallingii, Vélez, Rijsdijk, Vlug, Reichart and Hooghiemstra2014).
Conversely, during the late Holocene period from 4350 to 862 cal yr BP, relatively lower values of C/N and an increased fine terrigenous fraction reflect reduced erosive rainfall energy, corresponding with a decrease in the strength of the summer monsoon (Roy and Singhvi, Reference Roy and Singhvi2016, Böll et al., Reference Böll, Schulz, Munz, Rixen, Gaye and Emeis2015). In particular, a heavier δ13C signature supported by elevated proportions of Poaceae pollen around ~1725 cal yr BP clearly indicates significant C4 contribution in response to lower effective moisture. An increase in CaCO3 content suggests stronger evaporative conditions and supports weakened monsoon activity. Two wet intervals indicated by less positive δ13C values and higher C/N ratios that occurred around 1853 and 1150 cal yr BP correlate with frequent high-intensity El Niño southern oscillation (ENSO) events (Moy et al., Reference Moy, Seltzer, Rodbell and Anderson2002; Steinke et al., Reference Steinke, Mohtadi, Prange, Varma, Pittauerova and Fischer2014; Roy and Singhvi, Reference Roy and Singhvi2016) (Fig. 4).
Although the percentage of AP remains static, the number of species has increased drastically by 42% (64 tree taxa), which is related to high seasonality (Beuning et al., Reference Beuning, Zimmerman, Ivory and Cohen2011). The expansion and diversification of the vegetation with incursions of temperate elements and most herbaceous taxa suggests increased rainfall seasonality. The sporadic occurrence of rainforest taxa such as Gluta travancorica, Poeciloneuron indicum, Elaeocarpus, and Aglaia, which grow in high-rainfall conditions, along with new entrants such as Calophyllum apctalum, Baccaurea courtallensis, Nothapodytes foetida, Memecylon talbotianum, Decussocarpus, Rosa canina, Ixora sp., Thraulococcus erectus, Mimusops elengi, Turpinia malabarica, and Leptonychia moacurroides, indicates a rainfall regime with a single long rainy season. Occasional high values of algal and fungal spores during this phase are significant, indicating occasional excess moisture conditions (Power et al., Reference Power, Whitlock, Bartlein and Stevens2006). Deciduous taxa intrusions like Acacia, Calliandra portoricensis, and Drypetes oblongifolia, along with drought-resistant taxa belonging to the Annonaceae and Meliaceae, indicate a less effective monsoon. An increase in frequencies of taxa belonging to Apiaceae and Asteraceae with a well-developed marshy fringe around the lake indicates a winter high-rainfall regime (Supplementary Table 2). Thus, the region remained sufficiently moist, with the bulk of rainfall concentrated in the winter season, implying a continued lack of a long dry season and revealing weak and variable summer monsoons alternating with strengthened winter monsoons.
During the late Holocene, the mean position of ITCZ gradually relocated farther southward, influenced by insolation changes. Increased ENSO activity coupled with a more southerly located ITCZ during this interval might have led to a weakened summer monsoon and reduced its northward expansion (Koutavas and Lynch-Stieglitz, Reference Koutavas and Lynch-Stieglitz2004; Wanner et al., Reference Wanner, Beer, Bütikofer, Crowley, Cubasch, Flückiger and Goosse2008; Böll et al., Reference Böll, Schulz, Munz, Rixen, Gaye and Emeis2015). Such in-phase behaviour of variability in precipitation patterns and a southerly located ITCZ are observed in data from Lake Malawi, Africa (Konecky et al., Reference Konecky, Russell, Johnson, Brown, Berke, Werne and Huang2011), the Tanganyika basin (Tierney et al., Reference Tierney, Russell, Huang, Jaap, Damsté, Hopmans and Cohen2008), and Tatos basin, Mauritius (de Boer et al., Reference de Boer, Tjallingii, Vélez, Rijsdijk, Vlug, Reichart and Hooghiemstra2014) showing enhanced monsoonal activity and in data from northern and southern Oman and Yemen (Fleitmann et al., Reference Fleitmann, Burns, Mangini, Mudelsee, Kramers and Villa2007) showing weakened monsoon.
Phase V: Climate and vegetation during the period from the Little Ice Age to the present
The cooler and drier Little Ice Age (LIA), prevailing between ~575 to 290 cal yr BP (Paasche and Bakke, Reference Paasche and Bakke2010; Dixit and Tandon, Reference Dixit and Tandon2016), reveals changes in precipitation patterns observed in the region (Table 2). During this period, AP was reduced to 74% with low pollen diversity (reduced to 20 species; a decline of 66%). The recorded species with relatively high percentages include Gluta travancorica, Baccaurea courtallensis, Scolopia, Reinwardtiodendron, Syzygium, Ixora, Turpinia, and Tiliaceae, along with the appearance of moist deciduous taxa like Canarium strictum, Terminalia, and Nothapodytes. A high percentage of Rhododendron and Impatiens affirms this cooling phase. High proportions of the pioneer Artemisia suggest winter precipitation (Bates et al., Reference Bates, Svejcar, Miller and Angell2006) correlating with the LIA (Supplementary Fig. 3). An increased percentage of anthropogenic plant pollen was also encountered in the sediment record. Large numbers of Acacia and Pinus pollen reflect the advent of human activities for commercial timbering purposes, providing evidence that both climate and human activities are significant drivers in shaping regional vegetation. The greater sand influx above 4 cm is unusual and seems likely to be the result of recent human activities (Fig. 3), including the building of roads and a dam and the clearing of forest for timber, exotic tree plantations, and agriculture. Climatic factors coupled with the advent of anthropogenic activities started the diminishment of shola forest cover (Caner et al., Reference Caner, Lo Seen, Gunnell, Ramesh and Bourgeon2007). Overall, the LIA appears to have had a pronounced cool and dry climate (relatively less humid) under the influence of weak monsoonal precipitation, with intensified anthropogenic activities also affecting the environment. Thus, the LIA in the Parsons Valley Lake basin region appears to suggest a more southerly ITCZ (Haug et al., Reference Haug, Hughen, Sigman, Peterson and Röhl2001; Koutavas and Lynch-Stieglitz, Reference Koutavas and Lynch-Stieglitz2004; Schneider et al., Reference Schneider, Bischoff and Haug2014) coupled with cooler temperatures due to the occurrences of a cluster of solar minima and a high number of strong volcanic events (Wanner et al., Reference Wanner, Beer, Bütikofer, Crowley, Cubasch, Flückiger and Goosse2008; Steinhilber and Beer, Reference Steinhilber and Beer2011; Bradley et al., Reference Bradley, Wanner and Diaz2016).
CONCLUSIONS
A 72 cm sediment core collected from the Parsons Valley Lake, Nilgiris, India, covering most of the last 30,000 years was analysed for stable carbon isotopes, geochemistry, sediment texture, and palynological assemblages to gather evidence for the effect of climate change on vegetational succession. The changes in the pattern of vegetation in this region seem to be synchronous with temporal changes in the intensity of the monsoons.
Our multiproxy record shows a regional signal of a warm and wet period at around ~30,000 cal yr BP with the highest AP percentage (81%) and establishment of Myristica swamps, which transitions to a cool and dry LGM period with an abundance of temperate taxa. This period was succeeded by a period of fluctuating conditions (~16,300–9,500 cal yr BP) that include an increased importance of C4 vegetation and an abrupt wet excursion around ~10,700 cal yr BP (interpolated age) associated with the early Holocene intensification of summer monsoons. The early part of the mid-Holocene (~8400 cal yr BP) was characterized by a strengthened monsoon that allowed the shola rainforests to flourish. An environmental threshold around 4800 cal yr BP, marked by an abrupt increase in OM, elevated sand flux, and more negative δ13C, points to a more positive moisture balance. This intense monsoonal trend was interrupted during the late Holocene period by weak and variable summer monsoons associated with strengthened winter monsoons, signifying increased seasonality. This was followed by a cool and dry period interpreted as the LIA. The advent of human activities led to reduced forest cover and the conversion of forest areas into commercial plantations, which is clearly marked in the pollen spectra by the combination of high percentages of Acacia and Pinus pollen. Thus, it is inferred from the present study that the shola, which has taken several thousands of years to evolve, has decreased considerably through time, as indicated by declining representation of true rainforest elements in the arboreal taxa and replacement of native vegetation with exotic plantation taxa.
SUPPLEMENTARY MATERIAL
To view supplementary material for this article, please visit https://doi.org/10.1017/qua.2018.58