


Introduction
The World Bank has estimated that global production of wheat would need to increase by 60% to meet the food requirements of a population of 9.6 billion by 2050 (Savadi et al., Reference Savadi, Prasad, Kashyap and Bhardwaj2018). The agricultural sector is of vital importance for the Mediterranean due to semi-arid climatic conditions and high population density that makes it the most water-scarce region, posing serious constraints on irrigation (United Nations, 2017), as well as irrigation water withdrawal in the region is expected to increase (Salmoral et al., Reference Salmoral, Willaarts, Garrido and Guse2017). Grain yield production of winter wheat in regions with typical Mediterranean climate is commonly limited by water deficits and heat stress during the flowering and grain filling period, and such unfavourable growing conditions are likely to be further worsened in the future climate (Páscoa et al., Reference Páscoa, Goueia, Russo and Trigo2017; Wang et al., Reference Wang, Liu, Asseng, Macadam and Yu2017). Drought has an effect on physiological parameters such as chlorophyll content, photosynthetic parameters, biomass and grain yield (Zhao et al., Reference Zhao, Liu, Shen, Jianhua Yang, Han, Feng Tian and Wu2020). Leaf chlorophyll content is one of the important, physiological traits closely related to photosynthetic capacity (Arunyanark et al., Reference Arunyanark, Jogloy and Akkasaeng2008). Foliar chlorophyll can be measured using a portable chlorophyll meter such as SPAD (Kiani-Pouya and Rasouli, Reference Kiani-Pouya and Rasouli2014). SPAD meter reading is applied as an index for the response of relative chlorophyll content to different types of stresses, including moisture and extreme temperatures. Reduction in chlorophyll concentration under dry conditions is due to the effect of drought stress on chlorophyll degradation (Bahavar et al., Reference Bahavar, Ebadi, Tobeh and Jamati2009). Sulok et al. (Reference Sulok, Zainudin, Hassim and Suhaili2012) found the highest SPAD value (49.1) under well-watered treatment followed by 41.1, 36.7 and 29.8 SPAD units under mild, moderate and severe water stress treatments, respectively. SPAD reading at full irrigation I100 was 38% higher than control I0 (Ninou et al., Reference Ninou, Tsialtas, Dordas and Papakosta2013). Water stress leads to the production of reactive oxygen species such as O2 and H2O2, which lead to damaged chlorophyll and reduced chlorophyll stability index (Jianguo et al., Reference Jianguo, Zhenwen and Yu2017). The photosynthesis, chlorophyll content and water productivity value of winter wheat significantly increased with increasing supplemental irrigation and rainfall concentrations at the jointing, flowering and grain filling growth stages in winter wheat (Ali et al., Reference Ali, Xua, Jia, Ma, Ahmad, Adnan, Gerar, Ren, Zhang, Cai, Zhang and Jia2018). Stomatal conductance and uptake of CO2 are reduced by water deficit which ultimately affects the growth of plants; the researchers have reported the decline in photosynthesis due to water stress resulting in variations in stomatal and non-stomatal response of the plant (Olszewski et al., Reference Olszewski, Pszczółkowska, Makowska, Kulik and Okorski2009; Ahmed et al., Reference Ahmed, Hassan, Aslam, Akram and Aslam2010). Wheat varieties with higher chlorophyll content stay green for longer, maintain more photosynthetically active leaves and higher stomatal conductance. However, water scarcity during flowering and grain filling stages can inhibit and reduce the period of photosynthesis and increase leaf senescence, which may reduce the contribution of pre-flowering, assimilates to grains (Wu et al., 2014). Significant and positive correlations were found between yield and photosynthesis rate, stomatal conductance, transpiration rate, chlorophyll content (Yasir et al., Reference Yasir, Wasaya, Hussain, Ijaz, Farooq, Farook, Nawaz and Hu2019). Bahar et al. (Reference Bahar, Yildirim and Barutcular2009) reported under Mediterranean conditions that average g s measures of all durum wheat genotypes at early milky, late milky and early dough maturity periods were 294, 225 and 167 mmol H2O/ms, respectively. Sato et al. (Reference Sato, Abdalla, Oweis and Sakuratani2006) applied supplemental irrigation on wheat two times in flowering and grain filling stages that the value of g s in the SI100 treatment was higher than in the other regimes of SI50 and rain-fed. Certainly under mild or moderate drought stress stomatal closure causing reduced leaf internal CO2 concentration is the major reason for declined rates of leaf photosynthetic (Pour-Aboughadareh et al., Reference Pour-Aboughadareh, Ahmadi, Mehrabi, Etminan, Moghaddam and Siddique2017). Sezen and Yazar (Reference Sezen and Yazar2006) attained the highest average grain yield of wheat from the highest irrigation level as 8.3 mg/ha, and the lowest yield was obtained from rain-fed with 3.0 mg/ha. Rao et al. (Reference Rao, Regar, Tanwar and Singh2013) found the highest value of water productivity under deficit irrigation level DI46 and the lowest value under full irrigation; however, the highest grain yield was under full irrigation. However, Farre and Faci (Reference Farre and Faci2006) observed that water productivity decreased with decreasing irrigation. In all the cases, irrigation water productivity (IWP) values related to deficit irrigations were higher than those of full irrigation. IWP increased with decreasing irrigation amounts and/or water use (Yazar et al., Reference Yazar, Gökçel and Sezen2009). The typical Mediterranean climate in this region causes a high evaporative demand in late spring when precipitation is low, considerably enhancing the risks of occurrence of severe water deficit during the most susceptible growth stage of winter wheat at flowering and post-anthesis grain filling period (Páscoa et al., Reference Páscoa, Goueia, Russo and Trigo2017).
The knowledge of using suitable irrigation scheduling became urgent and necessary for both Mediterranean farmers and researchers with deterioration wheat production that results in an insufficient rainfall in sensitive wheat growth stages of flowering and grain filling (March until May) and its major negative effects on decaling physiological parameters and cop productivity, thus our study is concentrated on evaluating the SPAD chlorophyll meter readings in monitoring leaf chlorophyll content and its relation to grain yield of wheat, and studying stomatal conductance response to optimal and water-stress conditions under different conventional and supplemental irrigation strategies applied at various wheat growth stages in the Mediterranean region of Turkey. Furthermore, this study aimed at determining the effect of supplemental and deficit irrigation applied at the critical growth stages on grain yield and IWP.
Materials and methods
Experimental site, soil and water and climate
The study was conducted in wheat-growing seasons 2014 and 2015 at the Experimental Farm of Çukurova University (35°18′E longitude, 36°59′N latitude and altitude of 35 m above sea level) in Turkey, using a variety of Triticum aestivum L. Adana 99.
The experimental soil was determined as the Mutlu soil series (Palexerollic Chromoxeret) (FAO, 2006), the soil profile described as a clay texture, electrical conductivity of the saturation extract (ECe) and pH ranged between 0.5−1.1 dS/m and 7.6–7.8, and bulk density varied from 1.2 to 1.3 g/cm3. The soil water content (SWC) at field capacity (FC) and permanent wilting point were estimated using the pressure plate apparatus at 0.3 and 15 bar, respectively (Klute, Reference Klute and Klute1986). The volumetric SWCs at WP and FC were 18–23 and 41–42%, respectively. Irrigation water with pH and electrical conductivity of 7.7 and 0.8 dS/m was provided from open channel (Table 1). The climatic data of air temperature, relative humidity (RH), wind speed and precipitation obtained from the automatically recording meteorological station at the experimental site in 2 years study were presented in Fig. 1.

Fig. 1. Mean monthly maximum and minimum air temperature and total precipitation data of wheat-growing seasons of 2013/2014 and 2014/2015.
Table 1. Description of some physical and chemical characteristics of the experimental soil

Experimental design and treatments
In this study, line-source sprinkler systems were used to evaluate the effect of different irrigation strategies and irrigation levels on yield production that installed parallel to crop rows. For each irrigation strategy, a line-source sprinkler system was set up in the experimental field as shown in Fig. 2. The experiment was laid out using four line-source irrigation systems, which allows a gradual variation of irrigation, in direction at right angle to the source. Four irrigation levels, namely one full (I100) and three deficit (I25, I50 and I75) irrigations were envisaged. Irrigation treatments were replicated four times under four line-source sprinkler systems. The distance between line-source sprinkler systems was 3.0 m to avoid water interaction between the lines of sprinklers. Double-nozzled sprinkler heads (4.5 mm × 4.8 mm) placed at 6 m intervals on the laterals provide a linearly decreasing wetting pattern under 300 KPA pressure. The sprinkler irrigation depth was measured by calibrated catch cans, placed at the centre of each irrigation level plot above the crop canopy following Winward and Hill (Reference Winward and Hill2007). The catch cans were placed on the grids of 3.0 m both sides of the lateral lines in all four replications. The neutron access tubes were located in each replication in order to ensure reliable field data about the actual soil moisture content.

Fig. 2. Experimental layout of the line-source sprinkler system in the field for each irrigation strategy.
Three different supplemental irrigation strategies and a conventional irrigation along with rain-fed treatment were studied, namely (1) conventional irrigation (CI), (2) supplemental irrigation during flowering growth stage (SIF), (3) supplemental irrigation during grain filling (SIG) and (4) supplemental irrigation both during flowering and grain filling (SIFG). For each irrigation strategy, four irrigation levels (I100, I75, I50 and I25) were considered, a dry (rain-fed, RF) treatment was also included in the study.
Irrigation scheduling was based on restoring soil moisture deficit in an effective root zone depth of 90 cm to near FC when 50% of available water is depleted for the full irrigation treatment plots next to the sprinkler lateral (CI100) in conventional irrigation. The other irrigation levels automatically received approximately linearly decreasing proportions (75, 50 and 25%) of the full irrigation amount. For supplemental irrigation strategies, soil water deficit in 90 cm soil depth (Wang et al., Reference Wang, Liu, Li, Ma, Lu, Feng and Guo2014) of the corresponding growth stage was replenished to FC for full irrigation level plots next to the sprinkler lateral.
Irrigation water productivity
The IWP values in kg grain per m3 of the water were calculated for different treatments after crop harvest according to Zhang et al. (Reference Zhang, Yu, Kong, Hou, Gu, Liu, Wang and Yang2018):

where GY = grain yield production (kg/ha), I = irrigation water applied for each treatment (mm).
Measurements and observations
Soil water content
A neutron probe (Hydroprobe Model 503, California, USA) was used to measure SWC at 30 cm intervals down to 120 cm during the wheat-growing season approximately at 2-week intervals prior to water application through aluminium access tubes installed in the middle of all experimental plots. In addition, at planting and harvesting, the SWC was monitored by gravimetric method by using hand – auger at 30 cm depth increments down to 90 cm soil profile.
Evapotranspiration
The seasonal evapotranspiration of wheat (ETa) for all plots was calculated during the growing seasons using the soil water balance equation (Xu et al., Reference Xu, Zhang, Li, Liu, Zhao, Zhang, Zhou and Wang2018a):

where I: irrigation water amount (mm) that is measured in the four catch cans parallel to line source located in the centre of each plot, P: the precipitation (mm) amount in the experimental site, ±ΔSW: is the change of SWC (mm) between any consecutive irrigations in the 90 cm soil profile taken as effective root zone depth, D P: the drainage from the bottom of the root zone below 90 cm depth, which is negligible since any single rainfall amount and distribution during the growing seasons did not exceed soil water storage capacity in the 90 cm soil depth; and R o: surface runoff during the growing season. R o from the experimental plots was negligible as there was sufficient surface roughness (due to dry sowing) for water infiltration and also there were low ridges of sowing lines.
Leaf chlorophyll content (SPAD value)
Flag leaf chlorophyll content was determined using chlorophyll meter SPAD-502 (Minolta, Osaka, Japan) which measures the chlorophyll content via light transmittance (absorbance of red light at 650 nm and infrared light at 940 nm). Applied leaves were clean, dry (not wet from dew, irrigation or rain), intact with no sign of diseases or damage for using the instrument. The SPAD measurement values were recorded starting on 21 March and 10 April in the 2014 and 2015 seasons. The SPAD reading values were taken from five plants per plot at three positions on the flag leaf: the base, the middle and the top of the leaf. The average per plot was computed automatically and used in the analysis.
Leaf stomatal conductance
Stomatal conductance was recorded by Delta-T porometer AP4 (Delta-T Devices Ltd., Cambridge, UK). This device measures the rate of RH increase in a chamber clamped to the leaf surface, as water vapour is released through the stomata, this causes the chamber RH to rise. A rapid rise in RH indicates that the stomata are relatively open. The operating range for the porometer is 5–40°C and 10–70% RH. The porometer readings were taken five times during the growing season, on days with clear sky (not cloudy and not in the shadow) around noon (11:00 a.m.–02:00 p.m.). The samples used were four plants in each treatment that started at heading and continued until the plant reached dough maturity stage at approximately 10 days intervals.
Agronomic practices
A local bread wheat variety, Adana 99 (T. aestivum L.) was sown on 22 November 2013 and on 8 December 2014. The rate of seeds was (250 kg/ha) with an average row spacing of 16–18 cm with a planter. Grain yield was hand harvested by cutting the plants in 3 m2 area (2 m long and 1.5 m wide) in the centre rows of each plot, the harvested wheat plants were mechanically threshed, grain yield was separated, recorded and converted to mg/ha. All treatments received the same amount of fertilizers in the experimental years. At planting, a composite fertilizer (N: P2O5: K2O, 20–20–0%) was applied at a rate of 75 kg/ha; 75 kg/ha N at jointing stage and 75 kg/ha at flowering stage in urea form. Harvesting was carried out on 22 May in the first year and on 9 June in the next year.
Statistical analysis
The experimental data were analysed statistically by using software program SAS (Statistical Analysis System – Version 9.00 TS level 00M0 XP_PRO platform) and comparison between experimental unit means was made through Duncan's Multiple Range Test at a probability level of 5%.
Results
Irrigation and evapotranspiration results
The rainfall amounted to 250 mm in the wheat-growing season of 2013/14; however, it increased to 418 mm in the growing season of 2014/15. Thus, the 2013/2014 season can be described as a dry season. Regarding the distribution of rainfalls in study years, the rainfall received from December until February in the first growing season was 51% lower than rainfall in the second year. The rainfall received during the tillering stage in the dry season was only 17 mm in December; therefore, all treatments were irrigated with equal amount against the drought for crop establishment. Following the heading growth stage, the rainfall in April was close to each other in both growing seasons. The irrigation water amounts were determined by collecting water in the catch cans for all irrigation treatments. Full conventional treatment (CI100) received the highest irrigation water of 275.8 and 187.6 mm (2758 and 1876 m3/ha) in the growing seasons of 2014 and 2015, respectively. In relation to full supplemental irrigation treatments, the amount of irrigation water applied varied between 72.8 and 246.6 mm (728 and 2466 m3/ha) in SIF100 and SIG100, respectively (Table 2). The applied water amount greatly affected the crop evapotranspiration, ETa increased with increasing irrigation quantity. CI100 resulted in the highest seasonal ETa value of 485 mm and the lowest value was measured in RF treatment as 293 mm in the first season. On the other hand, SIF100 and SIFG100 strategies achieved 428 and 462 mm. In the wet season, ETa ranged between 645 and 474 mm under full conventional and rain-fed (Table 2) treatments. The main reason for the difference in ETa values in the experimental years was due to delayed irrigations in the first year because of the unavailability of irrigation water in the irrigation canals during most of the vegetative growth stage. This in turn resulted in lower ET and lower grain yield in the first year of the study.
Table 2. The effect of interaction between the irrigation strategies and irrigation levels on evapotranspiration (ETa), grain yield and irrigation water productivity (IWP) in 2014 and 2015 cropping seasons
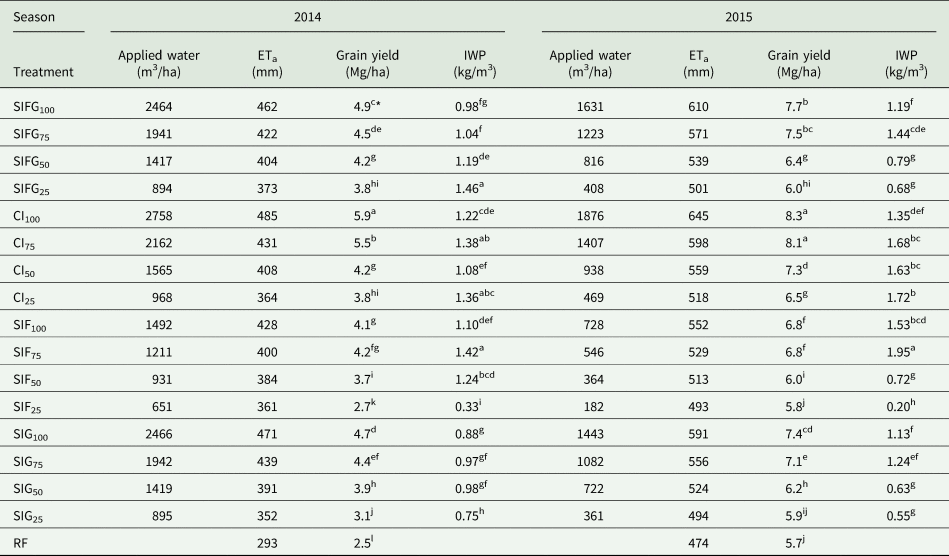
*The similar letters – treatment means have no significant differences.
Leaf chlorophyll content (SPAD value)
SPAD values during various growth stages for different irrigation strategies in the experimental years are presented in Figs 3 and 4, respectively. In 2014 on 120 DAP, the highest SPAD value of 42.4 was obtained from the rain-fed (RF) followed by CI25; and the lowest SPAD value of 36.7 was observed under CI100. There was no significant difference in SPAD values between low irrigation levels CI50,25 and rain-fed. The study year 2015 was wet; for this season, the SPAD readings were different as compared to dry year, especially during heading (124 DAP) and flowering (133 DAP). On 124 DAP, no significant differences were observed among the conventional irrigation treatments CI75, CI50, CI25 and RF. Full conventional irrigation resulted in 17.8% higher SPAD value than RF treatment. There was no big difference among growth stages in the second growing season as compared with the first year. Control treatment (RF) in the first crop season (after 133 DAP) reached watery grain stage and achieved a maximum SPAD value of 48.4, whereas with lowest SPAD value (41.2) occurred in CI75 which was still in flowering stage. In this respect, the SPAD readings in the second growing season on 133 DAP continued to increase which achieved 49.5 in CI100 and 44 units in CI25. Throughout the 2014 season, SPAD values increased after 133 DAP onward for treatments SIG100, CI100 and CI75 and reached their maximum on 147 DAP in milky grain stage amounted 49.4, 50.8 and 50.3, respectively. After that, chlorophyll content started declining during the senescence of flag leaf almost linearly until their minimum values occurred on 167 DAP in dough maturity stage with SPAD values of 28.0, 33.5 and 30.3, respectively. The SPAD units in 2015 achieved their maximum values on 149 DAP milky grain stage; after that, the chlorophyll content steadily decreased towards the end of the season that gave on (165 DAP) 31.2, 23.7, 38.5 and 41.5 for SIFG100, SIF100, CI75 and CI100, respectively. In 2014, drought stress under RF treatment decreased flag leaf chlorophyll by 23.2% compared to full conventional irrigation on 147 DAP. In the second year, the CI100 overtopped significantly (P < 0.01) on RF by 13.4% on 149 DAP.

Fig. 3. Variation of leaf chlorophyll content (SPAD) under the irrigation strategies and different irrigation levels during 2014 season (a) CI; (b) SIFG; (c) SIF; and (d) SIG strategy.

Fig. 4. Variation of leaf chlorophyll content (SPAD) under the irrigation strategies and different irrigation levels during 2015 season (a) CI; (b) SIFG; (c) SIF; and (d) SIG strategy.
Leaf stomatal conductance
The leaf stomatal conductance (g s) measurements in conventional irrigation strategy started at heading stage on 120 and 122 DAP in the 2014 and 2015 growing seasons, and g s values are presented in Figs 5 and 6. The highest values of leaf stomatal conductance in this period were observed in CI100 and CI75 treatments as 140.7 and 139.2 mmol/m2s in year 2014, and the corresponding values in 2015 were 354.6 and 348.2 mmol/m2s. The lowest value was obtained under RF with average 91.7 and 192.8 mmol/m2s in both cropping seasons of 2014 and 2015, respectively. There was no significant difference in g s values on 132 DAP between full supplemental irrigation strategies (SIF100 and SIFG100) and full conventional irrigation (CI100) treatment in 2014 season. However, in 2015, both SIFG100 and SIF100 dominated significantly (P < 0.01) on CI100. Additionally, supplemental irrigation treatments SIF75,100 and SIFG75,100 had significantly higher g s values than in SIF25,50 and SIFG25,50. In water grain filling stage, the g s values started decreasing in 2014 (142 DAP) for all treatments except (CI100,75,50); however, the values fluctuated due to the irrigation scheduling in 2015 (140 DAP). The reduction of g s continued rapidly and steadily (sharp decline) after milky grain stage on 155 and 150 DAP in the 2014 and 2015 growing seasons for all treatments.
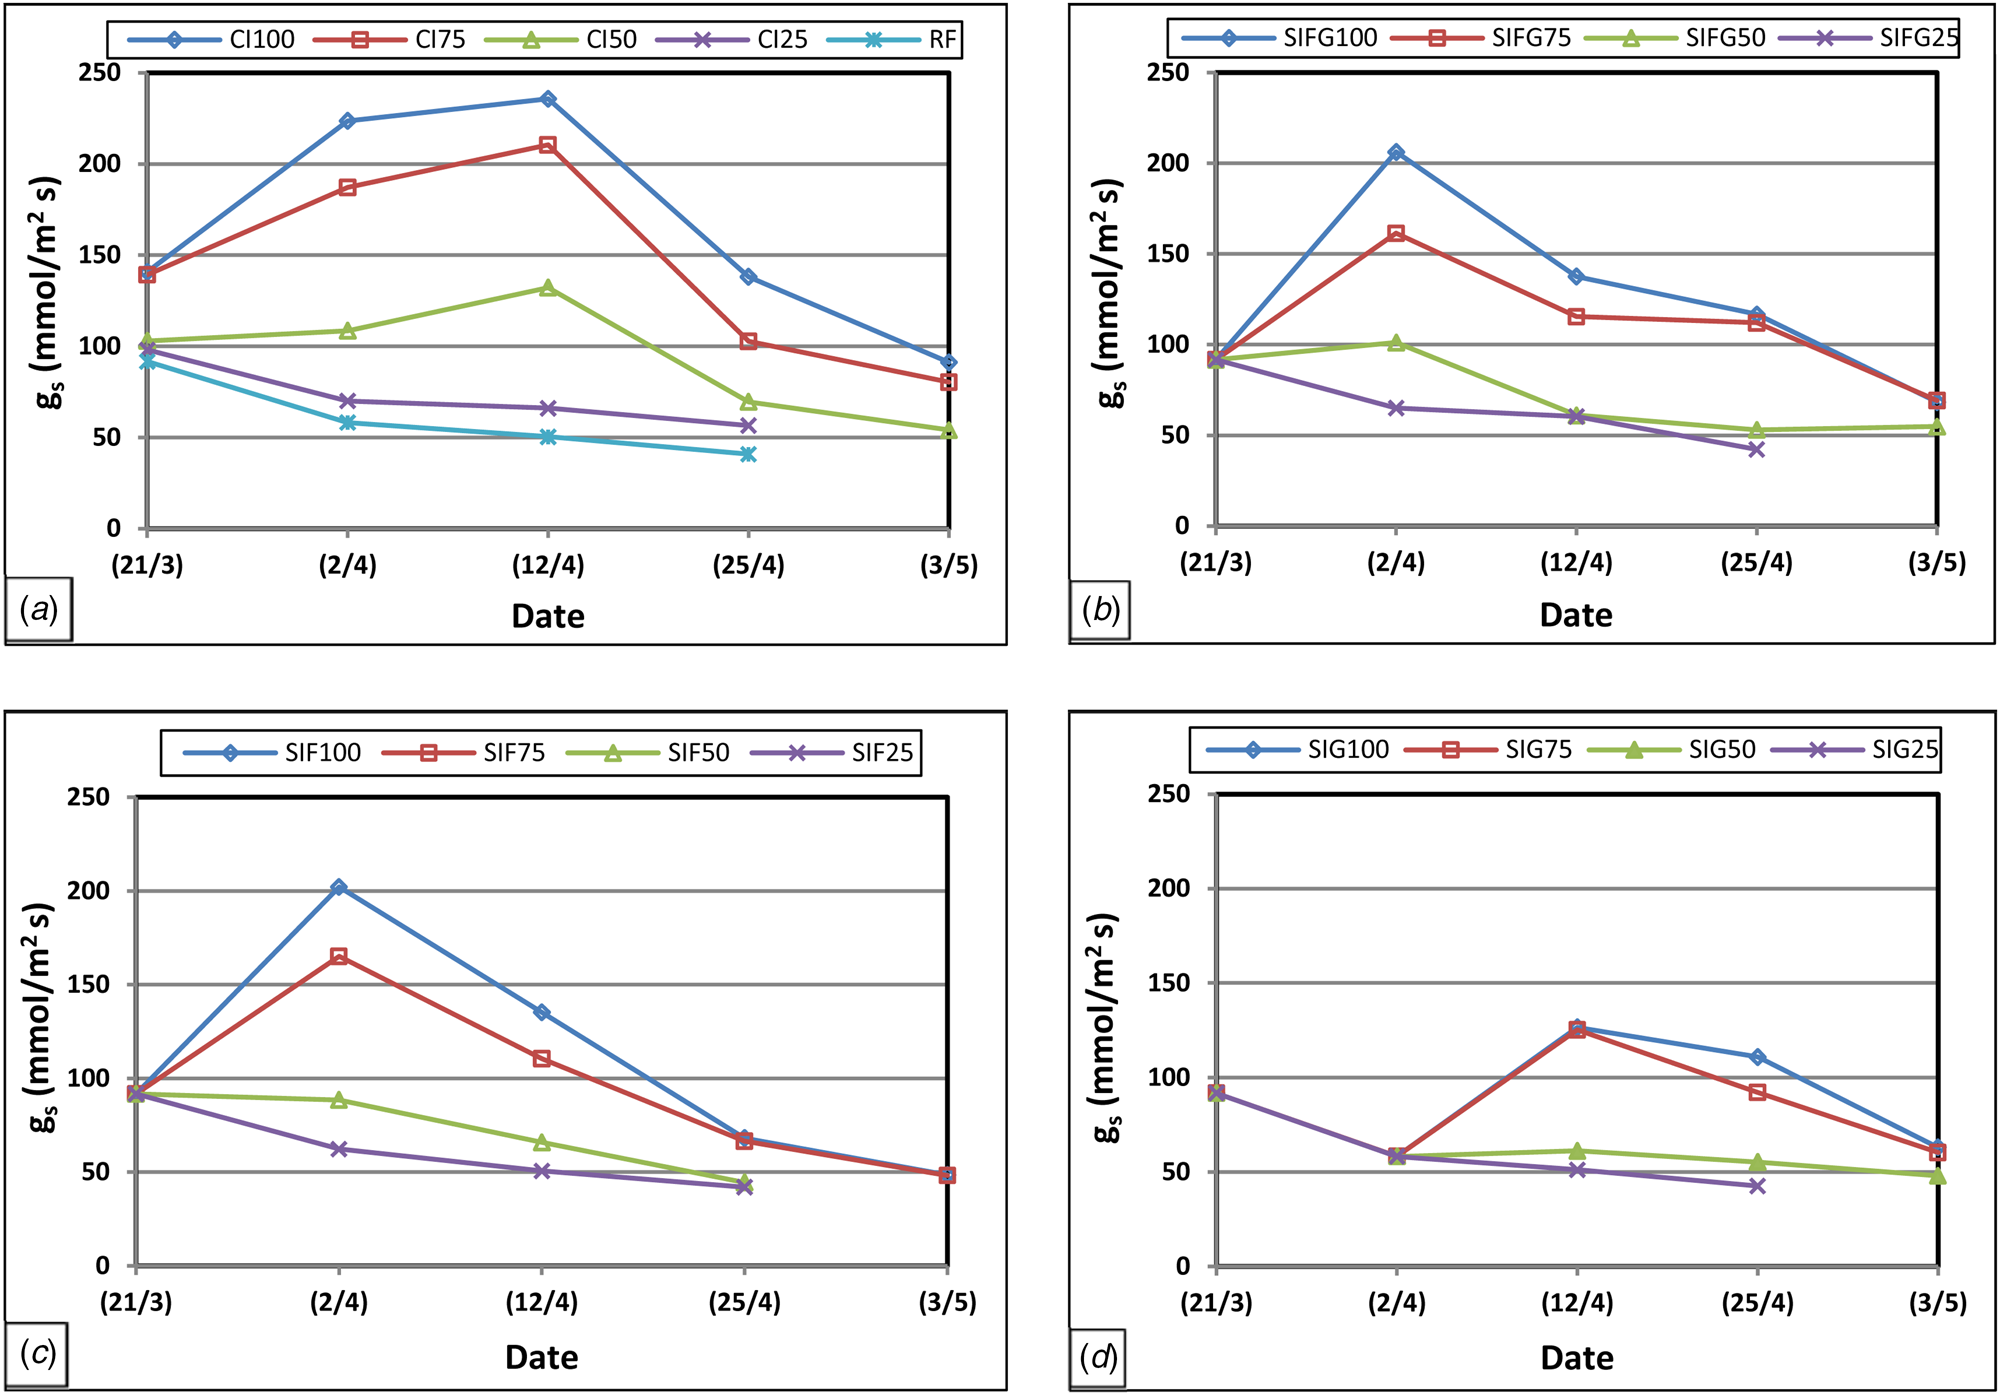
Fig. 5. Variation of leaf stomatal conductance (g s) with time for the irrigation strategies and different irrigation levels during 2014 season (a) CI; (b) SIFG; (c) SIF; and (d) SIG strategy.

Fig. 6. Variation of leaf stomatal conductance (g s) with time for the irrigation strategies and different irrigation levels during 2015 season (a) CI; (b) SIFG; (c) SIF; and (d) SIG strategy.
Grain yield and irrigation water productivity
In reference to the statistical analysis in Table 2, full conventional irrigation CI100 dominated significantly on the other full irrigation strategies in grain yield during the first and second seasons. Compared to moderate irrigation levels, results showed that deficit irrigation (CI75) overtopped significantly on all treatments of supplemental irrigation on the same level with average 5.5 and 8.1 mg/ha in the 2014 and 2015 growing seasons, respectively. As a result of the present study, it showed no significant decreases between CI50, SIFG50, SIF75 and SIF100 in the first season. In case of the second season, an insignificant effect was also observed between all interactions of 100 and 75% irrigation regimes under the same strategy of CI, SIF and SIFG.
Relative to IWP and supplemental irrigation strategies, the interaction of deficit and supplemental irrigation treatment SIF75 achieved the highest IWP of 1.95 kg/m3 (Table 2) and the analysis of results in the first year revealed that the treatment receiving one irrigation in flowering stage (SIF) elevated IWP by 12.2 and 25.0% against decreases in yield by 15.7 and 11.3% as compared by SIFG and SIG strategy, respectively. However, in the second year, the increases in IWP were 28.5 and 35.3% and yield loss amounted to 10.8 and 7.1% as compared to SIFG and SIG strategy, respectively.
Discussions
In the dry year, the SWC values were lower during planting until tillering stage due to the occurrence of a dry spell. Therefore, equal irrigation was applied on 27 DAP with irrigation quantity amounted 37.1 mm to all treatments in the experiment to prevent the plants from drought. The SWC in the wet season appeared to be higher in the early growth stages of wheat due to sufficient rain that reached its maximum on 80 DAP (361 mm in 90 cm soil depth), after that SWC decreased and the plants started to suffer from water stress, especially under lower irrigation levels during heading, flowering and grain filling stages. Additionally, in the conventional strategy, the SWC increased early due to irrigation at heading stage (116 DAP), whereas SWC in SIFG and SIF strategies increased later following irrigation in flowering stage (130 DAP). As for SIG strategy, the application of irrigation was relatively late in grain filling stage (138 DAP) that made SWC lower than those in the SIF and SIFG strategies until this date. Generally, CI and SIF strategies have encountered the lowest and highest soil water stress, respectively, in wheat growth stages in both years. The SWC was below the wilting point for treatments C125, SIFG25 and RF, in addition to SIF25,50,75 at the end of the season (grain filling stage), whereas SWC changed between 393 (FC) and 207 mm (WP) for the rest of treatments. Detailed information on SWC including the variation of SWC with time as graphs was provided in the previous publication by Alghory and Yazar (Reference Alghory and Yazar2019).
The irrigation water amounts applied to the treatments during only one growth stage (SIF100 strategy) resulted in water saving of 46–61% and only 11–13% when water was applied at two growth stages (SIFG100 strategy) compared to conventional full irrigation (CI100) during the first and second year, respectively. We observed that the applied water amount greatly affected the crop evapotranspiration, ETa increased with increasing irrigation quantity. The full SI strategies SIG, SIFG and SIF decreased seasonal crop evapotranspiration by 2.8, 4.6 and 11.7% in the first season and the corresponding values of the second season recorded 8.4, 5.3 and 14.4%, respectively, as compared to full conventional irrigation strategy. The seasonal ETa decreased to 24.2% for SIFG100 and 20.2% for SIG100 in the first year as compared to the second year due to prevailing weather conditions. Generally, plants exposed to water stress have lower evapotranspiration which further leads to the development of certain water stress symptoms such as leaf wilting, reduced leaf area and stunted plant growth (Wang et al., Reference Wang, Jia, Sun, Wang, Dong, Ma, Jing and Ma2015a, Reference Wang, Zhao, Guo, Li, Jian and Yu2015b).
Irrigation treatments differed in chlorophyll content (SPAD units) depending on the applied water regime and its growth stage. In the first season (120 DAP), the low irrigation treatments CI50,25 and RF reached flowering stage early due to water stress and therefore SPAD values of flag leaves were significantly higher than the high irrigation levels CI100 and CI75 (plants in heading stage). However, in 2015, the differences among CI treatments were smaller and not significant that might be that the wheat plants in these treatments probably did not suffer differently from water stress. Chlorophyll content after that increased and reached its maximum values in advanced stages (watery and milky grain stages) where the leaf greenness and leaf thickness affected SPAD and the flag leaf became darker and thicker, thus the SPAD units achieved their highest value compared to other stages. In relation to irrigation strategy effect on SPAD values, the supplemental irrigation treatments SIFG100,75 overtopped that treatments SIF100,75 (147 DAP) in the first year. Data regarding 2015 season indicated that the SPAD readings were higher in treatments SIFG (100 and 75%) by 4.1 and 1.1% than SIG (100 and 75%) on 149 DAP, but lower by 6.2 and 10.9% for the same treatments on 157 DAP due to the influence of irrigation on SPAD values by accelerating growth stages and improving the biological yield, which consequently decreased or increased the chlorophyll content.
In relation to irrigation scheduling, it was observed that applying irrigation in heading, flowering and grain filling stages under full conventional irrigation strategy CI100 was able to increase the SPAD, gs and grain yield significantly as compared with full supplemental irrigation of SIF100 strategy (just one supplemental irrigation at flowering stage) or full supplemental irrigation of SIG100 (just two supplemental irrigations at grain filling stage). The wheat plants exposed to drought stress at post-anthesis under SIF100 led to reduction in physiological growth parameters of SPAD and g s 18–10% and 23–16%, respectively, in comparison to CI100 in the first and second growing seasons. Therefore, these reductions decreased photosynthesis process and caused early leaf senescence to reduce leaf area by 25 and 14% and biomass by 32 and 15% (data not shown), ultimately, resulted in greater reduction in grain yield by 29 and 17% in 2014 and 2015 growing seasons, respectively. Drought reduces the duration of photosynthesis of wheat during the flowering stage. In the flag leaf stage, a water shortage reduces the assimilation rate. Furthermore, drought accelerates the decomposition of assimilation during senescence (Farkas et al., Reference Farkas, Varga-László, Anda, Veisz and Varga2020). For better understanding, the physiological mechanism contributing to increased yield production under CI100 compared to SIF100 strategy is that applying one irrigation at heading stage under CI100 promoted the root growth and improved the canopy structure as well as prolonged the ageing period of plants and delayed the degradation of leaf chlorophyll that led to produce more photosynthetic products and finally generating higher biomass and grain yield. Similar results were reported by Jianguo et al. (Reference Jianguo, Zhenwen and Yu2017); Ali et al. (Reference Ali, Xua, Jia, Ma, Ahmad, Adnan, Gerar, Ren, Zhang, Cai, Zhang and Jia2018); Aman and Adnan (Reference Aman and Adnan2018); Shams (Reference Shams2018); Yasir et al. (Reference Yasir, Wasaya, Hussain, Ijaz, Farooq, Farook, Nawaz and Hu2019) who found a positive relation between physiological parameters, deficit and supplemental irrigation and grain yield and yield components.
Stomata play a key role in regulating the flow of water in the soil-plant-atmosphere continuum. Stomatal conductance (g s) values were higher during heading in 2015 due to the effect of rainfall resulting in increased soil moisture in the root zone at the beginning of the season. The g s measurements in 2014 revealed low values since readings were taken before irrigation, drought stress caused a large decline in the stomatal conductance. Although the g s values in SIG strategy measured earlier (2 days after irrigation) than conventional strategy, g s values in SIG were lower since SIG treatments irrigated late in the season (watery grain filling) compared to conventional irrigation treatment in which irrigation was applied on 116 DAP that also increased soil water deficit and decreased g s values by 78.6, 63.6 and 60.1% in rain-fed treatment as compared to full irrigated treatments (CI100, SIFG100 and SIG100) on 142 DAP in 2014, and the corresponding reductions were 52.8, 46.1 and 49.9%, respectively, on 140 DAP in 2015.
The rainfall in the Mediterranean region dramatically concentrated in the period November till March; therefore, the wheat water requirement is fulfilled by rainfall during this period. However, in the present study, this period of the first year was an exception due to the lack of rainfall. The major reductions in physiological parameters under water stress in RF, especially at pre- and post-anthesis, had a massive negative effect on winter wheat growth that completely restricted the plant ability of roots and leaves productivity and ultimately these changes caused greater reduction that reached 43.8 and 34.1% at grain yield under rain-fed conditions compared to CI100 and SIG100, respectively. Previous studies indicated that wheat grain yield and water productivity increased with increasing supplemental irrigation and rainfall levels (Li et al., Reference Li, Wang, Zhang, Liu, Xu, Lin, Wang, Yang and Zhang2019; Ali et al., Reference Ali, Xua, Jia, Ma, Ahmad, Adnan, Gerar, Ren, Zhang, Cai, Zhang and Jia2018). Other studies clearly reported that during the critical plant growth stages, chlorophyll content and stomatal conductance are important components of crop photosynthesis that can be used as a practical guide to evaluate yield performance and its response to water deficit (Sato et al., Reference Sato, Abdalla, Oweis and Sakuratani2006; Olszewski et al., Reference Olszewski, Pszczółkowska, Makowska, Kulik and Okorski2009; Ahmed et al., Reference Ahmed, Hassan, Aslam, Akram and Aslam2010; Zivcak, Reference Zivcak2013; Xu, Reference Xu2014; Pour-Aboughadareh et al., Reference Pour-Aboughadareh, Ahmadi, Mehrabi, Etminan, Moghaddam and Siddique2017; Yasir et al., Reference Yasir, Wasaya, Hussain, Ijaz, Farooq, Farook, Nawaz and Hu2019).
The relationship between SPAD and grain yield under different irrigation strategies is depicted in Fig. 7(a). A significant and positive linear relationship of grain yield with flag leaf SPAD values was observed that was based on growth stage, irrigation scheduling and environmental conditions. The regression coefficient between SPAD (as an index of leaf chlorophyll content) and grain yield was recorded as r = 0.72 and r = 0.88 in 2014 and 2015 growing seasons, respectively. The drought stress in the dry season at early vegetative stage accelerated the next growth stages and enhanced the leaf canopy temperature due to the physiological mechanism of increasing respiration and decreasing transpiration and chlorophyll content that led to reduce the photosynthesis process, ultimately decreasing crop productivity for all treatments in comparison to the wet season. In general, the maximum yield was related to the highest SPAD value and applied water (CI100 treatment). These findings are in agreement with Sulok et al. (Reference Sulok, Zainudin, Hassim and Suhaili2012); Ninou et al. (Reference Ninou, Tsialtas, Dordas and Papakosta2013); Islam et al. (Reference Islam, Shamsul-Haque, Akter and AbdulKarim2014); Monostori et al. (Reference Monostori, Árendás, Hoffman, Galiba, Gierczik, Szira and Vágújfalvi2016) who reported that leaf chlorophyll value measured by SPAD chlorophyll meter was found closely related to grain yield and decreased under drought stress conditions. In the present study, grain yield correlated positively and significantly with flag leaf stomatal conductance in both years (Fig. 7(b)). The regression coefficient differed depending on water stress conditions in both growing seasons that in dry year was higher (r = 0.83) as compared to wet year (r = 0.81); similar results were reported by Wang et al. (Reference Wang, Jia, Sun, Wang, Dong, Ma, Jing and Ma2015a, Reference Wang, Zhao, Guo, Li, Jian and Yu2015b), who found the regression coefficient of stomatal conductance, photosynthesis and transpiration rate (at 10, 20 and 30 days after anthesis) was higher under drought stress than well-watered at various growth stages of wheat. In general, the SPAD response to water stress was higher than stomatal conductance response especially in dry year that led to higher relative differences between seasons under SPAD as compared to g s. The observed correlation between both physiological parameters (SPAD and g s) with grain yield was positive and significant. However, r range under SPAD in the experimental years appeared larger because the grain yield response to physiological characteristics differs depending on the type of parameter and its interaction with other parameters as well as several environmental factors. On the other hand, this topic still requires more future studies to analyse and develop relations between the physiological parameters and their effects on wheat productivity.

Fig. 7. The relation between grain yield and SPAD readings (a) and leaf stomatal conductance (b) in the experimental years.
The grain yield reflected strongly high sensitivity to water stress conditions where full conventional irrigation treatment (CI100) produced the highest grain yield 5.9 and 8.3 mg/ha during both dry and wet growing seasons, respectively (Table 2); these results confirmed the findings of Sezen and Yazar (Reference Sezen and Yazar2006) in the Mediterranean region. The drought and high temperature in dry season forced the wheat leaves to early senescence as well as shortened the grain filling duration that led to reduce the yield components of CI100 treatment by 20.5, 11, 19.2% for biomass, thousand grain weight and number of grains per spike, respectively (data not shown); accordingly, the grain yield decreased by 28.9% as compared to CI100 in the second season. As for water regimes, SIF100 and SIFG100 resulted in water saving about 45.9 and 10.7% in the first year and this percentage reached 61.2 and 13.0% in the second year, respectively, as compared to CI100. Rain-fed treatment resulted in decreased yields by 46.4, 39.8 and 49.2% in comparison with full SI treatments (SIG100, SIF100 and SIFG100), respectively, in the first year, whereas in the second year, these values reached to 22.3, 16.3 and 25.4%, respectively, owing to the relative increase of soil content at the beginning of the second season. The increase of grain yield with conventional irrigation strategy was due to timely providing water with optimal requirements of wheat in season, whereas the relative reduction of yield under supplemental irrigation strategies (SIF and SIG) compared to conventional irrigation strategy can be explained by the occurrence of water stress during flowering and grain filling stages which increases crop sensitivity to water stress. With reference to irrigation scheduling of supplemental irrigation, cutting irrigation at grain filling stage (SIF100 strategy) decreased the grain yield to 17 and 29% in wet and dry years as compared to full conventional strategy; however, this decrease reached to 10 and 20% when irrigation was cut off at flowering stage (SIG100 strategy), that means irrigation during grain filling stage can increase yield by 12 and 7% compared to SIF100 strategy in both years of 2014 and 2015. Similar results were reported by Tari (Reference Tari2016) who suggested that in order to reduce wheat yield losses, water deficit should be provided in the milk grain stage. Our findings also are in confirmation with Rao et al. (Reference Rao, Regar, Tanwar and Singh2013).
Results regarding the effect of supplemental and conventional irrigation on IWP were presented in Table 2. The IWP achieved the highest range in growing season 2015 that varied from a maximum of 1.95 kg/m3 in SIF75 to a minimum of 0.20 kg/m3 in SIF25 treatment. The reasons for decreased IWP down to 0.20 kg/m3 are: the first, less irrigation water was applied (18.2 mm) under this treatment (SIF25), the second, production quantity (5.8 mg/ha) was close to grain yield of rain-fed treatment which produced 5.7 mg/ha (Table 2). Supplemental irrigation strategy during flowering and grain filling of lower irrigation levels (25 and 50%) in 2014 achieved relatively higher IWP values (1.46 and 1.19 kg/m3) compared to high irrigation levels (75 and 100%) amounted (1.04 and 0.98 kg/m3); the same effect was observed in the second trial year for conventional strategy that the highest IWP was obtained from the severe stress treatment (level 25%) with average 1.72 kg/m3 and the lowest value was under full irrigated treatment recorded 1.35 kg/m3. These results agree with the findings of Yazar et al. (Reference Yazar, Gökçel and Sezen2009) who reported higher IWP values under deficit irrigation than full irrigation and IWP increased with decreasing irrigation amount and or water use. In the second year, the highest IWP was obtained from SIF75 followed by SIF25 and SIF50; those results are in contrast to the finding of Rao et al. (Reference Rao, Regar, Tanwar and Singh2013); Yazar et al. (Reference Yazar, Gökçel and Sezen2009). On the other hand, those findings are in agreement with the conclusion of Farre and Faci (Reference Farre and Faci2006) who stated that water productivity decreased with decreasing irrigation. Hence, the findings of this study confirmed that the relation between applied water and IWP differed depending on not only irrigation levels but also irrigation strategies. In general, highest IWP was attained from all supplemental irrigation strategies with 75% level due to relative increase in grain yield and lower applied water as compared with other levels. The water productivity of wheat in relation to the amount of water used showed a parabolic trend and the maximum water productivity was obtained at 79% of full irrigation water amount (Yu et al., Reference Yu, Zhao, Gao and Siddique2020).
Conclusions
The experimental results demonstrated that the SPAD and stomatal conductance values were not equally sensitive to water stress during the growth stages of wheat. The wheat crop suffered a greater SPAD and g s reductions when the water stress occurred in grain filling stage (SIF strategy) compared to other strategies (SIG, SIFG, CI), which means that cutting irrigation during the grain filling stage is more sensitive and effective to decrease the yield of winter wheat. Hence, the parameters of SPAD and stomatal conductance can be used for planning water management strategies for wheat production, especially in regions where the water resources are limited. In general, the greatest IWP values were obtained under all supplemental and conventional irrigation strategies with deficit irrigation level 75%. Hence, our study recommends this practice in each irrigation strategy as the best irrigation schedule to achieve maximum economic wheat grain yield and water productivity besides providing high satisfactory degree of IWP under limited water availability conditions. Application of supplemental irrigation at two growth stages (flowering and grain filling stages) with deficit irrigation 75% saved water amounts up to 31.5% with grain yield reduction of 16% as compared to CI100, respectively. Hence, it is concluded that deficit supplemental irrigation strategy (SIFG75) can be recommended under the water scarcity conditions and high water costs for the sustainable wheat production in the Mediterranean region.
Financial support
The authors would like to thank the Scientific Research Projects Unit of Cukurova University for its financial support to conduct this work with contract number CU-D-337.
Conflict of interest
None.
Ethical standards
Not applicable.


