

Because of recent threats to public health such as terrorist attacks and natural catastrophes, there has been a sweeping emphasis, among entities both public and private, on disaster preparation. It is ironic that, although many resources have been focused on preventing deaths involving disasters, little research has been performed on how people die in these events.
On 1 group in particular—workers—the burden of disasters has not been adequately assessed. The resiliency of a community—its “intrinsic capacity predisposed to a shock or stress to adapt and survive by changing its nonessential attributes and rebuilding itself”Reference Manyena1—depends greatly upon the workforce. For isolated events, such as the September 11, 2001 terrorist attacks, epidemiologists have catalogued with great detail the health effects of occupational exposures to the incident itself and its aftereffects. Reference Herbert, Moline and Skloot2,3,4 Contributions to the field of occupational health, however, have for the most part overlooked natural disasters. The circumstances under which workers are injured could shed light on the dangers involved in disaster response and assist prevention activities.
One of the challenges to assessing mortality is determining the boundary by which a death becomes associated with a disaster. Unfortunately, a unifying definition for what constitutes a disaster-related death has evaded the public health establishment. Reference Combs, Parrish, McNabb and Davis5–Reference Uscher-Pines7 Determining the casualty counts for disastrous events typically depends on local health authorities, who as physicians, coroners, or medical examiners will use professional judgment in assessing disaster victimization. The fundamental principles of these judgments, however, have yet to be sufficiently elaborated. They also have not been standardized across local jurisdictions. What separates a disaster death from a nondisaster death in the United States may not be so much a categorical line as a county line.
Death documentation (in the form of death certificates and autopsy reports) serves to trace somatic divergence, not societal disequilibrium. It seeks causes mainly within the scope of the corpse, the body physical. It is not customary for presiding physicians, nor binding upon them, to reveal causes within the social body. Rarely does death accounting explain, or even attempt to explain, the social or environmental roots of a death.Reference Klinenberg8 Thus, for those harmful phenomena drawn as much by their social as their biological component, such as wars and large-scale natural disasters, death investigations lose some of their explanatory power over death, and hence over life.
This article uses a simple definition of disaster relation, one that incorporates both individual exposures and issues of collective response. What disaster begets is more than just physical dangers; it begets a whole system of rescue and restoration, recovery, and rebuilding. The definition used here incorporates deaths involving this element of disaster response or recovery, as well as those stemming from a material chain of cause-and-effect (“direct” deaths). This classification scheme is used to explain how workers die in natural disasters, those events that originate in atmospheric, geological, or ecological forces.
METHODS
To understand the health effects that result from society's coexistence with disasters, I have constructed my own 2-way classification structure. First, I consider whether a death resulted from a hazard that the disaster presents. This hazardous condition results from the internal mode of action of the disaster. It may include essential elements that make direct contact with the victim (tornado hurling a victim), elements arranged by the disaster (signpost lying on a highway), or a removal of barriers to latent hazards (fencing around zoo animals destroyed). The second condition is whether the worker was engaged in a pursuit related to disaster mitigation or counteracting hazardous conditions. Thus, a worker injured from a shattered window during a hurricane would be related to the hurricane via the hazardous condition. Analogously, that same worker injured while boarding the window before landfall would be related to the hurricane because of the pursuit to prevent direct damage from the glass in the window.
Table 1 shows the dual considerations in assessing disaster relation and some examples of each. Note that these 2 strands are not mutually exclusive. A firefighter poisoned by smoke inhalation while fighting a wildfire would be included as a death related to both a hazardous condition and a pursuit.
TABLE 1 Disaster Relation Considerations

Data for this analysis were derived from the Census of Fatal Occupational Injuries (CFOI). Administered by the Bureau of Labor Statistics in conjunction with the 50 states, the District of Columbia, and New York City, CFOI compiles detailed information on all work-related fatal injuries occurring in the United States. The fatality census uses diverse sources to identify, verify, and profile fatal work injuries. Source documents such as death certificates, news accounts, workers' compensation reports, and federal and state agency administrative records are cross-referenced to gather key information about each workplace fatality. More than 25 data elements are collected, coded, and tabulated in the CFOI, including information about the worker and the circumstances surrounding the fatal incident.9
CFOI classifies how an injury occurred according to the Occupational Injury and Illness Classification System, race and ethnicity according to Office of Management and Budget guidelines, and occupation for years 1992–2002 according to the 1990 Occupational Classification System developed by the Bureau of the Census and for 2003–2006 according to the 2000 Standard Occupational Classification system. Codes in which the 2 occupational systems were compatible were merged to produce a single count for all years.
Of the 90,286 fatal occupational injuries detailed by CFOI for the years 1992–2006, I sought to create a dataset of natural disaster fatalities. Those natural disasters for which CFOI could sufficiently provide information were avalanches, blizzards, earthquakes, floods, hurricanes, ice storms, landslides/mudslides/rockslides, tornadoes, and wildfires. Excluded from consideration were intentional floodings, thunderstorms, heat waves, and nonsnow avalanches (such as occur in dirt trenching). Those deaths occurring as part of general prevention measures (eg, flood control construction) not associated with an impending disaster were also excluded.
The actual creation of the dataset involved 3 steps. In the first, 2 standardized variables contained within CFOI—source and secondary source of injury—were used. The source of injury “identifies the object, substance, bodily motion, or exposure which directly produced or inflicted the previously identified injury or illness.” The secondary source of injury or illness “identifies the object, substance, or person that generated the source of injury or illness or that contributed to the event or exposure.” Cases in which the source or secondary source was an environmental phenomenon (eg, flood, tornado) were flagged for consideration in the master dataset.
The second step involved searching fatality narratives, a free-text field within each CFOI case that describes the manner and circumstances of death. Cases containing any key words (eg, “hurricane,” “twister”) that may refer to one of the aforementioned natural disasters were flagged for consideration.
Finally, using the cases flagged by the previous steps, I sought to verify that each case met the criteria for disaster-relation. Cases must have been related to the disaster because of a hazardous condition engendered by the disaster, because the worker was engaged in a significant pursuit toward disaster resistance (eg, prevention, response, or mitigation), or because of a substantive change in work routine at the time of injury resulting from disaster damage. There were only 4 cases of the third condition, which were included for completeness' sake. Each case was assigned a code for both hazardous condition and pursuit of the worker, if applicable.
When possible, data were also analyzed by Metropolitan Statistical Areas (MSA), based upon definitions from the Office of Management and Budget Bulletin Number 05-02, February 2005. When state or MSA data were not publishable, US Census Regions were used for geographic summaries.
Descriptive statistics for the natural disaster dataset were created using SAS Version 8.1 (SAS, Cary, NC). Because CFOI is not a sample of worker fatal injuries and instead reports population parameters, inferential statistics were deemed unnecessary. Pearson's χ2 and Fisher exact test (when actual or expected cell counts were <10) were used to compare the observed counts to expected counts. I performed these tests in Stata Version 8 (StataCorp, College Station, TX) on major demographic and incident-based variables for natural disasters overall and for the 3 major natural disasters (wildfires, hurricanes, and floods).
RESULTS
Disasters in General
A total of 307 natural disaster deaths to workers were identified in 1992–2006, about 20 fatal injuries per year. Mainly because of hurricane fatalities, the latter 2 years had the most deaths: 44 in 2005, 38 in 2006. Figure 1 shows the distribution of fatal injuries across the 9 disasters studied; the 3 most common were wildfires (80 fatalities), hurricanes (72), and floods (62). California had the most disaster fatalities (36), followed by Florida (22), Colorado (20), and Mississippi (18).

FIGURE 1 Work-related natural disaster fatalities, 1992–2006.
Disaster Relation
Figure 2 shows a Venn diagram apportioning fatal work injuries according to whether they are related to a hazardous condition, a pursuit of the worker, or both. A slightly higher percentage of cases (66% vs 60%) involved a hazardous condition than a pursuit. About 27% (83 of 307) were related to both factors. Although this was the general pattern for all natural disasters, this breakdown differed among the individual disasters themselves.

FIGURE 2 All fatal work injuries involving natural disasters (total 307). Four fatal injuries were related to natural disasters by means other than hazardous condition or pursuit.
Demographics
Table 2 presents characteristics of natural disaster fatalities, along with statistical tests comparing the observed counts to the expected from overall fatal occupational injuries. Women were more highly represented in natural disaster fatalities (P = 0.01). Whites made up a greater portion of natural disaster fatalities than all worker fatalities: 81% in natural disasters, 72% for all workers (P < 0.01).
TABLE 2 Major Characteristics of Fatal Work Injuries Overall and for Natural Disasters, 1992–2006

Industry
The crucial feature of industry in natural disaster fatalities is that workers were more likely to be working for government. Although workers in the public sector constitute one tenth of fatal injuries to all workers 1992–2006, they make up about one third of those involving natural disasters (P < 0.01). Federal government workers are particularly overrepresented in natural disaster fatalities (16% vs 3%, P < 0.01)
Wildfires
Eighty wildfire-related fatal injuries were identified in CFOI. Twenty-five percent of the cases occurred in California and an additional 19% occurred in Colorado. Although wildfires averaged 5 worker fatalities per year, spikes occurred in 2003 16 deaths) and 1994 (15 deaths), the result of major multiple-fatality incidents.
Worker Characteristics
Of all disasters studied, wildfire victims were the youngest, with a median age of 31. (The median age for disasters in general was 42.) They were more likely than fatally injured workers overall to be white (89%, P < 0.01) and working for wage or salary (90%, P < 0.01).
Disaster Relation
Nearly every worker was pursuing a form of disaster response. Almost all of them were attempting to quench/divert the fire (80%) or were traveling to/from a site for this purpose (15%).
How Death Occurred
Three principal ways that workers died were directly from the fire and gases (46%), in aircraft incidents (29%), and in motor vehicle incidents (18%). Of the 37 deaths from fire and gases, about twice as many died from smoke or gas inhalation as from burns. Of the 23 aircraft fatalities, 12 occurred in helicopters and another 11 in propeller-driven aircraft. Motor vehicle incidents usually (71%) occurred as part of travel to or from a disaster site.
Industry and Occupation
The dual approaches to fighting wildfires—from the ground and from the air—were reflected in the occupations of the decedents. Firefighting and fire prevention occupations made up 64% of fatalities. Overwhelmingly, these workers came from the public sector, 61% from the federal government alone. Also of note is the median age of these firefighters, 27 years, which was much lower than the median age, 37 years, for all firefighters fatalities during 1992–2006. Aircraft pilots constituted another 24% of fatal injuries. They came mostly from private industry.
Hurricanes
There were 72 hurricane deaths identified in CFOI for 1992–2006. Florida experienced the most fatalities (20), followed by Mississippi (18), Louisiana (12), and North Carolina (7). It is important to note that about two thirds of the cases identified occurred in 2005 or 2006, 32 in 2005, 17 in 2006.
Worker Characteristics
In race/ethnicity, sex, and proportion of self-employed, hurricane deaths were similar to worker deaths in general (P values >0.10).
Disaster Relation
The relation that worker deaths bear to hurricanes is shown in Figure 3. Most fatal injuries were related not so much to material hazards as to pursuits toward disaster response. Eighty-six percent (62 of 72 cases) were related to pursuits and 63% to a pursuit alone with no corresponding hazardous condition.

FIGURE 3 Fatal work injuries involving hurricanes (total 72). Two fatal injuries were related to hurricanes by means other than hazardous condition or pursuit.
Of the 62 cases related by pursuit, the 4 most common undertakings were cleanup (44%), restorative construction (26%), public utilities restoration (8%), and preservation of law and order (6%). Within the cleanup category, 13 injuries (18% of total hurricane fatalities) occurred during tree trimming and removal, whereas 10 injuries (14% of total hurricane fatalities) occurred during debris removal.
How Death Occurred
A variety of events led to hurricane fatalities, including transportation incidents (31%) and being struck by an object (26%). The most common specific events were struck by a falling tree (18%), highway incidents (11%), contact with electric current (10%), falls from roofs (8%), and sinking of fishing vessels (7%).
Pathways of injury were manifold, but some causal components can be sketched. Table 3 demonstrates that a common component of injuries was trees; fatally injured workers in this category were typically involved in cleanup. These workers were usually struck by falling trees or branches.
TABLE 3 Common Components of Fatal Occupational Injury Events Related to Hurricanes (Total 72)
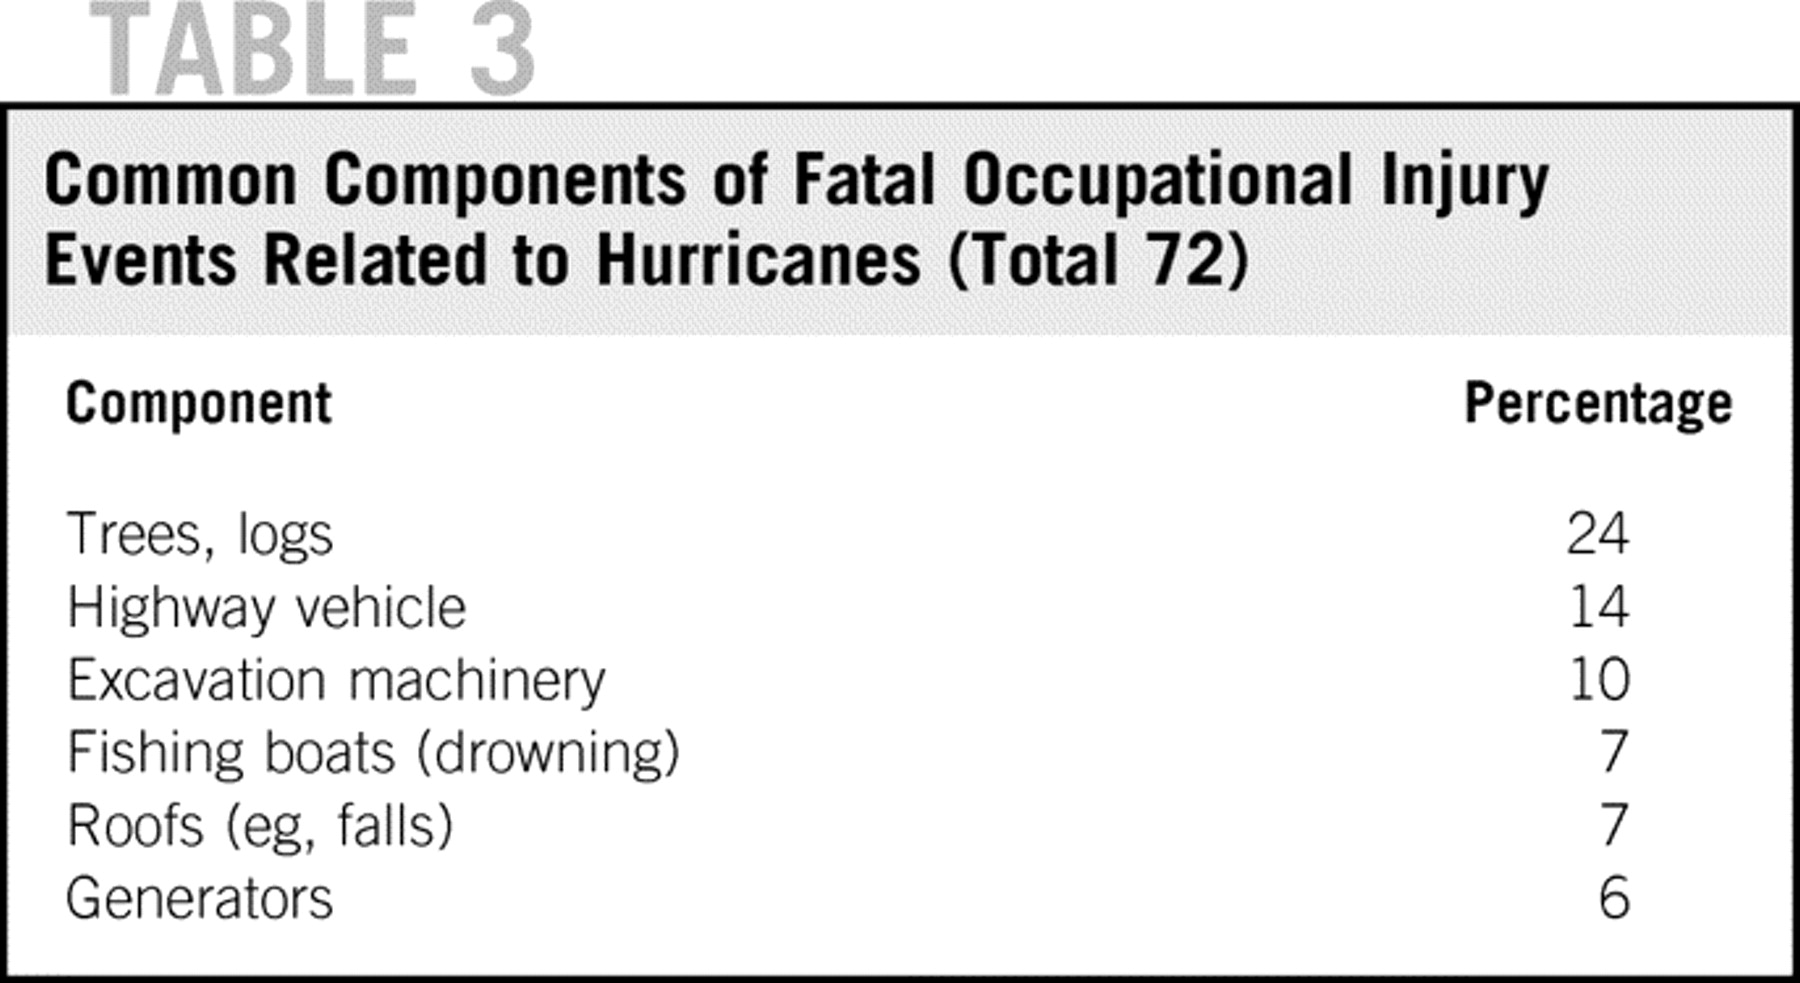
The most frequent natures of fatal injuries were intracranial injuries (28%), multiple traumatic injuries (22%), drownings (15%), and electrocutions (10%).
2005 Hurricanes
A total of 47 fatal occupational injuries could be linked to a hurricane that made landfall in 2005, chief among them Dennis, Katrina, Rita, and Wilma. Deaths occurring in both 2005 and 2006 were considered as long as they were evidently related to the impact of a storm from the 2005 hurricane season. In fact, 30 fatal injuries (64%) took place in 2005 and 17 (36%) occurred in 2006. (Earlier, I noted 32 hurricane deaths in 2005. This is because 2 deaths in 2005 were related to hurricanes that made landfall before 2005).
Disaster relation for the 2005 hurricanes was similar to that displayed in Figure 3 for all hurricanes, with a majority of cases related only to the pursuit. The most common pursuits were cleanup (36% of total cases) and restorative construction (28%).
The 5 most prevalent occupational groups of fatally injured workers were construction and extraction occupations (14 fatalities), grounds maintenance occupations (8), installation, maintenance, and repair occupations (5), transportation and material moving occupations (5), and protective service occupations (4). Nine deaths occurred specifically to construction laborers.
Geographically, Mississippi experienced 17 fatalities (all from Katrina), Florida 14 fatalities (7 from Wilma), and Louisiana 11 (all from Katrina). In Mississippi, only 4 of the 17 fatal occupational injuries were reported in the 2 largest coastal MSAs—Gulfport-Biloxi and Pascagoula—for 2005 and 2006 combined. The other 13 occurred in inland MSAs and areas. In contrast, of Louisiana's 11 cases, almost all occurred in the New Orleans-Metairie-Kenner MSA. In addition, 8 of the 17 fatal occupational injuries in Mississippi involved trees or tree limbs.
Chronologically, fatal work injury events involving hurricanes occurred a median of 36.5 days (25th percentile 6.5, 75th percentile 125) after the landfall date of the corresponding storm. In the 11 cases in which an identifiable hazardous condition was involved, injuries occurred a median of 5 days afterward. (Note that because of the multitude of hurricanes to strike Florida in 2005, the exact hurricane that a case was related to could not be determined in 3 instances. These 3 were included in the total of 47 but excluded from the median day calculations).
Floods (Excluding Hurricane Floods)
Sixty-two fatalities involving floods were identified in 1992–2006. Of these, 7 occurred in California and 7 in Texas. The highest number of fatalities were experienced in 1993 (10 fatalities) and 1998 (8 fatalities).
Worker Characteristics
Flood fatalities were different from overall worker fatalities in that a greater percentage of women were represented (P = 0.03). None of the 3 racial or ethnic categories were significantly different than expected. The majority (94%, P < 0.01) of fatally injured workers were working for wage and salary.
Disaster Relation
As Figure 4 illustrates, disaster relation for floods involved hazardous conditions engendered by the flooding 89% of the time; in fact, disaster relation was confirmed by hazardous conditions alone (without the worker pursuing a task of disaster resistance) in 56% of cases. The primary hazardous condition was the presence of floodwaters themselves.

FIGURE 4 Fatal work injuries involving floods (total 62). Two fatal injuries were related to floods by means other than hazardous condition or pursuit.
How Death Occurred
Death resulted from drowning in 76% of cases. About half (23 of 47) of drownings occurred in motor vehicle incidents, usually after being submerged in roadways or streams.
At the time of injury, nearly half of workers (45%) were operating or riding in motor vehicles. The vehicle was a truck in 43% of these fatalities and a car in 36%. Most of these motor vehicle incidents resulted in drowning (82%) and involved workers not engaged in disaster-related pursuits (86%). Other workers were, at the time of injury, rescuing (15%) or performing flood control (8%). All of the deaths during rescue operations were from drowning.
Industry and Occupation
As in hurricanes, fatally injured workers in floods came from a variety of occupations. The 2 most common occupation groups were protective service workers (19%) and motor vehicle operators (18%). About one third of total flood deaths occurred to workers in the public sector.
Tornadoes
There were 33 occupational fatalities involving tornadoes. More than any other disaster studied here, the incidence of tornado injuries occurred to workers unaffiliated with disaster response. A hazardous condition, the direct onset of the tornado, was involved in every death. Victims came from a variety of industries—91% from private industry. Women were the fatally injured worker 18% of the time. Tornadoes were distinct in that nearly half of fatalities occurred to workers within structures. Another 21% of workers were injured within automobiles.
The most common event was caught in collapsing materials (42%), followed by struck by object (21%). Nine (27%) of the total tornado fatalities occurred to truck drivers.
Landslides
Of the 17 landslide fatalities, 6 occurred in California and 4 in Oregon. Most deaths (76%) were related only to the onset of the landslide. Almost all of the fatal injuries occurred between November and February. Six of the workers were driving vehicles at the time of injury. The 2 most common occupations were timber cutters (5 fatalities) and truck drivers (5 fatalities). Most victims were white and working for private industry.
Avalanches
Snow avalanches claimed the lives of 16 workers during the 15-year period. All of the deaths resulted from direct forces. Three deaths occurred in Alaska and 3 in Colorado. All of the victims were white, and three fourths were 35 years and older. Thirteen (81%) were suffocations or asphyxiations. Eleven deaths (69%) were to workers in private industry, 5 in government.
Ice Storms
Of the 14 ice storm fatalities, 8 occurred in the South Census region (Alabama, Arkansas, Delaware, Florida, Georgia, Kentucky, Louisiana, Maryland, North Carolina, Oklahoma, South Carolina, Tennessee, Texas, Maryland, Virginia, Washington, DC, and West Virginia). The most common month was January. Most of the victims were white males. Ten (71%) of the fatalities were electrocutions, 6 of these from contact with power lines. Five of the total victims were restoring power, 4 were trimming trees.
Blizzards
Only 9 worker deaths could be traced to blizzards. Most were transportation incidents, primarily aircraft incidents.
DISCUSSION
No general criteria for assessing the disaster relation of a fatality exist. For example, a death from Hurricane Katrina can mean different things to different people, including to various health professionals. After Katrina, Louisiana, Mississippi, and Georgia each used different principles to account for victims.10This article used a 2-way classification structure—assessing both direct deaths and deaths resulting from aspects of disaster preparation and response—to uncover how natural disasters negatively affect the workforce.
A total of 307 fatal occupational injuries were identified in the CFOI database that could be traced to a natural disaster. As compared with fatal occupational injuries in general, these fatalities involved more white, non-Hispanic workers, and those in the public sector. Deaths involved hazardous conditions and disaster-related pursuits in nearly equal measure (66% vs 60%), with about one quarter of cases involving both. Divergence from this pattern was evidenced in individual disasters. On the one hand, disaster-related pursuits predominated in wildfires, hurricanes, and ice storms. On the other hand, hazardous conditions were more significant in floods, tornadoes, landslides, avalanches, and blizzards.
The etiology of fatal injuries depended on the disaster. In the 80 wildfire fatalities, many fatalities stemmed directly from exposure to fire and gases of the wildfire (46%), although aircraft and highway incidents contributed greatly to the total. The 72 hurricane deaths resulted from diverse circumstances, but trees (usually by falling) were the most common component of the injury event. Of the 62 flood deaths, three quarters were drownings. Victims were driving or passengers in motor vehicles 45% of the time. This percentage of occupational flood deaths that were motor vehicle–related is similar to the 49% that Jonkman and Kelman found for the percentage of US total flood deaths that took place in a vehicle.Reference Jonkman and Kelman11
Although popular imagery of natural disasters centers around a crisis phase, and indeed this is likely when most deaths occur to the general population, the pivotal moment for occupational fatalities may occur much later, depending on the disaster. For the 2005 hurricanes (Dennis, Katrina, Rita, Wilma) studied here, fatal occupational injuries occurred a median of 36.5 days after landfall (excluding 3 cases in which days could not be calculated). More than 60% of these hurricane deaths took place during cleanup and restorative construction efforts. It may be stated that many of the industries associated with the recovery phase have, in general, relatively large fatality rates. In 2005, for example, construction (11.1 fatalities per 100,000 employed) and landscaping services (15.4 fatalities per 100,000 employed) had national fatality rates much higher than the all-worker rate of 4.0 fatalities per 100,000 employed. (Employment data were based on the Current Population Survey).
Moreover, areas most drastically impacted by a disaster may not necessarily be the setting for most occupational deaths. Katrina-related deaths to workers in Louisiana took place, as expected by overall population mortality following the hurricane, in the New Orleans-Metairie-Kenner MSA. By contrast, worker deaths in Mississippi occurred primarily outside of the 2 principal MSAs (Gulfport-Biloxi and Pascagoula) that experienced the brunt of the storm surge.
Conceptually, it may be helpful to classify natural disaster exposures into 3 types: those that affect a coherent, measured workforce who are engaged in disaster-related pursuits; those that affect an emergent workforce engaged in disaster-related pursuits; and those that affect workers unaffiliated with disaster response. First, many disasters are such that they are treated with a relatively homogeneous, coherent workforce. Wildfire deaths, for instance, occurred mainly to young, white workers, most of whom are professional firefighters. These workers carry out a nonincidental form of disaster response; disaster response, in this case, to wildfires, is instilled into the core job duties and organizational attitudes, as for example, the routine workouts expected of smokejumpers (firefighters who parachute into wilderness fire areas).12
Whereas some disasters can be covered under clearly demarcated institutional umbrellas (such as the US Forest Service for wildfires), the second type of disasters summons a more diverse response effort, uniting an agglomeration of trades in common cause without standardized approaches and training. Hurricanes fit this model of disaster response, probably because the number of skills required to overcome hurricane damage are relatively more diverse and because the extent of damage usually requires migration into the disaster workforce of those unrehearsed in institutional scripts of response.
The third type affects workers from the hazardous conditions side alone. Tornadoes and avalanches conform to this view, in that workers fatally injured in these events were independent of disaster response. Tornadoes affected diffuse areas of the workforce with little regard for industry and occupation.
This does not mean that a given disaster poses risks only within one of these conceptual milieus. Floods present a hybrid case. Many fatally injured workers are, in fact, engaged in disaster-related pursuits, particularly rescue and flood control. (The degree of professionalism in these pursuits is difficult to ascertain.) Nonetheless, more than half (35 of 62) of flood fatalities involved no identifiable pursuit; these mainly resulted from workers traveling by motor vehicle through floodwaters as part of nondisaster job duties.
The 3 categories described here are intended to clarify how natural disasters affect workers, not to imply that 1 approach is preferable. For certain disasters, notably terrorist attacks, there does seem to be momentum in the United States for the first type, subsuming various areas of disaster preparation and response under fewer organizational umbrellas. Federal financial support to local governments is now often contingent on the regularization of emergency response, preparing sectors of the workforce for the possible scenarios of domestic terrorism: dirty bombs, biological agents, mass evacuations, and so forth. The model for wildfires may soon be the standard: a standing, professionalized army of responders as opposed to an ad hoc militia of responders.
There are a few limitations to this study. Although numerous definitions of disaster exist, this study avoids careful parsing and instead concentrates on particular natural events, regardless of magnitude, size, damage, or cost. The principal method of identifying natural disaster cases was to search for particular keywords, such as blizzard, flood, and tornado. Thus, the events included in this study may not necessarily be universally defined as disasters; however, they are occurrences that fit the mold of an event that experienced on a large scale or during a long period would fall under the privileged heading of disaster. If not disasters per se, then they are at least microcosms of them.
Along the same lines, heat waves were excluded from this study because a death from heat exposure may not occur within a generally defined heat wave disaster. CFOI, although often detailed, does not allow such a fine distinction to be made consistently. This exclusion is particularly unfortunate for prevention because, according to the Centers for Disease Control and Prevention, heat waves claimed more lives in the United States from 1979–2003 than earthquakes, floods, hurricanes, and tornadoes combined.13 Future research is needed to isolate the effects on workers of severe temperature events.
Because the object of this inquiry—environmental determinants of worker injury—is truly peripheral to the emphasis of CFOI, the dataset may not be a complete count. Precise use of key words, such as flood or hurricane, is at the discretion of state narrative writers and their source documentation. When either makes spare reference to the exact terms captured by this study, an undercount will appear. For some injuries, notably those from tornadoes, it is a challenge to frame even a rudimentary account without reference to the storm. One cannot perceive the same holding true for floods, particularly aftermath activities, when flood damage need hardly be mentioned to adequately portray the injury.
Another shortcoming of using free-text fields is that potential pursuits and hazardous conditions may not have been specified. It is difficult to know all of the risk factors that contributed to an injury event and the role that disaster played in creating these risk factors. The fatality records probably contained undocumented hazardous conditions that lie unaccounted for in this study. In addition, because of the use of key words and the difficulty in referring a case to a specific environmental threat, the disasters, except for the 2005 hurricanes, could not be evaluated by severity; 1 flood may have been neighborhood level, whereas another may have affected many states. This is significant because one may wonder whether it is the high-frequency, low-magnitude disasters, the low-frequency, high-magnitude ones, or the middle sort that present the most absolute risks to workers.
The transcendent spirit of disaster preparation and response that has animated the United States post-September 11, 2001 and post-Katrina comes with significant challenges to occupational health. Disasters challenge the public health apparatus as a whole because they are usually not contained to 1 site, they do not affect just 1 class of person, and they cannot be studied under 1 discipline. They test the specialized compartments built into bureaucratic management. Yet with the increased social desirability of disaster death prevention there has been little corresponding increase in expert knowledge about how people actually perish in these large-scale events.
For mortality assessments, consistent definitions across jurisdictions are needed that account for both direct, material contact and for exposures that occur during disaster response. Unfortunately, disaster as a cause of death does not announce itself the same way that arterial diameter can speak for cardiovascular disease or a gunshot wound for a violent act. Thus, a sophisticated, coherent case definition for disaster relation needs to be developed. Moreover, research is needed on how demographic (education, sex), social (emergency warnings, psychosocial coping resources), and environmental (infrastructure quality, underlying geology) factors influence disaster outcomes.
Conclusions
This article is the first to assess the effects of various disasters on occupational health using a systematic definition of what constitutes a disaster-related death. Because workers are often the ones who assume the mantle of protecting the population from adverse health effects, it is important to evaluate how they themselves experience the many risks that a disaster event presents. This article demonstrates not only the complexity of the burgeoning field of disaster preparation but also the opportunity the field presents for significant improvements in practical, lifesaving knowledge.
Author's Disclosures
The authors report no conflicts of interest.


