


INTRODUCTION
The modern Nile delta developed in the Middle and Late Holocene (Sestini, Reference Sestini1989; Stanley and Warne, Reference Stanley and Warne1993), after the Nile hydroclimatic system had been finally established ca. 7 ka BP (Shanahan et al., Reference Shanahan, McKay, Hughen, Overpeck, Otto-Bliesner, Heil, King, Scholz and Peck2015). Transformations of the delta landscape since that time have exerted significant effect on establishment and development of the ancient Egyptian state.
Four major factors steered the Nile delta development during the Holocene, including sea level changes, subsidence of the area, fluvial deposition, and sediment compaction. The sediment supply was highly dependent on the climate-driven Nile flow, reflected by discharges of the main tributaries, among which the Blue Nile and the Atbara were modulated by the Ethiopian Monsoon intensity, which was dependent on a millennial-scale southern displacement of the Intertropical Convergence Zone (ITCZ). Previous research on the Nile delta has been focused mostly on influence of sea level changes and subsidence rate as the basis to reconstruct the Nile delta paleogeography and coastal geomorphology (e.g., Stanley and Warne, Reference Stanley and Warne1992, Reference Stanley and Warne1994; Marriner et al., Reference Marriner, Flaux, Morhange and Kaniewski2012b). Other recent research has addressed the timing of climate-related vegetation changes in the Holocene, sediment transport of the Nile, and human effects since the Middle Holocene (e.g., Peglar et al., Reference Peglar, Birks, Birks, Appleby, Faithi, Flower, Kraïem, Patrick and Ramdani2001; Bernhardt et al., Reference Bernhardt, Horton and Stanley2012; Marriner et al., Reference Marriner, Flaux, Kaniewski, Morhange, Leduc, Moron, Chen, Gasse, Empereur and Stanley2012a; Pennington et al., Reference Pennington, Sturt, Wilson, Rowland and Brown2017; Ginau et al., Reference Ginau, Schiestl and Wunderlich2019; Zhao et al., Reference Zhao, Thomas, Salem, Alassald, Liu, Sun, Chen, Ma, Finlayson and Chen2020).
The modern hydroclimatic system in the Nile Basin was established in the Middle Holocene when sea level approached its modern position and the African Humid Period (AHP), with significantly higher precipitation than at present as well as savanna and permanent lakes in the Sahara, was followed by more arid conditions (cf., Kindermann et al., Reference Kindermann, Bubenzer, Nussbaum, Riemer, Darius, Pöllath and Smettan2006), accompanied by the weaker discharge of the Nile and decreasing sedimentation rates in the delta (cf., Pennington et al., Reference Pennington, Sturt, Wilson, Rowland and Brown2017). In the coastal zone of the Nile delta, a change from a freshwater to a marine system resulted from either reduced Nile discharge at the termination of the AHP (Flaux et al., Reference Flaux, Morhange, Marriner and Rouchy2011, Reference Flaux, Claude, Marriner and Morhange2013) or marine influx caused by erosion of sandy barriers due to a reduced sediment supply (Marriner et al., Reference Marriner, Flaux, Morhange and Stanley2013). These hydrological transformations, driven by insolation changes and latitudinal shifts of the ITCZ, were responsible for landscape evolution in the Nile delta (cf., Marriner et al., Reference Marriner, Flaux, Kaniewski, Morhange, Leduc, Moron, Chen, Gasse, Empereur and Stanley2012a).
The sediment load of the Nile and its annual discharge in the Holocene have been dominated by input from the Blue Nile and Atbara, which drain the Ethiopian Highland. The White Nile drains Central Africa, providing minor year-round discharge, and accounts for an insignificant part of the sediment flux (Woodward et al., Reference Woodward, Macklin, Fielding, Miller, Spencer, Welsby and Williams2015) because most of its load is trapped in large headwaters lakes and in marshes of South Sudan (Garzanti et al., Reference Garzanti, Andò, Padoan, Vezzoli and El Kammar2015). Geochemical and lithological characteristics of the Nile sediments indicate that the most important contributions to floodplain sedimentation were the Blue Nile, Atbara, and secondarily, windblown sources. During the AHP, secondary contributions to valley floor sedimentation were also made by wadis and windblown sediments, but as the climate became drier after 4.5 ka, the wadi input became considerably restricted (Pachur and Kröpelin, Reference Pachur and Kröpelin1987; Woodward et al., Reference Woodward, Macklin, Fielding, Miller, Spencer, Welsby and Williams2015; Zhao et al., Reference Zhao, Liu, Salem, Marks, Welc, Sun, Jiang, Chen and Chen2017). Decreased discharge of the Nile and rising sea level in the Holocene were reflected by input of saline water, accompanied by more abundant brackish and saltwater fauna in the coastal lagoons (Dumont and El-Shabrawy, Reference Dumont and El-Shabrawy2007).
The geological evolution of the Nile delta coastal region in the Holocene was extensively examined during a research project carried out by the Smithsonian Institution's Mediterranean Basin (MEDIBA) Program in the 1980s–1990s (Stanley and Warne, Reference Stanley and Warne1994) when 87 drill cores were collected in the coastal fringe of the delta (Stanley et al., Reference Stanley, McRea and Waldron1996). Results of this project were supplemented by more recent studies of the Holocene sedimentary sequence (Marriner et al., Reference Marriner, Flaux, Kaniewski, Morhange, Leduc, Moron, Chen, Gasse, Empereur and Stanley2012a, Reference Marriner, Flaux, Morhange and Stanley2013; Flaux et al., Reference Flaux, Claude, Marriner and Morhange2013; Pennington et al., Reference Pennington, Sturt, Wilson, Rowland and Brown2017) and by geoarchaeological investigations (Wilson and Grigoropoulos, Reference Wilson and Grigoropoulos2009; Wilson, Reference Wilson, Robinson and Wilson2011). There are ample existing data, but high-resolution core records from the north-central part of the Nile delta are extremely rare (see Arbouille and Stanley, Reference Arbouille and Stanley1991). Therefore, in February 2014, we drilled the borehole BO-1 at the north-eastern shore of the Burullus Lagoon in the north-central part of the delta (Fig. 1). The applied drilling technique enabled us to get a good core that could be sampled for multi-proxy analyses. Results from the core BO-1 were correlated with the neighboring low-resolution borehole logs S43 and S47 of Stanley et al. (Reference Stanley, McRea and Waldron1996), as well as 1 and 2 of Sestini (Reference Sestini1989). All five drilling sites are located close to a mouth of the ancient Sebennitic branch of the Nile (Arbouille and Stanley Reference Arbouille and Stanley1991; Stanley and Warne Reference Stanley and Warne1998; Muhs et al., Reference Muhs, Roskin, Tsoar, Skipp, Budahn, Sneh, Porat, Stanley, Katra and Blumberg2013), which could act as a former moderating factor to locate settlements in the Pre-dynastic Period of the ancient Egyptian state.
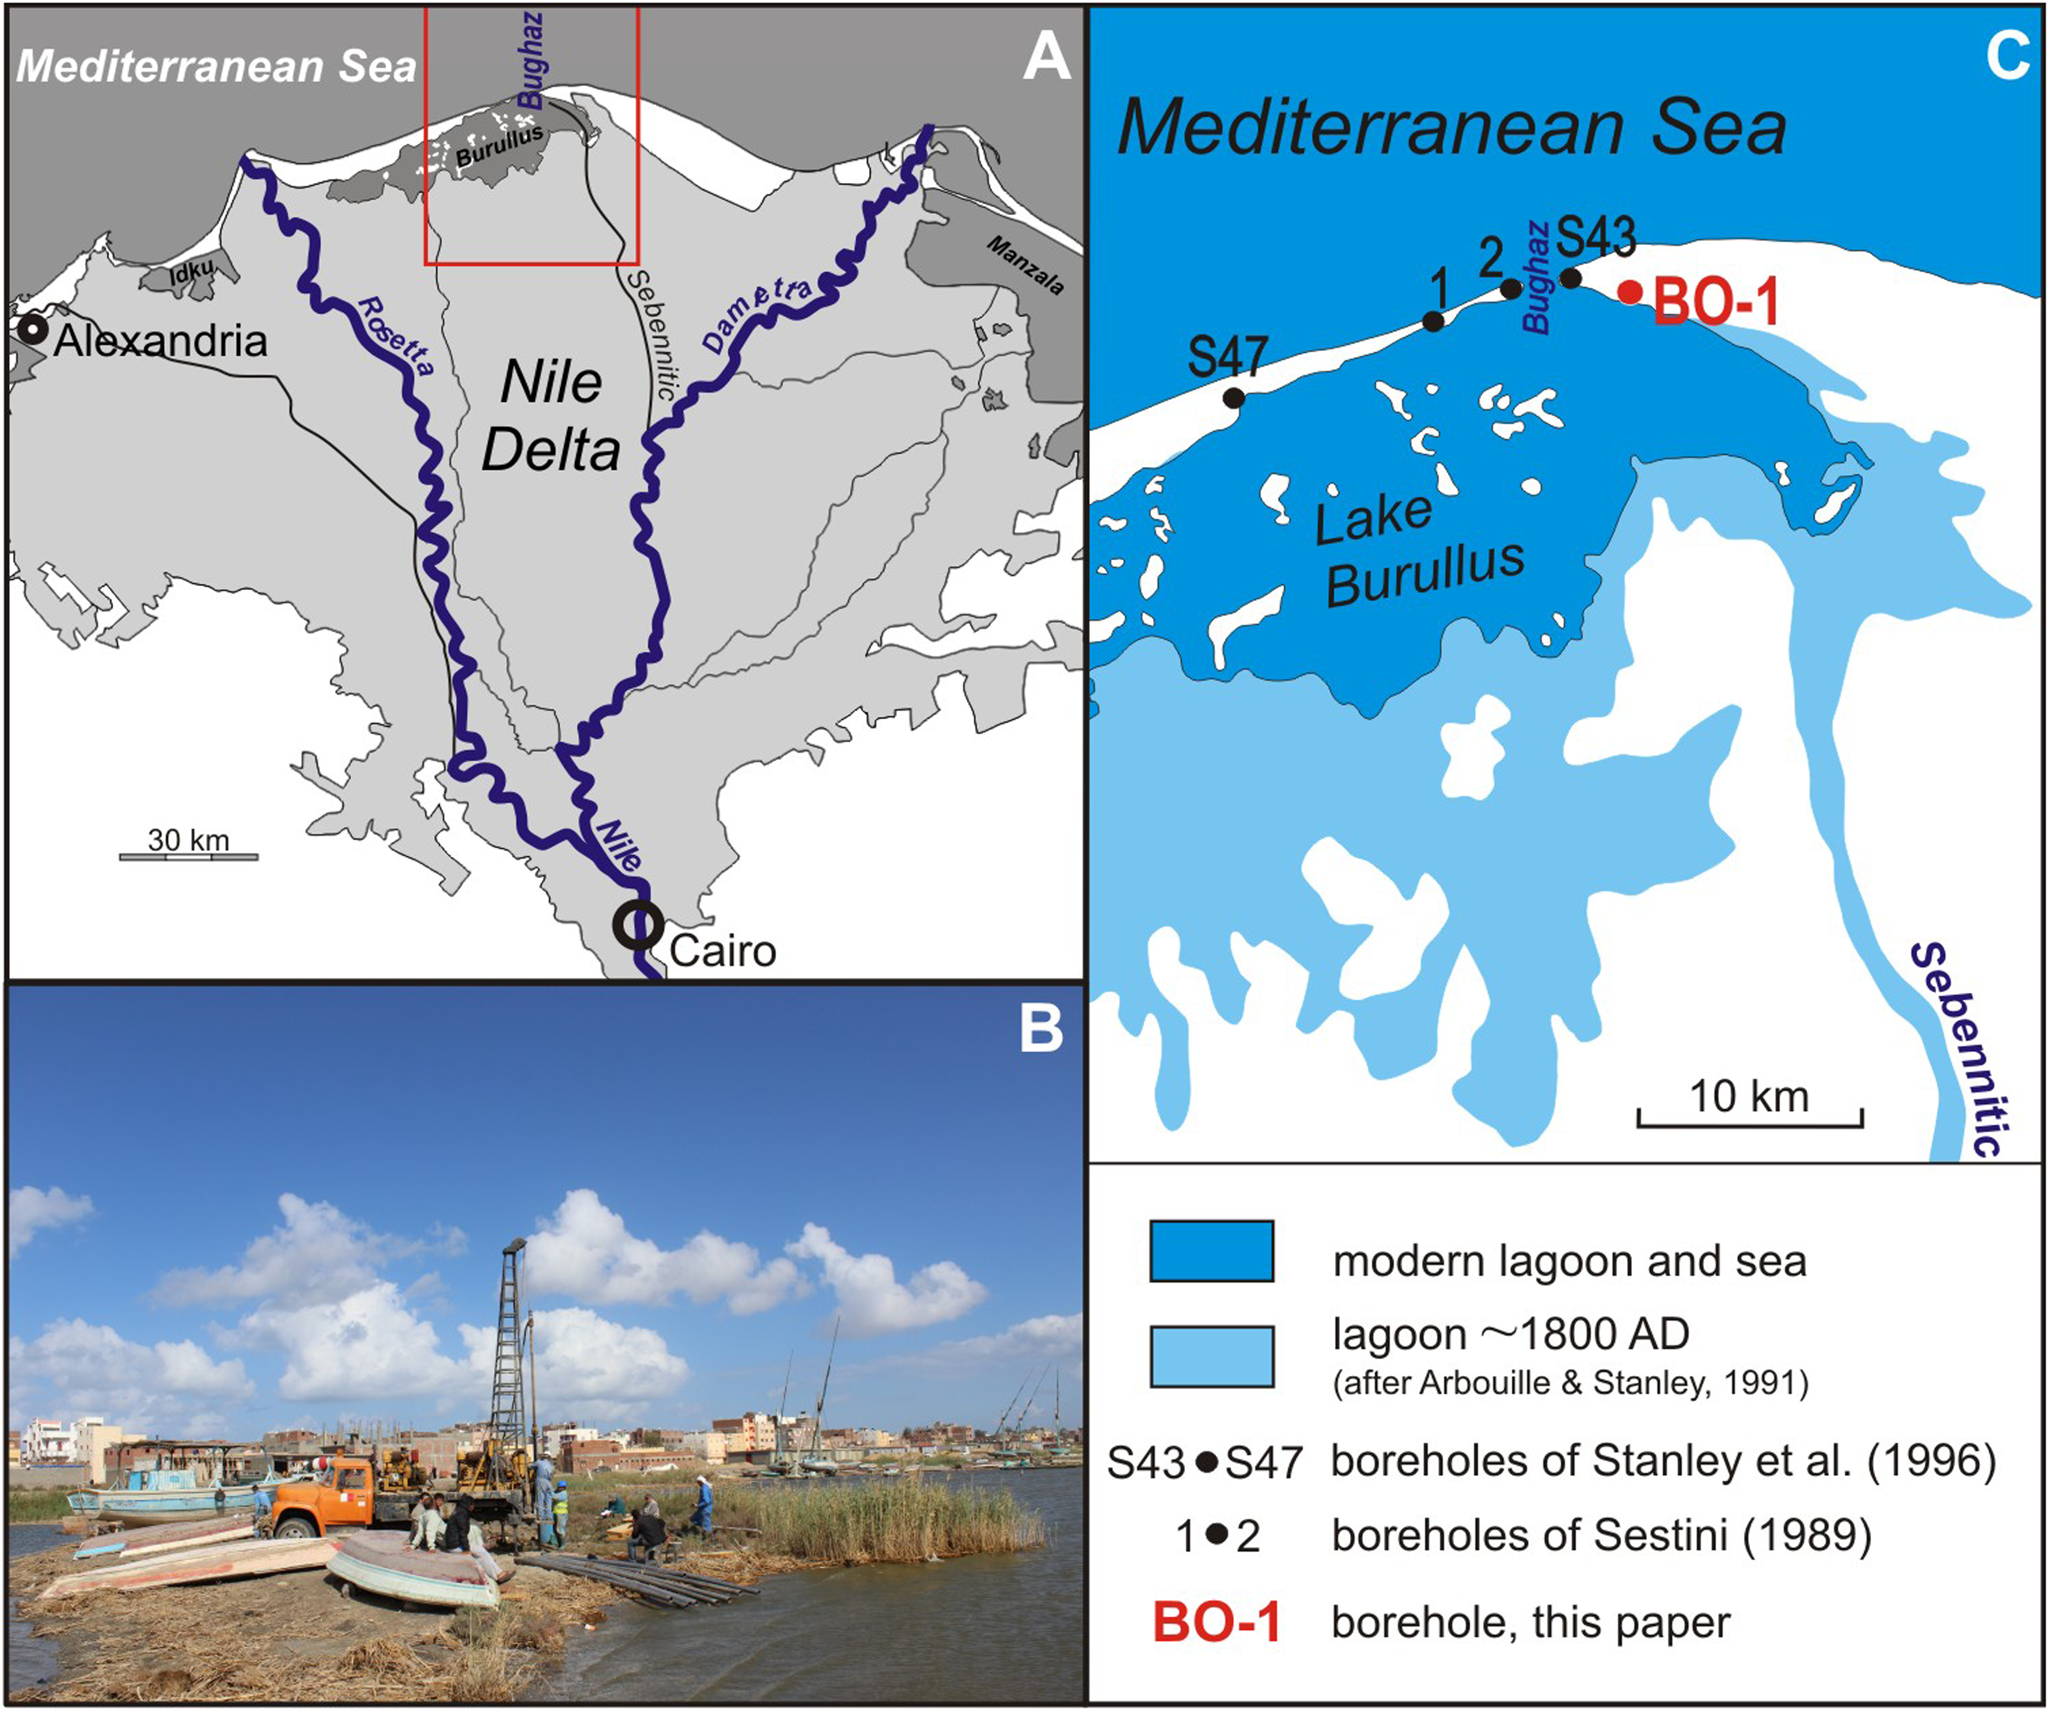
Figure 1. (color online) Location: (A) study area (rectangle) in the Nile delta, black lines are inactive river branches; (B) drilling site BO-1 at the northeastern shore of the Burullus Lagoon; (C) location of the boreholes BO-1 (this study), S43 and S47 of Stanley et al. (Reference Stanley, McRea and Waldron1996), and 1 and 2 of Sestini (Reference Sestini1989), with the Burullus Lagoon extension at ca. 1800 AD and at present.
The aim of the paper is to present results of high-resolution multi-proxy analyses based on the samples provided by the core BO-1 and use them to reconstruct paleogeography and paleoenvironment of the Burullus Lagoon in the Middle and Late Holocene. The results provide a background to the evolution of the northern part of the Nile delta, which was a heavily populated area in prehistoric times (5200–3100 BC) and in the Pharaonic Period (3100–30 BC).
STUDY AREA
The Burullus Lagoon (known also as Brolus, Bahra El Burullus, Borullus) is one of the most important wetlands in the mid-northern part of the Nile delta (Fig. 1A), and is registered as a Ramsar site (Shaltout and Al-Sodany, Reference Shaltout and Al-Sodany2008). It is the second largest coastal lagoon in Egypt (65 km long, 6–16 km wide, area 460 km2) and is separated from the Mediterranean Sea by a narrow strip of land covered with sand bars and dunes (Saad, Reference Saad1979–1980; Dumont and El-Shabrawy, Reference Dumont and El-Shabrawy2007). The lagoon is very shallow (maximum depth is 2.4 m). It is deeper and mostly freshwater in the western part, and more shallow and saline in the eastern sector due to sea water inflows through the Bughaz inlet, which connects the lagoon with the sea (Fig. 1C). The water body is polymictic and turbid, with water temperature ranging from 11°C in winter to 30°C in summer. The lagoon bottom is composed mostly of sand with admixture of silt in the northern part and black to olive-gray mud with mollusc shells in the south (Saad, Reference Saad1976, Reference Saad1979–1980; Zalat and Servant Vildary, Reference Zalat and Servant Vildary2005). The adjoining area is composed of salt marshes, sand dunes, drainage canals, and islets (Saad, Reference Saad1979–1980; Shaltout and Al-Sodany, Reference Shaltout and Al-Sodany2008).
The origin of the lagoon is closely related to the development of the Nile delta in the Middle Holocene when sea level rose gradually and transgressed, occupying a northern part of the modern Nile delta area (Stanley and Warne, Reference Stanley and Warne1992, Reference Stanley and Warne1998). Sea level was stabilized at about its present level ca. 6 ka BP (Hamza, Reference Hamza2005). Depositional activity of the Nile in the Middle Holocene resulted in expansion of the delta and development of a vast marine swamp in the northern part of the delta. The swamp was crossed by branches of the Nile that transported sediment-loaded water, gradually depositing levees, seasonally overflowing and depositing fine mud in the swamps, while laying down coarser sand seaward of the swamps. The modern brackish lake with salt marshes was probably established in the seventh century AD due to intensive fluvial deposition, development of sand dunes north of the lake, and subsidence of the pre-existing tidal swamps behind this natural barrier (Dumont and El-Shabrawy, Reference Dumont and El-Shabrawy2007). Since this time, the lake has been fed by Nile water through the Sebennitic branch.
MATERIALS AND METHODS
The drill core BO-1 (location: 31°34.717′N, 31°00.386′E), 11 m long, was collected using a trailer-mounted Acker I rotary-percussion machine drilling-rig system (Fig. 1B). The core sediment was analyzed and sampled generally at intervals of 5 cm for lithology and scanning electron microscopy with energy dispersive spectroscopy (SEM/EDS), 10 cm intervals for magnetic susceptibility measurement, and at selected intervals, depending on the material available, for faunal analysis and radiocarbon dating. The drilling technique applied to logs S43 and S47 of Stanley et al. (Reference Stanley, McRea and Waldron1996) and to borehole logs 1 and 2 of Sestini (Reference Sestini1989) resulted in their low-resolution. We reinterpreted the published results of this earlier research in order to provide a broader geological perspective of the north-central part of the delta.
Lithology
Sediment recovery was continuous by using a progressively connecting metal core tube probe. Plastic tubes (10 cm in diameter) were inserted inside a metal probe. The recovery of mud-rich sections of the core was very good and its original sedimentological and lithological structures were preserved. Collection of very soft sand and unconsolidated mud was less successful (Fig. 2), which limited the number of samples collected for the analysis. Plastic tubes were opened in the laboratory of the Kafrelsheikh University in Egypt, then carefully described based on visual observations including depth, thickness, color, texture, and sedimentary structures. High-resolution photographs of each core fragment completed the macroscopic description. Lithology of core BO-1 was compared and correlated with logs of the drillings S47, S43, 1, and 2 (Fig. 1C).
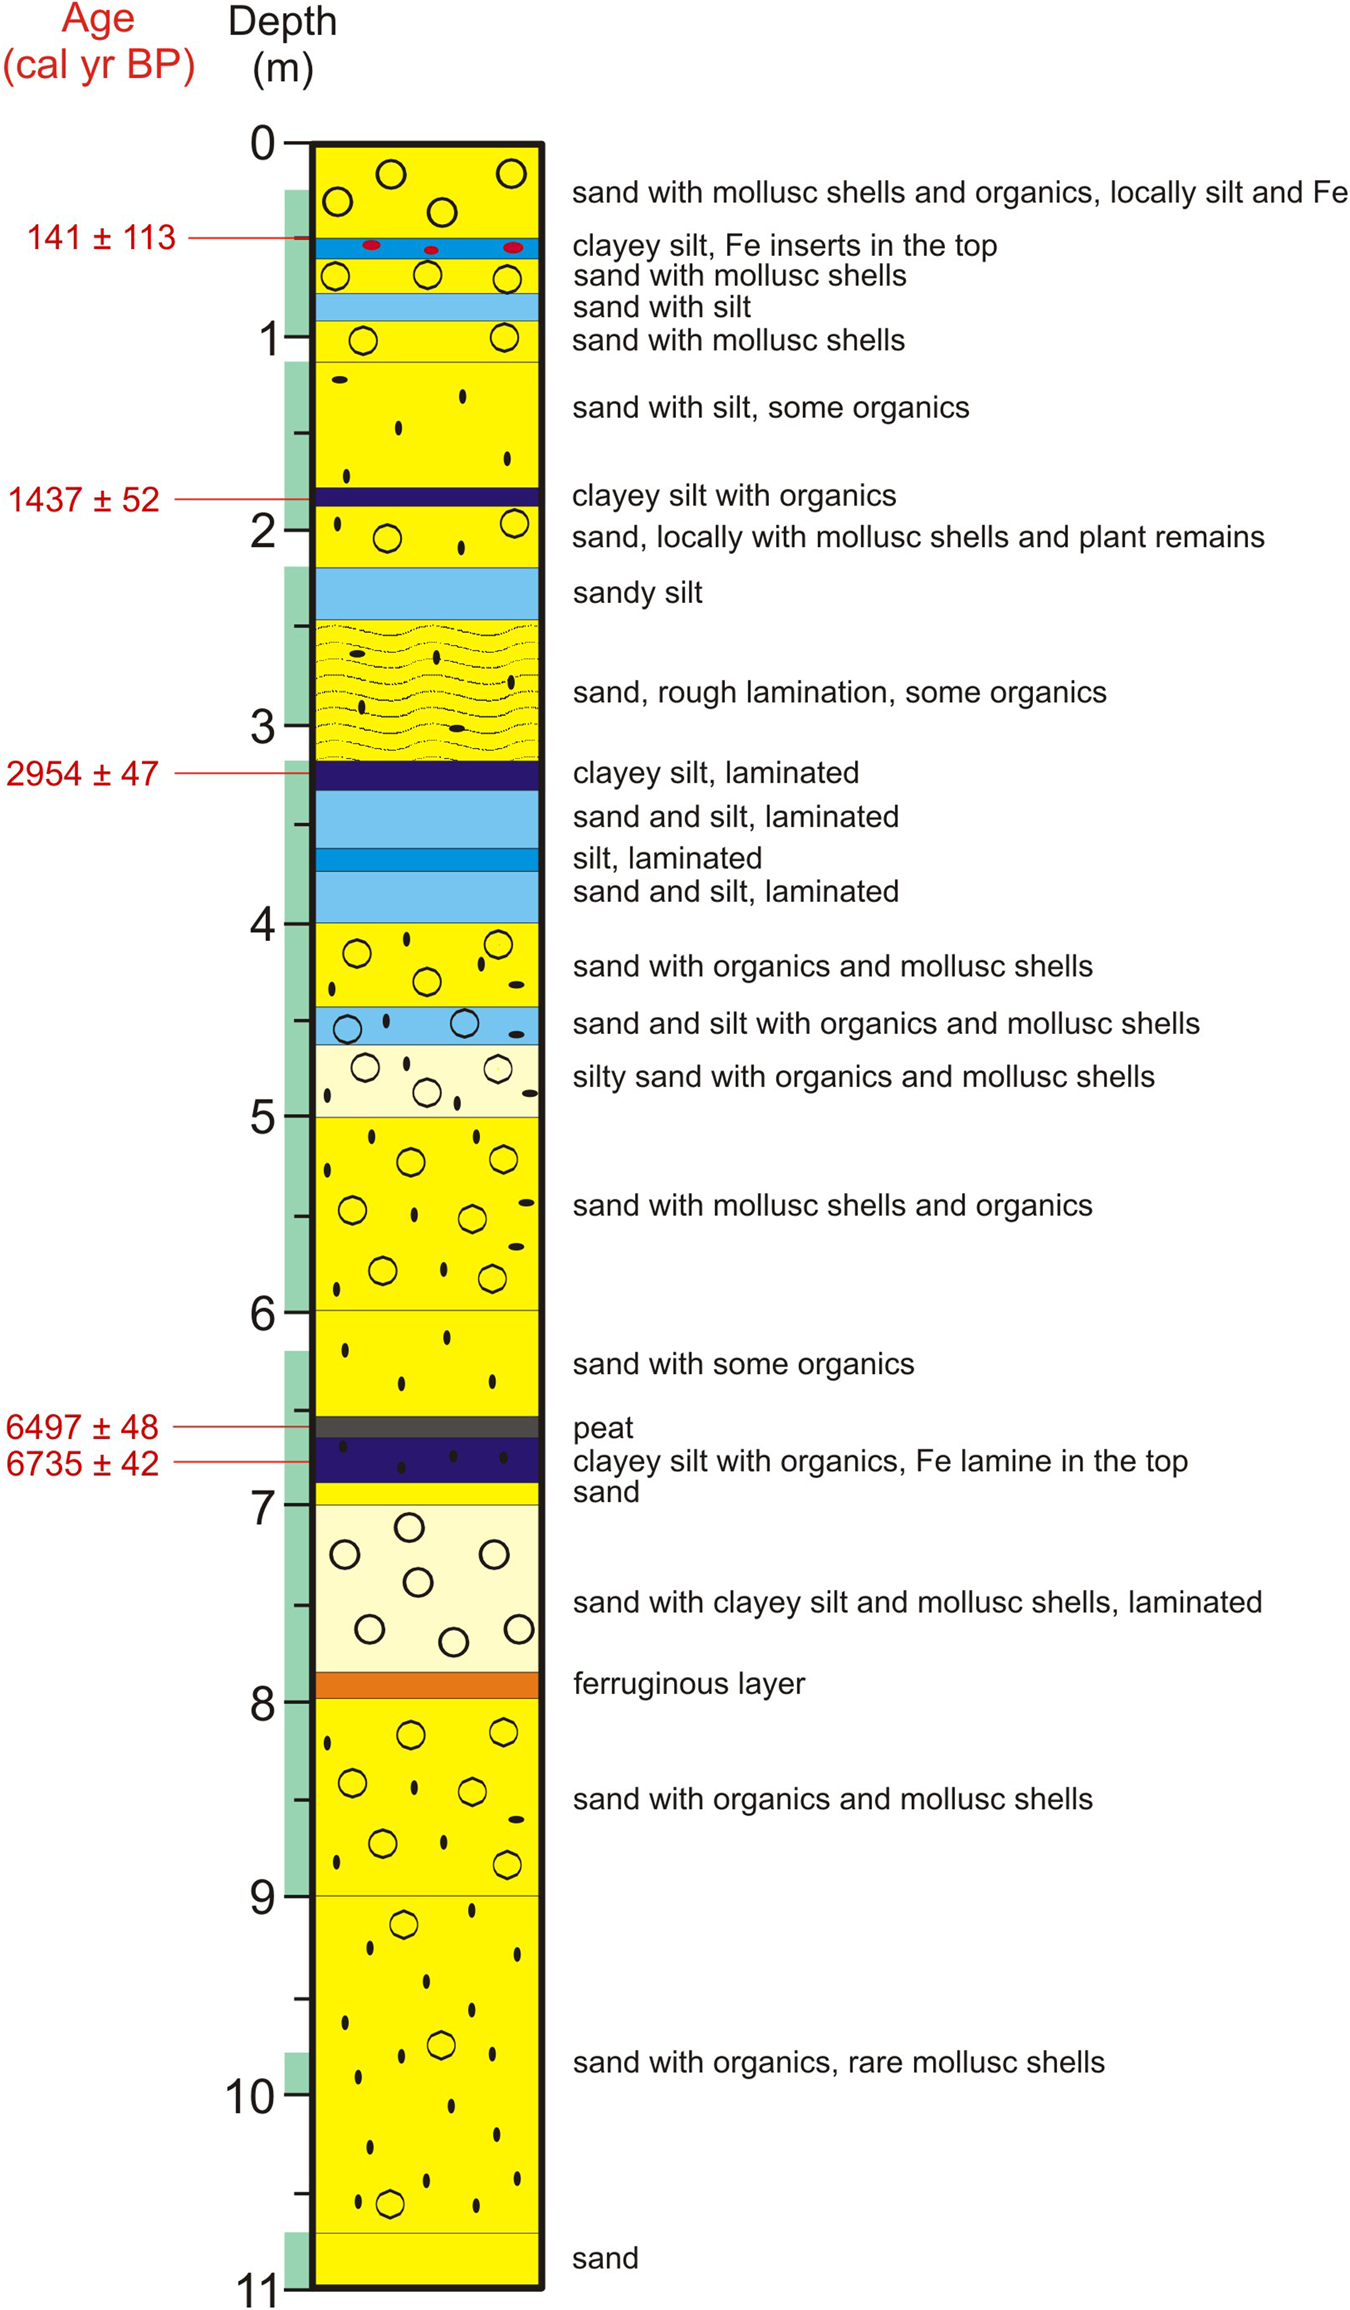
Figure 2. Lithology of the core BO-1 with calibrated radiocarbon ages, green bars at the left side of the log indicate where a full core was collected. (For interpretation of the references to color in this figure legend, the reader is referred to the web version of this article.)
Magnetic susceptibility (MS)
Magnetic minerals in lake sediments are derived from the catchment by erosion, which is especially active in an arid climate with sparse vegetation cover (cf., Jiang et al., Reference Jiang, Salem, Lai, Zhang, Marks, Welc, Xu, Chen, Chen and Sun2016). MS indicates sediment magnetization in response to the applied magnetic field and commonly reflects climate change in the catchment (Bloemdal and deMenocal, Reference Bloemdal and deMenocal1989). MS depends mostly on the lithology and grain size of deposits (Guo et al., Reference Guo, Zhu, Roberts and Florindo2001; Sandgren and Snowball, Reference Sandgren, Snowball, Last and Smol2001), but also on the size of ferromagnetic particles (Verosub and Roberts, Reference Verosub and Roberts1995). Content of ferromagnetic minerals in core BO-1 was estimated using the SM-30 magnetic susceptibility meter (ZH Instruments). Due to very high sensitivity (1 × 10⁻⁷ SI units), this device was provided with 8 kHz LC oscillator and its pick-up coil sensor was large enough to measure a sufficiently high volume of sediments, even with very low magnetic susceptibility. Three measurements were done for every sample to achieve an arithmetical mean.
Morphoscopy of sand quartz grains
Quartz grains of sand are common in most environments and are resistant to chemical and physical weathering. Their morphology reflects past sedimentary and post-sedimentary environments (Krinsley and Doornkamp, Reference Krinsley and Doornkamp1973; Mycielska-Dowgiałło and Woronko, Reference Mycielska-Dowgiałło and Woronko1998; Mahaney, Reference Mahaney2002; Vos et al., Reference Vos, Vandenberghe and Elsen2014). Morphoscopic analysis of quartz grains 0.25–0.5 mm in diameter and of their roundness was completed for 45 samples from 10.25–0.3 m depth. Powdered specimens with 100 quartz grains per sample were analyzed in a scanning electron microscope. Their roundness was classified in the 4-degree scale of Reichelt (Reference Reichelt1961) that classifies angular, subangular, subrounded, and rounded grains, and additionally, broken grains. The degree of roundness of sand grains depends on transport conditions, as well as the distance and derivation of sediments (e.g., Zhao et al., Reference Zhao, Liu, Salem, Marks, Welc, Sun, Jiang, Chen and Chen2017). Most quartz dune-sand grains in hot deserts are usually not well rounded or are even subangular (Folk, Reference Folk1978; Goudie and Watson, Reference Goudie and Watson1981; Goudie et al., Reference Goudie, Warren, Jones and Cooke1987; Woronko et al., Reference Woronko, Dłużewski and Woronko2017). A microtexture analysis of quartz grain surfaces used classifications of Krinsley and Doornkamp (Reference Krinsley and Doornkamp1973) and Mahaney (Reference Mahaney2002). Estimation of roundness of sand grains, in addition to microtexture analysis, provides information on intensity of physical and chemical weathering, character of transport conditions (e.g., aeolian or fluvial environment), and successive sedimentary cycles (e.g., Krinsley and Doornkamp, Reference Krinsley and Doornkamp1973; Mahaney, Reference Mahaney2002; Vos et al., Reference Vos, Vandenberghe and Elsen2014).
Geochemistry
Geochemical analysis was done using a scanning electron microscope (HITACHI TM3000) combined with energy dispersive spectroscopy (EDS) (SWIFT ED Oxford Instruments). EDS enables analysis of elemental concentration and chemical characterization of each sample. The analysis was completed with a magnification of 15–30,000×, acceleration voltage 5–15 kV, image detector BSE, and sample size of 70 mm (0) × 50 mm (H). Fifty-four samples were analyzed. Dried bulk samples were put on a carbon band. Both point and grain surface analyses were done to derive contents of major elements (Ca, Na, Mg, K, Al, and Ti), and they were used to calculate the main indices (Table 1).
Table 1. Geochemical indices.

CIA (chemical index of alteration) is a measure of feldspar conversion to clays (Nesbitt and Young, Reference Nesbitt and Young1989; Fedo et al., Reference Fedo, Nesbitt and Young1995). Al2O3 is an immobile compound, whereas CaO and Na2O are mobile. In contrast, K is not included in CIW (chemical index of weathering), because it may be leached and/or accumulated in residual weathering products. Fedo et al. (Reference Fedo, Nesbitt and Young1995) pointed out that Al is used in CIW without any correction for its inclusion in K-feldspar, and therefore K-feldspar-rich rocks yield very high index values.
The geochemical indices depend on varied lithology: high values are usually combined with fines and low values with sand. High values of CIA and CIW suggest incipient weathering and low values of CIA, CIW, and K/Na indicate insignificant chemical alteration, reflecting consequently cold and/or arid conditions (Nesbitt and Young, Reference Nesbitt and Young1982, Reference Nesbitt and Young1989).
Occurrence of Ti in the Nile delta sediments suggests an increased discharge of the Blue Nile and the Atbara (Sun et al., Reference Sun, Liu, Salem, Marks, Welc, Ma, Zhang, Chen, Jiang and Chen2019) that contributed abundant volcanic products from the Ethiopian Highland, which was rich in Ti and magnetic minerals.
Faunal analysis
This analysis enabled a reconstruction of freshwater, brackish, and saltwater environments, indicating varied interaction between the Nile discharge and marine inflows. For mollusc, ostracod, and foraminifera analyses, 25 samples were examined from 7.9–0.25 m depth. Malacological samples, 50 cm3 each, were washed using 0.5-mm sieve (Ložek, Reference Ložek and Berglund1986). All shells and their identifiable fragments were picked from the dried residue, inspected using a binocular microscope (magnification up to 64×), and counted. Number of valves was given for bivalves (some damaged specimens could be identified to a genus level only). Ecological preferences of mollusc species were based on Taraschewski and Paperna (Reference Taraschewski and Paperna1981), Brown (Reference Brown1994), Götting (Reference Götting2008), and Welter-Schultes (Reference Welter-Schultes2012). Ostracod and foraminiferal samples had a volume of 10 cm3 each. The sediment was treated with hydrogen peroxide (H2O2) to remove organic matter and washed through the 0.1-mm mesh sieve. The species were inspected with a binocular microscope. Several ostracods include a number of valves occurring in the sediments studied.
Age-depth model
Five bulk samples for radiocarbon dating were obtained from the lagoonal dark-olive, organic-rich deposits and peat (Table 2). AMS dating was done at the Poznań Radiocarbon Laboratory in Poland, where 14C measurements were performed on graphite targets (Goslar et al., Reference Goslar, Czernik and Goslar2004). The correct age-depth model of lake sediments required an assessment of agents that could disturb a constant deposition rate, including erosional surfaces, compaction, bioturbation, and influx of sediment from the sea and by the Nile. A Bayesian age-depth routine mode was used (Fig. 3), which took into account the accumulation rate and its variability (Blaauw and Christen, Reference Blaauw and Christen2011; Blaauw et al., Reference Blaauw, Van Geel, Kristen, Plessen, Lyaruu, Engstrom, Van der Plicht and Verschuren2011). The model was based on default settings, except for section thickness, which was set at 0.05 cm given the length of this core. All the ages were calibrated using the IntCal13 curve (Reimer et al., Reference Reimer, Bard, Bayliss, Beck, Blackwell, Bronk Ramsey and Buck2013) at 95.4% confidence intervals (2σ) in calendar years before 1950, expressed as cal yr BP. Cited radiocarbon data were also calibrated and used in interpretation and correlation. The lagoonal provenance of the collected samples made it redundant to consider the marine reservoir effect.

Figure 3. Age-depth model of the log BO-1 created using the Bacon software (Blaauw and Christen, Reference Blaauw and Christen2011). Upper left panel: good runs of a stationary distribution. Upper middle panel: green curve and gray histogram show distributions for the sediment accumulation rate. Upper right panel: memory. Main bottom panel: calibrated 14C dates (transparent blue) and the age-depth model (darker gray areas) that indicate calendar ages; gray stippled lines show 95% confidence intervals; red curve shows ‘best'’ model based on the weighted mean age for each depth (in cm). (For interpretation of the references to color in this figure legend, the reader is referred to the web version of this article.)
Table 2. List of radiocarbon dates in core BO-1 used for the age-depth model; calibrated ranges based on OXCAL 2016 with 95.4% probability and AMS δ13C used for correcting measurement-induced fractionation.

RESULTS
Based on lithological and geochemical characteristics, eight zones (A–H) are distinguished in core BO-1.
Lithology, MS and chronology
The sedimentary sequence in core BO-1 (Fig. 2) starts with the late Pleistocene sand (11.0–10.7 m depth) deposited in the Nile channels that formed a braided pattern when the coast was located to the north of the present Nile delta (Arbouille and Stanley Reference Arbouille and Stanley1991; Muhs et al., Reference Muhs, Roskin, Tsoar, Skipp, Budahn, Sneh, Porat, Stanley, Katra and Blumberg2013; Pennington et al., Reference Pennington, Sturt, Wilson, Rowland and Brown2017). The Holocene gray-brown, fine-grained sand (10.7–8.0 m depth) has horizontal dark streaks of organic matter and pieces of mollusc shells, with mottles of iron oxides (Fe3+) at 8.0–7.9 m depth. Interbedded fine-grained sand and clayey silt with small pieces of mollusc shells occur at 7.9–7.0 m depth. They are overlain by fine-grained sand (7.0–6.9 m depth) with clayey silt and admixture of organic matter, passing upwards into clayey silt with laminae (1 mm thick) of amorphous organic matter and clay with dispersed organics (6.9–6.58 m depth). Peat at 6.58–6.55 m depth is overlain at 6.55–5.0 m by gray, fine-grained sand with fine pieces of mollusc shells and an increasing upwards admixture of organic matter. Fine-grained sand with silt at 5.0–2.45 m depth contains dispersed organics and pieces of mollusc shells, with dark gray laminae of fine-grained sand and clayey silt at 4.0–3.2 m depth. It is overlain by dark-gray sandy silt (2.45–2.2 m depth) and dark-yellow fine- to medium-grained sand (2.0–1.82 m depth). At 1.82–1.80 m depth, there is dark-gray organic clayey silt, overlain at 1.8–1.17 m depth by fine- to medium-grained sand with silt and a small admixture of organic matter. Fine-grained sand with silt and pieces of mollusc shells occurs at 1.17–0.56 m depth. At 0.56–0.46 m depth there is dark gray clayey silt with distinct lamina of iron oxides (0.53 m depth), overlain at 0.46–0.25 m depth by fine-grained sand with admixture of silt, pieces of mollusc shells, and dispersed organics.
Lithological character and varied sedimentary processes of deposits in core BO-1 are reflected by higher values of MS in silt and clay, and lower values in sand (cf., Guo et al., Reference Guo, Zhu, Roberts and Florindo2001). MS generally increases slightly upwards, with main maxima in the zones B, F, and H, and extreme lows in the zones A, C, D, E, and G, indicating varied erosion and fluvial transport in the Nile catchment (Fig. 4; Table 3).

Figure 4. (color online) Magnetic susceptibility, roundness (i.e., morphoscopy of quartz grains), and lithological zones A–H in core BO-1. See Figure 2 for detailed lithologic description.
Table 3. Description of lithological and geochemical zones A–H in core BO-1 based on variability of MS, grain roundness and microtexture, geochemical indices, and Ti content (cf., Figs. 4–6).

Microtexture and roundness of sand grains and geochemical characteristics
Grain roundness and microtexture varied considerably in core BO-1 (Figs. 4, 5; Table 3). In the lower part of the core, grain surface was mostly affected by chemical weathering because it is smooth with solution pits and crevasses, but there are also grains with more diversified, dissolution surfaces (Fig. 5A–E, L). Mechanical abrasion was responsible for large and fresh conchoidal fractures (>10 μm) with arc-shape steps, sharp edges, and corners of another group of grains (Fig. 5F, K). Such microtextures are recorded both on angular and cracked grains. Quartz overgrowth is common and grains of heavy minerals are strongly weathered (Fig. 5G–J).

Figure 5. Microtexture and roundness of quartz grains: (A) subrounded grain with solution crevasses (arrow) and solution pits (arrow) on a smooth surface; (B) subrounded grain with solution pits and dissolution surface in a microdepression (arrow); (C) subrounded grain with a smooth surface and abrasion visible on corners and edges (arrow); (D) well-rounded grain with solution pits and crevasses on a smooth surface; (E) subrounded grain with a smooth surface (white arrow) and precipitation in microdepressions (black arrow); (F) angular grain with sharp edges and conchoidal fractures (arrow); (G) subangular grain with intensively chemically weathered surface; (H) subangular grain with intensive weathered surface and overgrowth quartz (arrow); (I) overgrowth grains (arrows); (J) subangular grain with intensively chemically weathered surface; (K) grains with different weathered surfaces and roundness; (L) subrounded grain with a smooth, probably precipitation-mottled surface.
In the middle and upper part of core BO-1, grain surfaces reflect intensive chemical weathering, with common solution-oriented pits and crevasses (Fig. 5; Table 3). The solution pits on convex surfaces of grains are usually small and shallow, but they are larger and more irregular or transform into dissolution surfaces in microdepressions (Fig. 5A–C). Effects of abrasion, which are noted on the most convex fragments of some grains, are indicated by a rougher surface, presence of V-shaped percussion cracks, and single crescentic gouges, whereas other grains (more towards the top of the sequence) have smooth surfaces with equidimensional or elongated depressions (Fig. 5A–C). Microtextures caused by mechanical abrasion are rare and were noted on more convex grain fragments, represented by small conchoidal fractures <10 μm (Fig. 5F, K) and accompanied by solution pits and crevasses.
Grain roundness and geochemical characteristics of deposits in the borehole log BO-1 are varied (Figs. 4, 6; Table 3). Lack of Ca in several fragments of the section made calculation of some geochemical indices impossible, but in general, they are lithology-dependent (cf., Garzanti et al., Reference Garzanti, Andò, Padoan, Vezzoli and El Kammar2015). Higher values of CIA, CIW, and Na+K+Mg/Ca are connected with fluvial sand, whereas values of K/Ca, K/Na, and Mg/Ca are typical for lagoonal clay and silt (Fig. 6).

Figure 6. (color online) Geochemical indices and zones A–H in core BO-1; content of Ti against a sum of Mg, Al, Fe, K, Ca, Si, S, Ti, Na, and Cl; gray strips indicate good mutual correlation of most indices. CIA = chemical index of alteration; CIW = chemical index of weathering. See Figure 2 for detailed lithologic description.
Faunal characteristics
Faunal remains occur in 18 of 25 analyzed samples. No faunal remains were found at 7.9, 6.85, 6.7, 6.55, 4.8, 3.65, and 1.75 m depth (Fig. 7). The number of taxa varies per sample, from 3–9 and of specimens from 3–2311. Molluscs are represented by nine taxa (four snail and two bivalve species), 1198 specimens, and 103 shell fragments, whereas there are three taxa of ostracods and 3194 valves, with Cyprideis torosa (Jones, 1850) dominating. The species composition is similar in each sample, while the number of individuals varies distinctly for molluscs (1–676) and ostracods (1–1614). In 12 samples, 46 foraminiferal tests assigned to two species were recognized (Fig. 7).

Figure 7. Faunal abundance in the BO-1 core with lithological and geochemical zones added for correlation (Figs. 4, 6, 8). Ecological preferences are in red after the species name: F = freshwater; s = stagnant water; f = flowing water; Sa = saltwater; br = brackish water. Black dots indicate fauna-bearing samples; empty circles indicate samples devoid of faunal remains; “+” marks the occurrence of shell fragments (fr); (d) indicates shell detritus; for bivalves and ostracods a number of valves is given; total occurrences of molluscs, ostracods, and foraminifers in green; blue arrows indicate periods with a lower water level based on preferences of the taxa. See Figure 2 for detailed lithologic description. (For interpretation of the references to color in this figure legend, the reader is referred to the web version of this article.)
Except for the freshwater snail Melanoides tuberculata (Müller, 1774), sometimes recognized as a brackish species (e.g., Sattmann and Kinzelbah, Reference Sattmann and Kinzelbah1988), all identified species are typical of salty water (Fig. 7). Content of bivalves Abra ovata (Philippi, 1836) and Cerastoderma glaucum (Bruguière, 1789), which prefer brackish water, is constant, whereas the snail assemblage is bipartite. Number of individuals abruptly increases at 0.5–0.25 m depth in relation to the lower part of the section, mainly due to increase of Ecrobia ventrosa (Montagu, 1803), with 565 individuals at 0.5–0.45 m. Ecrobia ventrosa is typical of shallow, calm, near-shore zone habitats (common in estuaries and coastal marshes) and salinities of 6–25‰ (Götting, Reference Götting2008; Welter-Schultes, Reference Welter-Schultes2012), accompanied by abundant M. tuberculata and Pirenella conica (Blainville, 1829), which are typical in estuaries, lagoons, and along the sea coast (Plaziat, Reference Plaziat1993).
The ostracod assemblage is mostly monospecific with Cyprideis torosa, accompanied by single valves of Candona sp. and Leptocythere pellucida (Baird, 1950), at 7.5 and 3.25 m depth, respectively. Such populations were noted in saline lakes in Egypt with high content of Na+ and Cl- (e.g., Keatings et al., Reference Keatings, Holmes, Flower, Horne, Whittaker and Abu-Zied2010). Cyprideis torosa, which prefers calm, near-shore zones of brackish-water bodies (Neale, Reference Neale, De Deckker, Colin and Peypouquet1988; Keatings et al., Reference Keatings, Holmes, Flower, Horne, Whittaker and Abu-Zied2010), is abundant in the upper part of the core, and is significantly more common at 0.5–0.45 m depth (Fig. 7; Table 3). A considerable percentage of complete carapaces (usually 40–70%) is worth noting, and they account for 16% of closed carapaces at 0.6–0.53 m depth. Cyprideis torosa has smooth forms without nodes in the examined core, which are usually typical in less salty water (<14‰) (Neale, Reference Neale, De Deckker, Colin and Peypouquet1988; Keyser and Aladin, Reference Keyser and Aladin2004).
The assemblage is completed with two foraminiferal species: Ammonia (Hofker, 1951) and Quinqueloculina seminulum (Linnaeus, 1758), typical of higher salinity (>20‰).
DISCUSSION
At the termination of the late Pleistocene, the area of the modern Nile delta was occupied by sandy and sparsely vegetated plains with braided or anastomosing and seasonally dry river channels (Arbouille and Stanley, Reference Arbouille and Stanley1991; Stanley and Warne, Reference Stanley and Warne1998). Holocene sea-level rise resulted in aggradation of the Nile, with dominant fine-grained silt and clay sedimentation (Muhs et al., Reference Muhs, Roskin, Tsoar, Skipp, Budahn, Sneh, Porat, Stanley, Katra and Blumberg2013; Pennington et al., Reference Pennington, Sturt, Wilson, Rowland and Brown2017). Location of core BO-1 on a spit, its detailed examination, and correlation with logs 1 and 2 of Sestini (Reference Sestini1989) and logs S43 and S47 of Stanley et al. (Reference Stanley, McRea and Waldron1996) enabled us to detect the interaction of the Sebennitic branch, the Burullus Lagoon, and the sea. Four phases (1–4) of Burullus Lagoon development in the Holocene were distinguished (Fig. 8), based on lithology of sediments, roundness of sand grains, geochemical indices, and fossil fauna (Figs. 4–7). In turn, this enabled us to specify environmental transformation of this area in the Holocene (Fig. 8). The phases correspond to the eight lithological and geochemical zones (A–H) in BO-1 (Figs. 4, 6, 7). The zones reflect not only activity of the Nile branch, provenance of deposits, rate of sea-level rise and subsidence of the land surface, but partly also an increasing human effect in the Nile delta since Pharaonic times as a result of a growing population, intensive farming, and restricted river discharge after construction of the Nile delta and Aswan dams (Blodget et al., Reference Blodget, Taylor and Roark1991; Dumont and El-Shabrawy, Reference Dumont and El-Shabrawy2007; Stanley et al., Reference Stanley, Jorstad, Bernasconi, Stanford and Jodry2008).
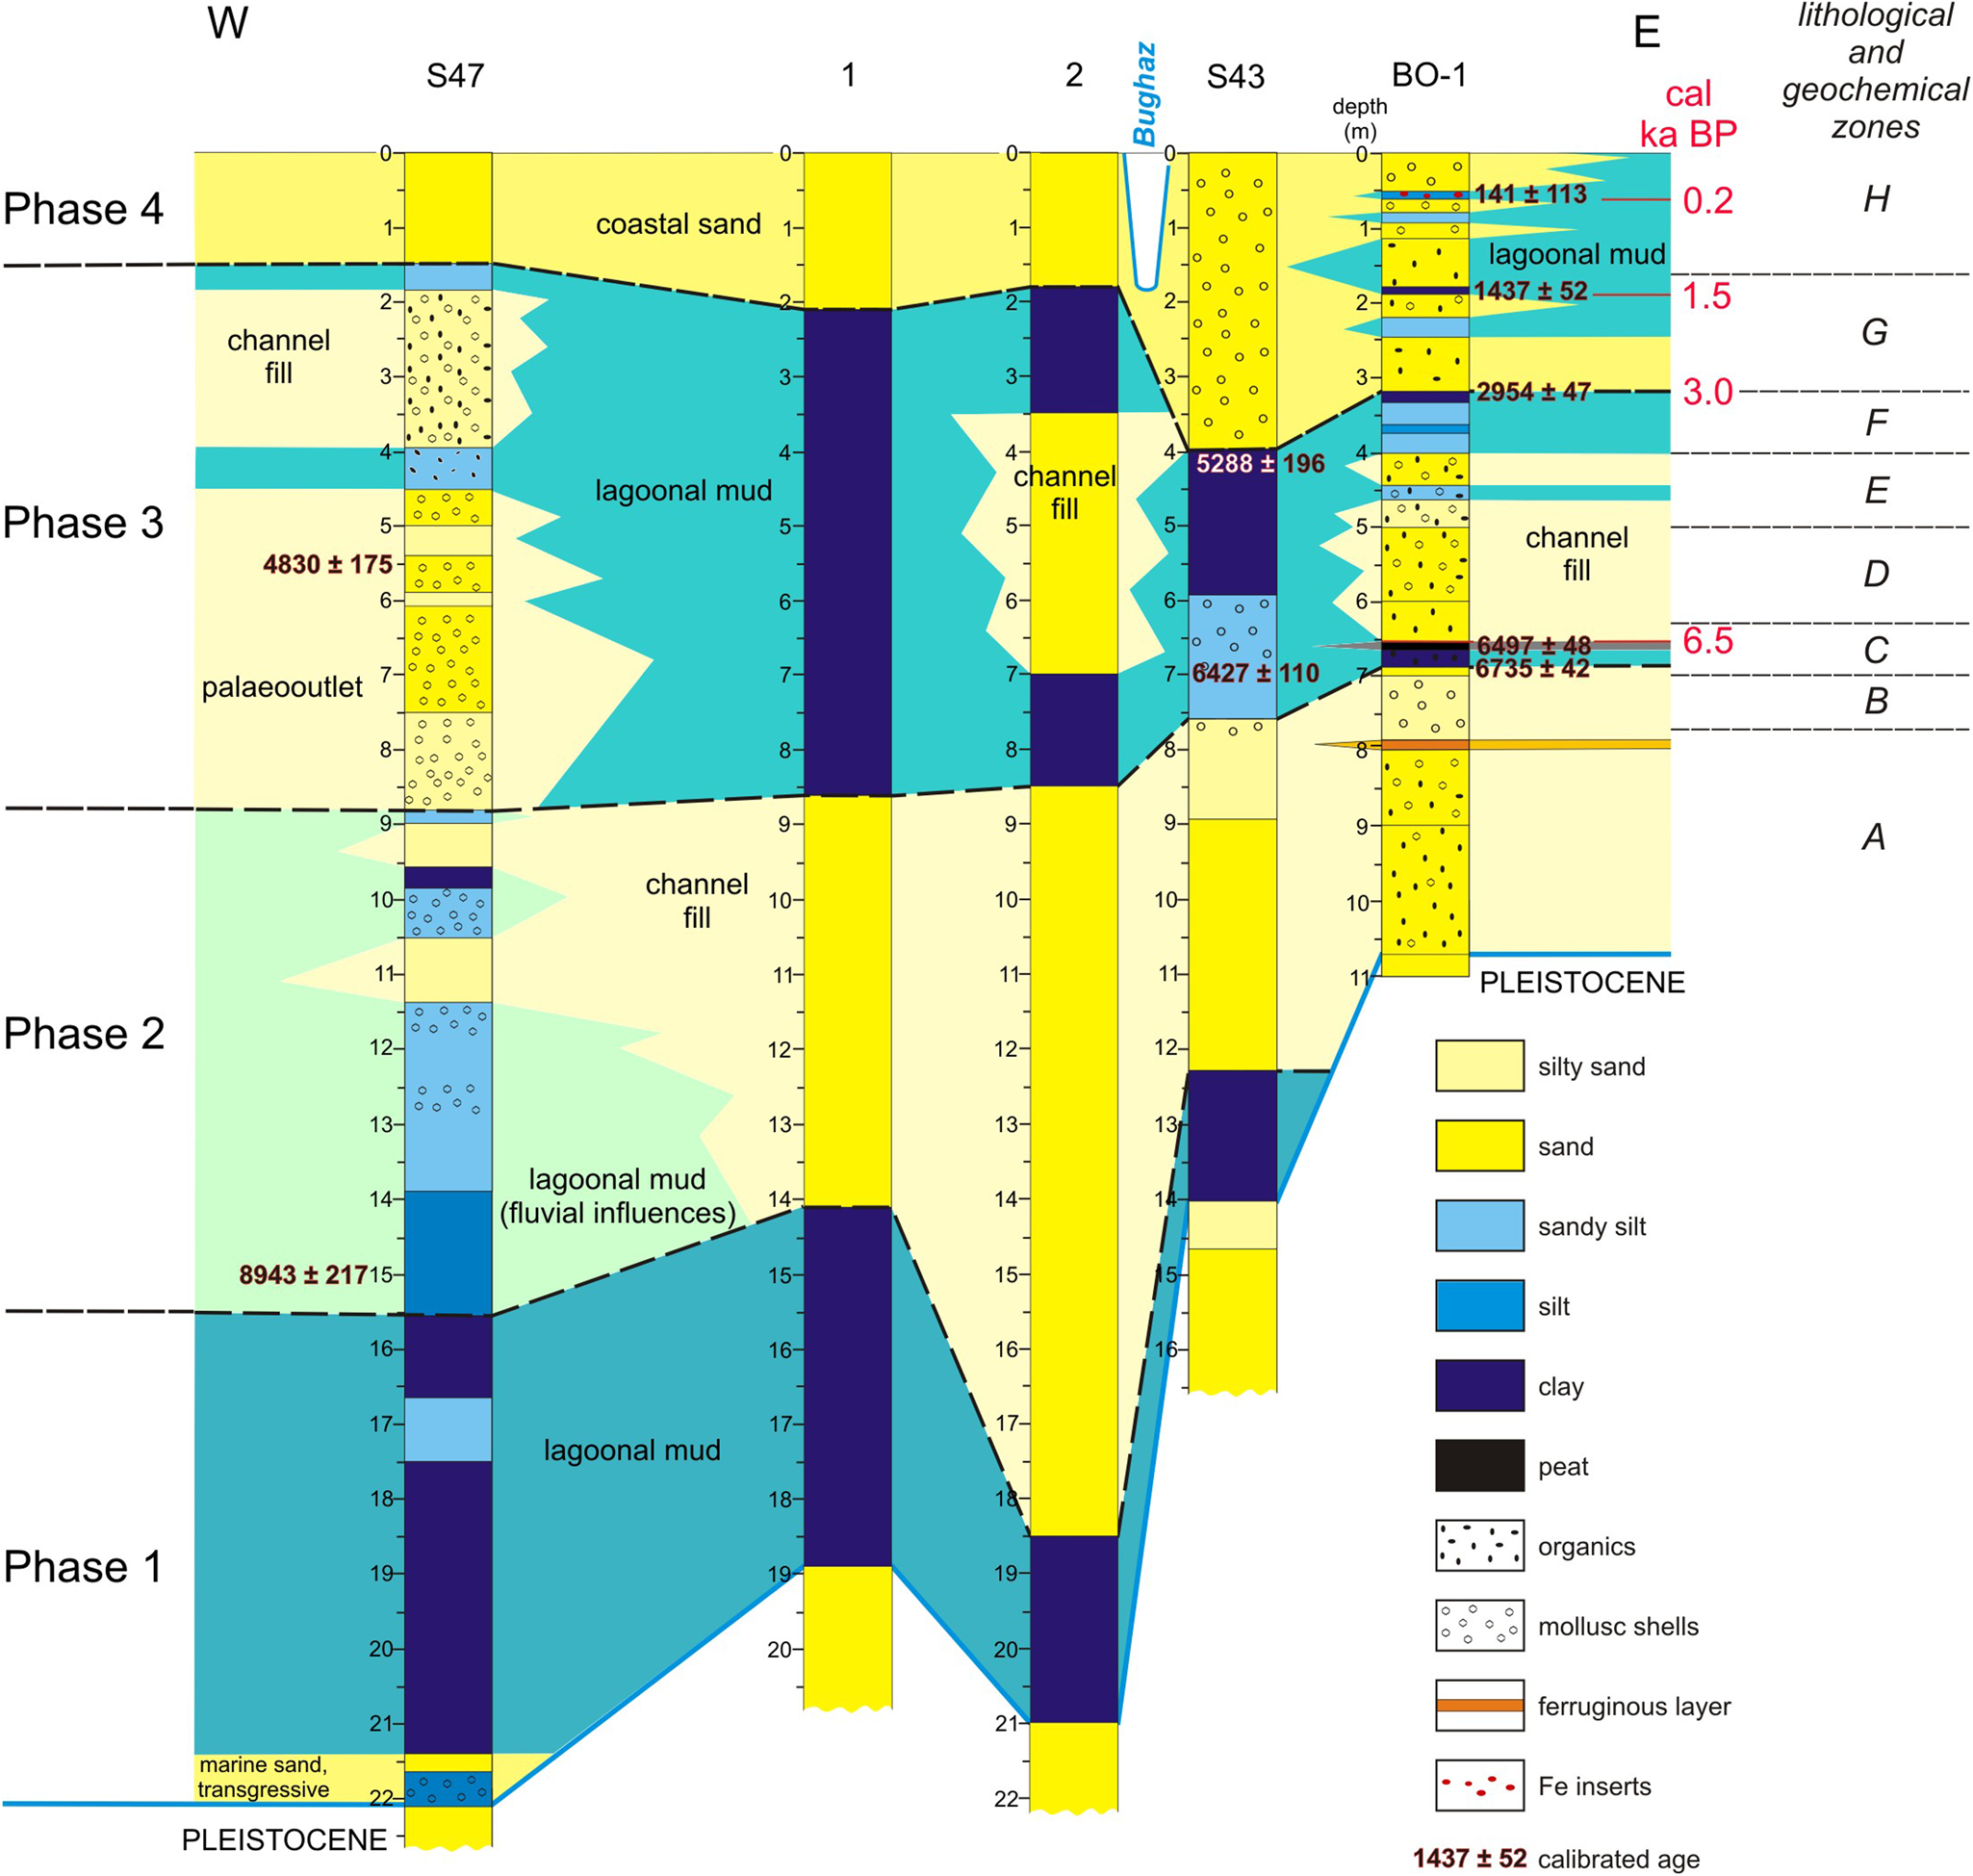
Figure 8. (color online) Development of the north-central part of the Nile delta in the Holocene, based on the logs BO-1, S43, S47, 1, and 2.
Changing hydroclimatic conditions in the Holocene and sediment supply with ferromagnetic minerals from the Nile catchment are reflected in core BO-1 by a general increase of MS since ca. 7.0 cal ka BP (Fig. 4). High sediment magnetism in the Nile delta suggests an increased discharge of the Blue Nile and the Atbara, contributed by material from weathered basalts of the Ethiopian Highland (Garzanti et al., Reference Garzanti, Andò, Padoan, Vezzoli and El Kammar2015). Weaker magnetism in the core can be linked to input of the crystalline basement rocks in the White Nile drainage area (Krom et al., Reference Krom, Stanley, Cliff and Woodward2002). Repeated MS maxima may record abrupt hydrologic changes, connected either with occasional extreme floods or/and activation of the Sebennitic branch. Longer-distance transport in a fluvial environment results in less-abundant angular grains in fluvial deposits (Křížek et al., Reference Křížek, Krbcová, Mida and Hanáček2017), therefore a high content of angular grains (Fig. 5I, L) indicates short-distance transport, presumably by wadis that also supplied redeposited aeolian material during incidental heavy rainfalls and intensive aeolian input from the desert part of the Nile catchment (Pachur and Kröpelin, Reference Pachur and Kröpelin1987; Welc and Marks, Reference Welc and Marks2014), the land surface of which is composed mostly of a cover of unconsolidated deposits (silt and sand).
Land surface stability stimulated weathering and favored soil development, but climate change was the main driving factor for erosion, connected with variable precipitation and intermittent supply of wind-blown material (cf., Fig. 4). According to McLennan (Reference McLennan1993) and Li and Yang (Reference Li and Yang2010), the CIA of suspended material transported by the contemporary Nile is 74.6, which is generally more than in the analyzed core (31.48–62.98), in which there are only two incidental rises of CIA (to 74.1 at ca. 7.15 cal ka BP and to 84.0 at ca. 5.6 cal ka BP; Fig. 6). Moreover, in the African tropical rivers, CIA is very high and reaches 89.9 (Li and Yang, Reference Li and Yang2010), so low indices in the BO-1 core and abundant angular grains suggest limited chemical weathering and dominance of physical weathering in the Nile drainage basin. Values of CIA and CIW indicate varied sources of sediment transported by the Nile. Higher CIA and CIW indicate erosion of soil or weathered mantles in the source areas, whereas lower indices suggest that erosion could reach the less-weathered, deeper deposits. Low values (<40) of CIA and CIW (Fig. 6) may indicate slight chemical weathering, particularly in the Blue Nile headwaters. Low CIA can be connected with cold and/or arid conditions (Fedo et al., Reference Fedo, Nesbitt and Young1995; Kotlia and Joshi, Reference Kotlia and Joshi2013; Malick and Ishiga, Reference Malick and Ishiga2016), if supported by low K/Ca and varied K/Na (Nesbitt and Young, Reference Nesbitt and Young1982).
Ti is the least soluble element in water (Broecker and Peng, Reference Broecker and Peng1982) and is a good measure of detrital input (e.g., Whitlock et al., Reference Whitlock, Dean, Rosenbaum, Stevens, Fritz, Bracht and Power2008). Higher content of Ti indicates intensive chemical weathering in the Ethiopian Highland (Malick and Ishiga, Reference Malick and Ishiga2016) and less Ti suggests dense vegetation cover resulting in limited contribution to the Blue Nile sediments (Hennekam et al., Reference Hennekam, Donders, Zwiep and de Lange2015), combined with a larger discharge of the White Nile, in the drainage area over which the crystalline basement rocks prevail (Krom et al., Reference Krom, Stanley, Cliff and Woodward2002). Sediment input from the desert, mostly wind-blown but also contributed by wadi flux, is enriched in Ca derived from carbonate rock outcrops and depleted in Ti (Schilman et al., Reference Schilman, Bar-Matthews, Almogi-Labin and Luz2001; Woronko, Reference Woronko2012; Garzanti et al., Reference Garzanti, Andò, Padoan, Vezzoli and El Kammar2015; Pennington et al., Reference Pennington, Hamdan, Pears and Sameh2019).
Phases of development of the Burullus Lagoon
Phase 1: marine transgression and start-up of a lagoon (Early Holocene)
A sharp rise of a sea level occurred at the beginning of the Holocene when marine transgression reached the area of the modern Nile delta (Said, Reference Said1981; Arbouille and Stanley, Reference Arbouille and Stanley1991). This episode is documented in log S47 by laminated silt with mollusc shells and cross-laminated sand (cf., Stanley and Warne, Reference Stanley and Warne1993), recognized also in logs S43, 1, and 2 (Fig. 8), and it is followed by development of a lagoon.
Phase 2: fluvial activity with local lagoonal influences (ca. 9.0–6.8 cal ka BP)
Disastrous floods in the Nile delta were common in the early Middle Holocene, making its northern part uninhabitable (Zhao et al., Reference Zhao, Thomas, Salem, Alassald, Liu, Sun, Chen, Ma, Finlayson and Chen2020). A lagoon persisted in the western part of the study area (log S47), but most of the delta was dominated by fluvial activity of the Sebennitic branch (Sestini, Reference Sestini1989; Arbouille and Stanley, Reference Arbouille and Stanley1991). In the top of the deposits of phase 2, lagoonal mud with mollusc shells, together with interbeds of laminated sand, may indicate occasional marine inflows (Figs. 4, 6, 8). The coastline was slightly more inland compared with its modern location (Stanley and Warne, Reference Stanley and Warne1993).
In core BO-1, this phase corresponds to lithological and geochemical zones A and B (Figs. 4, 6. 8; Table 3), dominated by widespread deposition of fluvial sand with organics. Fragmented mollusc shells suggest a dynamic environment, therefore the examined area may have been located close to the outlet of the Sebennitic branch. Angular and broken quartz grains (Fig. 4) indicate abrasion during transport in a fluvial environment (cf., Wright et al., Reference Wright, Smith and Whalley1998), but also may record input via wadis during seasonal rainfall or runoff in a wetter climate (Pachur and Kröpelin, Reference Pachur and Kröpelin1987). Organic matter could be derived either from older fluvial deposits by waves or brought by the Sebennitic. A lack of Ti in the sediments of phase 2 (Fig. 6) indicates that sediment input from the Blue Nile was limited, caused presumably by denser vegetation in the Ethiopian Highland (Hennekam et al., Reference Hennekam, Donders, Zwiep and de Lange2015). Rising values of CIA and CIW indicate a gradual increase of chemical alternation in the catchment, but they are generally low (<50), suggesting little or no input of highly weathered material to the Nile (McLennan, Reference McLennan1993; Krom et al., Reference Krom, Stanley, Cliff and Woodward2002). The ITCZ at that time was at its northernmost position and the summer monsoon was intensive in the Ethiopian Highland (Gasse, Reference Gasse2000; Marriner et al., Reference Marriner, Flaux, Kaniewski, Morhange, Leduc, Moron, Chen, Gasse, Empereur and Stanley2012a). As a result, there was a more important input of Blue Nile sediments compared to the White Nile, the sediment load of which was trapped in Sudanese lakes and marshes (Garzanti et al., Reference Garzanti, Andò, Padoan, Vezzoli and El Kammar2015). According to Derakhshan-Babaei et al. (Reference Derakhshan-Babaei, Nosrati, Tikhomirov, Christl, Sadough and Egli2020), the river sediments consist predominantly of weathered topsoil material, but a combination of altitude and slope in the Ethiopian Highland could have stimulated erosion in the catchment. Most probably, the erosion itself prevented long-lasting soil development because of limited weathering conditions (Johnsson, Reference Johnsson1993; Garzanti et al., Reference Garzanti, Andò, Padoan, Vezzoli and El Kammar2015), which eventually could be reflected in high values of the weathering indices. Moreover, rivers provided more water, making transport of varied fractions of gravel possible and resulting in effective abrasion of the transported grains (Wright et al., Reference Wright, Smith and Whalley1998).
A iron oxide layer in the BO-1 core (Fig. 8) indicates subaerial conditions and aridification at ca. 7.2 cal ka BP. This dry episode is coincident with peaks of CIA, CIW, and K/Na (Fig. 6; Table 3) and is followed by low-energy fluvial and marine activity. The Burullus Lagoon became shallower (Dumont and El-Shabrawy, Reference Dumont and El-Shabrawy2007), with deposition of laminated fine-grained sand and silt, enriched in shell fragments of halophilous molluscs (Fig. 7). High MS and abundant angular grains indicate increased input from the adjacent area (cf., Zhao et al., Reference Zhao, Liu, Salem, Marks, Welc, Sun, Jiang, Chen and Chen2017), possibly by aeolian activity.
Marine fossils in logs S43 and S47 (echinoderms, gastropods, ostracods, and foraminifera) reflect marine influences (Arbouille and Stanley, Reference Arbouille and Stanley1991). Faunal remains in the BO-1 appear at ca. 7.1 cal ka BP and are quite rich, composed of the bivalves Abra ovata and Cerastoderma glaucum, and ostracods Cyprideis torosa and Limnocythere inopinata (Baird, 1843), which indicate a calm and shallow, near-shore brackish lagoon. However, the freshwater snail Melanoides tuberculata suggests interruption by a freshwater ephemeral event at ca. 7.0 cal ka BP (Fig. 7).
Phase 3: lagoon with fluvial influences (6.8–3.0 cal ka BP)
This phase is reflected by the lithological and geochemical zones C–F (Figs. 4, 6, 8; Table 3). The temperature was highly variable during that time in the northern hemisphere (Wanner et al., Reference Wanner, Mercolli, Grosjean and Ritz2015), with higher temperature and lower precipitation in the Mediterranean region (Wanner et al., Reference Wanner, Solomina, Grosjean, Ritz and Jetel2011). The Burullus Lagoon became impoverished in molluscs and ostracods, being gradually filled with sediments brought by the Sebennitic branch when the coastline retreated northwards (cf., Stanley and Warne, Reference Stanley and Warne1993). Occurrence of fluvial deposits in logs 2, S47, and BO-1 (Fig. 8) may indicate occurrence either of several channels of the Sebennitic branch close to its outlet to the sea or of another river branch (cf., Arbouille and Stanley, Reference Arbouille and Stanley1991).
Repeated droughts in the Nile catchment are reflected by varied deposition and paleogeography in the Burullus Lagoon area. The clayey silt with organics and Fe laminae, capped with peat in core BO-1, indicates shallowing of the water body at 6.5 cal ka BP and is clear evidence of transformation of the lagoon into a marshy area. Very low MS at 6.7–6.5 cal ka BP indicates a low water level (Fig. 4), whereas extremely low CIA and CIW (Fig. 6) suggest limited chemical alteration in the Nile headwaters and occurrence of non-weathered material in the Nile deposits (cf., Stanley et al., Reference Stanley, Krom, Cliff and Woodward2003; Woodward et al., Reference Woodward, Macklin, Krom, Williams and Gupta2007), which could be wind-blown or transported from the surrounding desert via wadis fed by incidental rainfall (Welc and Marks, Reference Welc and Marks2014). Together with very low K/Na, these findings reflect arid conditions (cf., Nesbitt and Young, Reference Nesbitt and Young1982, Reference Nesbitt and Young1989).
Instability of the Nile discharge resulted from gradual aridification and environmental changes in the Nile catchment, reflected also in the Nile delta (Flaux et al., Reference Flaux, Morhange, Marriner and Rouchy2011). The lagoon became more open to penetration of sea water from ca. 6.5 cal ka BP, as indicated by interbeds of silt or silty sand with mollusc shells in core BO-1 (Fig. 8). The lagoon persisted during this time (logs S43 and 1 in Fig. 8). Since 6.5 cal ka BP, vegetation cover in the Nile catchment became abruptly scarce (Pennington et al., Reference Pennington, Hamdan, Pears and Sameh2019) and precipitation gradually decreased in response to lower insolation in the northern hemisphere (Hennekam et al., Reference Hennekam, Donders, Zwiep and de Lange2015). Reduced flow in the Nile branches in the delta affected marshland vegetation to the south of the Burullus Lagoon (Bernhardt et al., Reference Bernhardt, Horton and Stanley2012). Higher MS at 6.3 and 5.2 cal ka BP (Fig. 4), and higher CIA and CIW (Fig. 6), may reflect more intensive erosion in the Nile headwaters, which, combined with lower precipitation and drought, could result in supply of aeolian material to the Nile delta (cf., Zhao et al., Reference Zhao, Liu, Salem, Marks, Welc, Sun, Jiang, Chen and Chen2017). High contents of subrounded and rounded quartz grains at 6.0–5.6 cal ka BP (Fig. 4; see also Zaki, Reference Zaki2007) could have resulted from erosion of river banks or destruction of a beach because of low discharge of the Nile, expressed by transport of finer fractions. Moreover, higher CIA and CIW, with maximum at 5.7 cal ka BP (Fig. 6), suggest that the material was derived from the area with intensive chemical weathering, presumably by the White Nile because there was very low discharge in the Blue Nile basin during that time (Marriner et al., Reference Marriner, Flaux, Kaniewski, Morhange, Leduc, Moron, Chen, Gasse, Empereur and Stanley2012a; Kaniewski et al., Reference Kaniewski, Marriner, Cheddadi, Guiot and Van Campo2018).
Faunal content in BO-1 is characteristic of shallow and near-shore brackish water. Dominance of Cyprideis torosa and occurrence of foraminiferal tests indicate a marine environment. An expansion of Ecrobia ventrosa and C. torosa in the upper part suggests a significant drop of the water level (Fig. 7). Low-energy conditions are evinced by a high proportion of complete ostracod carapaces (up to 77%; Boomer et al., Reference Boomer, Horne, Slipper, Park and Smith2003; Keatings et al., Reference Keatings, Holmes, Flower, Horne, Whittaker and Abu-Zied2010) and occurrence of Pirenella conica, which avoids wave-dominated zones (Taraschewski and Paperna, Reference Taraschewski and Paperna1981). Composition of mollusc shells and presence of C. torosa valves, all without the nodes, indicate maximum salinity of 20–25‰ at 6.0–5.5 and 4.8–4.2 cal ka BP, caused presumably either by a more open connection with the sea or by weaker fluvial activity, or both (Fig. 7).
Summing up, lower water level and higher salinity of the Burullus Lagoon at 6.0–5.5 and 4.8–4.2 cal ka BP reflected droughts in the Nile catchment that were related to a southward shift of the summer ITCZ and resulted in extremely low discharges of the Blue Nile (Williams, Reference Williams2010; Marshall et al., Reference Marshall, Lamb, Huws, Davies, Bates, Bloemendal, Boyle, Leng, Umer and Bryant2011; Marriner et al., Reference Marriner, Flaux, Kaniewski, Morhange, Leduc, Moron, Chen, Gasse, Empereur and Stanley2012a). Clayey-silty floodplain deposits with brown to black peat and organic mud in this area that were dated at 6.5 ka BP (Andres and Wunderlich, Reference Andres and Wunderlich1986; Wunderlich Reference Wunderlich and Van den Brink1988, Reference Wunderlich1989, Reference Wunderlich, Krzyżaniak, Kobusiewicz and Alexander1993) record occurrence of a brackish marsh-lagoon southward to Buto (Wunderlich, Reference Wunderlich1989, Reference Wunderlich, Krzyżaniak, Kobusiewicz and Alexander1993), which, based on occurrence of the peat layer in the core BO-1 that was dated at 6.5 cal ka BP, indicates marsh extent this far north. Such a hydrologically unstable marsh-lagoon area hardly could have been penetrated by prehistoric human communities and was not permanently occupied. According to Arbouille and Stanley et al. (Reference Arbouille and Stanley1991), a large lagoon occurred just to the north of Buto in the sixth millennium BP and marshlands prevailed to the south of the modern Burullus Lagoon.
The 4.2 ka climatic event is represented by a drought in northeastern Africa (cf., Zhao et al., Reference Zhao, Liu, Salem, Marks, Welc, Sun, Jiang, Chen and Chen2017) and it is reflected in core BO-1 at ~4.0 m depth by indications of reduced fluvial discharge and extension of the lagoon (Fig. 8). This event was generally dry in low latitudes (Bar-Matthews and Ayalon, Reference Bar-Matthews and Ayalon2011; Kaniewski et al., Reference Kaniewski, Marriner, Cheddadi, Guiot and Van Campo2018; Bini et al., Reference Bini, Zanchetta, Persoiu, Cartier, Català, Cacho and Dean2019), with cooling in the western Mediterranean at 4.5–4.0 ka BP (Jalut et al., Reference Jalut, Amat, Bonnet, Gauquelin and Fontugne2000) and the North Atlantic region at 4.3–4.0 ka BP (Blair et al., Reference Blair, Geirsdóttir and Miller2015). A distinct drop of precipitation (30–50%) in the eastern Mediterranean at ca. 4.3 cal ka BP (cf., Bar-Matthews and Ayalon, Reference Bar-Matthews and Ayalon2011) was accompanied by occasional flash floods in northern Africa, which were especially common at 4.1–3.7 ka BP (Kaniewski et al., Reference Kaniewski, Marriner, Cheddadi, Guiot and Van Campo2018). The Blue Nile runoff was extremely low during that time due to reduced precipitation (Blanchet et al., Reference Blanchet, Contoux and Leduc2015), with the main contribution by the White Nile (Stanley et al., Reference Stanley, Krom, Cliff and Woodward2003; Kaniewski et al., Reference Kaniewski, Marriner, Cheddadi, Guiot and Van Campo2018).
Reactivation of the Nile flow after 4.0 cal ka BP in the Burullus Lagoon is reflected by laminated sand, silt, and clayey silt. A rapid rise of MS (Fig. 4) is linked to a higher discharge of the Nile, resulting in transport of more ferromagnetic material and activation of the Sebennitic branch. This event corresponds with a humid phase in the southeastern Mediterranean at 3.5–3.0 ka BP (Schilman et al., Reference Schilman, Bar-Matthews, Almogi-Labin and Luz2001).
Phase 4: stabilization and closing of the lagoon (from 3.0 cal ka BP)
This phase corresponds to the lithological and geochemical zones G and H (Figs. 4, 6, 8; Table 3). Marine influence was stronger in the eastern part of the Burullus Lagoon, closer to the Bughaz inlet (Fig. 8). Interbedded partly laminated sand and silt, with organic matter and mollusc shells in core BO-1 (Fig. 2) indicate a fluctuating contact of marine and lagoonal environments from 2.8 cal ka BP, suggesting substantial wave activity in the lagoon, which is confirmed by microtexture of quartz grains (Figs. 4, 8). There is an extreme low MS at 2.4–2.2 cal ka BP, with rises at 2.1–2.0 and 0.8–0.3 cal ka BP, whereas Ti is rare, but still indicates continuous input of the Blue Nile.
A rapid climate change towards aridification was detected in the southern Mediterranean ca. 2.7 ka BP (Mayewski et al., Reference Mayewski, Rohling, Stager, Karlén, Maasch, Meeker and Meyerson2004; Wanner et al., Reference Wanner, Mercolli, Grosjean and Ritz2015), and in the vicinity of the Maryut Lagoon aeolian deposition started at ca. 2.5 ka BP (Woronko, Reference Woronko2012). In the El-Manzala Lagoon and the Damietta branch in the eastern part of the Nile delta, increased soil erosion and high discharge occurred after 2.68 ka BP (Kholeif, Reference Kholeif2010). A humid phase in the southeastern Mediterranean region occurred at 1.7–1.0 ka BP (Schilman et al., Reference Schilman, Bar-Matthews, Almogi-Labin and Luz2001). This is represented in BO-1 by a maximum of subrounded and rounded quartz grains at ca. 1.8 cal ka BP. A wider connection with the sea possibly occurred when compared to the neighboring Maryut Lagoon (Flaux et al., Reference Flaux, El-Assal, Marriner, Morhange, Rouchy, Soulié-Märsche and Torab2012) and resulted in a lack of desiccation since 1.5 cal ka BP. Towards the top of log BO-1, the grains become more rounded and abrasion features, as such as v-shaped percussion cracks and crescentic gouges, are more common (Fig. 5). Contemporaneous highs of CIA, CIW, and K/Na in silt (Fig. 6) reflect a more humid climate and no input of aeolian material. An abrupt increase in the number of snails, especially of Ecrobia tubercul, Melanoides tuberculate, and Pirenella conica, which are typical for brackish shallow, calm, and near-shore lagoon habitats, is noted in core BO-1 since 0.7 cal ka BP (Fig. 7). The ostracods Cyprideis torosa and Leptocythere pellucida are also abundant, and in northern Egypt they are characteristic of saline lakes with high concentrations of Na and Cl ions in the water (e.g., Keatings et al., Reference Keatings, Holmes, Flower, Horne, Whittaker and Abu-Zied2010). Expansion of species characteristic of calm and shallow waters suggests a lower water level in the lagoon when major distributary channels of the Nile were reduced to the artificially maintained Damietta and Rosetta branches, and the lagoon itself became smaller (Fig. 1C).
Higher MS and subangular grains predominate after ca. 0.8 cal ka BP (Fig. 4) and may indicate drainage changes in the Nile delta, recording either occasional floods or/and activation of the Sebennitic branch, or stronger winds and higher aeolian supply. Low geochemical indices indicate reduced chemical weathering and progressive aridity. Some overflow or, presumably, higher energy conditions since the nineteenth century are indicated by rare (16%) closed carapaces of ostracods, but these processes were terminated in the twentieth century after the Aswan dams were constructed (Dumont and El-Shabrawy, Reference Dumont and El-Shabrawy2007). Two main Nile branches (Damietta and Rosetta channels) were maintained by artificial excavations, whereas wetland drainage projects substantially modified the delta surface, making its area available for permanent occupation (Dumont and El-Shabrawy, Reference Dumont and El-Shabrawy2007).
CONCLUSIONS
The modern Burullus Lagoon in the north-central part of the Nile delta is surrounded by salt marshes, mudflats, and sand plains, and separated by a sand barrier from the sea. Apart from occasional marine intrusions in the Holocene, it was fed by the Sebennitic branch of the Nile. Transformations of the landscape and accretion of deposits were dependent on sea level fluctuations, subsidence, climate-related vegetation changes, and human effects, especially since Pharaonic times.
Based on environmental changes in this area in the Holocene, four phases of the Burullus Lagoon development were distinguished, among which, three were detected in core BO-1. They reflect not only the processes occurring in the Nile delta but also climate and environmental transformations in the Nile catchment, and especially varying discharges of the Blue Nile and the White Nile.
A sharp rise of a sea level occurred at the beginning of the Holocene when marine transgression reached the area of the modern Nile delta. During phase 1 (end of the Early Holocene), the area of the modern Nile delta was occupied by an alluvial plain dissected by braided channels and a limited lagoon appeared close to the sea. In phase 2, varied hydroclimatic conditions in the Nile delta and the sediment supply to the Burullus Lagoon after 7.0 cal ka BP were influenced mostly by discharges of the Blue Nile and the Atbara. A lagoon persisted in the western part of the study area, but most of the delta was dominated by fluvial activity of the Sebennitic branch, although with occasional marine inflows at the termination of this phase.
After a dry episode around 7.2 cal ka BP, subsequent droughts in the Nile catchment were reflected by shallowing and higher salinity of the Burullus Lagoon at 6.5, 6.0–5.5, and 4.8–4.2 cal ka BP (phase 3). They were connected with a southward shift of the summer ITCZ in Africa, recorded by extremely low discharges of the Blue Nile. The lagoon was gradually transformed into a marshy area, but more open to sea water intrusion. Since 4.0 cal ka BP, the Sebennitic branch has been reactivated in the Burullus Lagoon area.
During phase 4 occasional marine inflows occurred in the Burullus Lagoon after 2.8 cal ka BP. Construction of the Nile delta dams in the nineteenth century and of the Aswan dams in the twentieth century smoothed the Nile discharge and decreased the sedimentation rate in the delta, and the Burullus Lagoon became smaller and shallower.
Supplementary Material
The supplementary material for this article can be found at https://doi.org/10.1017/qua.2021.63.
Acknowledgments
We are deeply thankful to Brian Finlayson (University of Melbourne), Ben Pennington (University of Southampton), the anonymous reviewer, Associate Editor Pete Langdon, and Senior Editor Nicholas Lancaster for their critical comments that were crucial for improvement of the primary version of the manuscript.
Financial Support
Drilling and examination of the core BO-1 was funded by the project of the National Science Centre in Poland (decision no. DEC-2012/05/B/ST10/00558).


