


Introduction
Eating disorders (ED), including anorexia nervosa (AN), bulimia nervosa (BN), and binge eating disorders (BED), are a complicated mental illness characterized by disturbances in eating behaviors and in the experience of weight and shape. ED have increasingly become a global topic of concern for public health. ED affect up to 3% of the population, and their prevalence varies according to subtypes and populations (Galmiche, Déchelotte, Lambert, & Tavolacci, Reference Galmiche, Déchelotte, Lambert and Tavolacci2019). Approximately 80% of patients with ED suffered from long-lasting effects of decreased mental and physical health comorbidities (Bühren et al., Reference Bühren, Schwarte, Fluck, Timmesfeld, Krei, Egberts and Herpertz-Dahlmann2014; O'Brien, Whelan, Sandler, & Weinberg, Reference O'Brien, Whelan, Sandler and Weinberg2017). AN has the highest mortality rate among all mental disorders (Bodell, Cheng, & Wildes, Reference Bodell, Cheng and Wildes2019).
Historically, ED have been conceptualized as a culture-bound health issue restricted to Western culture (Kolar, Rodriguez, Chams, & Hoek, Reference Kolar, Rodriguez, Chams and Hoek2016; Prince, Reference Prince1985). However, a growing body of evidence has explored the increasing trend of ED incidence in Asian countries, especially in rapidly developing China. The prevalence of ED among female university students in China was similar to that among their Western counterparts (Tong et al., Reference Tong, Miao, Wang, Yang, Lai, Zhang and Hsu2014). A basic requirement for advances in the diagnosis and treatment of ED, as well as the rational allocation of health care resources, is the improved understanding of its epidemiology. Hence, ED incidence and its possible changes have implications for mental health services throughout the country.
At present, knowledge of ED risk factors is still lacking. The knowledge of long-term disease trends can provide clues to elucidate the role of risk factors in the etiology of the disease. ED incidence and long-term trends at the national level are difficult to obtain because most epidemiological surveys of mental disorders in China have not included ED. Instead, the Global Burden of Disease Study (GBD) 2017 provides a standardized methodology to estimate the disease burden of ED by age, sex, year, and location, thereby providing abundant information through which to elucidate the temporal trends of the ED epidemic in China (Zhou et al., Reference Zhou, Wang, Zeng, Yin, Zhu, Chen and Liang2019). Moreover, incidence estimates are crucial to understanding the current status of the ED epidemic and to evaluating whether the epidemic's trend is improving. Age–period–cohort analysis has been a popular method of assessing the contributions of chronological age, time period, and birth cohort effects on the outcome, such as disease incidence. Age effects represent a different risk of the outcome associated with different age brackets. Period effects reflect the influence of a complex set of historical events and environmental factors. Birth cohort effects reflect the characteristics of each generation and include risk factors and exposure to environmental factors present in early life (Lee, Huang, Huang, Chen, & Lee, Reference Lee, Huang, Huang, Chen and Lee2009). The results from the age–period–cohort analysis may provide epidemiologists with important clues or hypotheses for testing the etiology of disease (Mistry, Parkin, Ahmad, & Sasieni, Reference Mistry, Parkin, Ahmad and Sasieni2011). As the first step to better elucidating ED status in China, this study aimed to examine the temporal trends of ED incidence in China using data from the GBD 2017 and to explore the net age, period, and cohort effects under the age–period–cohort framework.
Materials and methods
Data source
All analyses were conducted using the China data from the GBD 2017, which was provided by the Institute for Health Metrics and Evaluation. The GBD 2017 used an updated and extensive body of literature studies, survey data, surveillance data, inpatient admission records, outpatient visit records, health insurance claims, and additional results from cause of death models to estimate disease burden (e.g. incidence, prevalence, mortality, and disability-adjusted life years) for 354 causes in 195 countries and territories from 1990 to 2017. Details on the data, approaches to enhancing data quality and comparability, and statistical modeling and metrics for the GBD 2017 have been reported previously (GBD 2017 Disease and Injury Incidence and Prevalence Collaborators, 2018; GBD 2017 Mortality Collaborators, 2018; GBD 2017 Causes of Death Collaborators, 2018).
For ED, the primary source of data inputs was peer-reviewed literature on the incidence, prevalence, remission, and excess mortality via electronic databases, such as PubMed, Embase, and PsycINFO, without any language limitation. Due to a certain lag in the publication of literature (e.g. research results in 2017 may not be published until 2018), the literature search of the GBD 2017 was updated to 11 February 2018, for a comprehensive retrieval of relevant data. The reviews incorporated searches of peer-reviewed literature via electronic databases. The included studies had to have been published during or after 1980, provide sufficient details on the study methodology and sample characteristics to enable the determination of study quality, and be representative of the general population. The detailed descriptions of this methodology have been published elsewhere (Whiteford et al., Reference Whiteford, Degenhardt, Rehm, Baxter, Ferrari, Erskine and Vos2013). To broaden the data source of ED in China, a further systematic review based on the China National Knowledge Infrastructure (CNKI) database was conducted to find studies that would not typically be captured in PubMed, Embase, and PsycINFO. The GBD 2017 also included investigations of grey literature and consultation with experts as the data sources for ED. The incidence of ED was estimated through the function in DisMod-MR 2.1 based on the cause-specific mortality rates database from the cause of death ensemble modeling and cause of death correct analyses. According to the data sources of ED described by the GBD 2017, we conducted a further comprehensive electronic search through the PubMed, Embase, PsycINFO, and CNKI to validate the publications reporting the incidence, prevalence, mortality, and remission of ED from 1 January 1980 to 11 February 2018. In order to reach a broad range of search, the search terms included (‘eating disorders’ or ‘disordered eating’ or ‘anorexia nervosa’ or ‘bulimia nervosa’) and (‘China’). The main findings of the literature search are highlighted in online Supplementary Table S1.
In the GBD 2017, ED were defined according to the Diagnostic and Statistical Manual of Mental Disorder (DSM) and International Classification of Disease (ICD) criteria. Different versions of the DSM (DSM-III, DSM-III-R, DSM-IV, DSM-IV-TR, and DSM-5) and ICD (ICD-9 and ICD-10) were accepted. The latest DSM-5 criteria, released in 2013, have specified three ED subtypes, AN, BN, and BED, and defined a residual category, Other Specified Feeding and Eating Disorders (OSFEDs), that included clinically significant ED not meeting full criteria for AN, BN, or BED. However, the GBD 2017 did not follow the latest DSM-5 classifications, and included only two ED subtypes, AN and BN. According to the previous DSM criteria rather than DSM-5, eating disorder not otherwise specified (EDNOS) accounted for around 80% of all ED diagnoses, whereas AN and BN only contributed to 20% of all ED cases. The GBD 2010 even put BN, BED, and EDNOS into a big category (Whiteford et al., Reference Whiteford, Degenhardt, Rehm, Baxter, Ferrari, Erskine and Vos2013). We extracted the age-standardized incidence rates by sex and year to quantify the temporal trends of ED incidence. The age-standardized incidence rates and the 95% uncertainty intervals (UIs) were calculated based on the GBD 2017 global age-standard population (GBD 2017 Disease and Injury Incidence and Prevalence Collaborators, 2018). Moreover, crude rates and the 95% UIs were used to compare ED's secular trend between age groups.
Joinpoint regression analysis
The identification of changes in the secular trend is critical to the analysis of disease incidence data. Joinpoint regression analysis (Joinpoint Regression Program, version 4.7.0.0, NCI) was used to describe the continuous changes in the slopes of overall incidence trends through permutation analysis. The logarithmic transformation of the rates was conducted and the standard errors were calculated based on binomial approximation (Kim, Fay, Feuer, & Midthune, Reference Kim, Fay, Feuer and Midthune2000). The estimated annual percent change (APC) and 95% confidence interval (CI) were calculated for each incidence trend by fitting a regression line to the natural logarithm of the observed rates using the calendar year as a regression variable (Clegg, Hankey, Tiwari, Feuer, & Edwards, Reference Clegg, Hankey, Tiwari, Feuer and Edwards2009). The average APC (AAPC) was also estimated by assuming one segment for the full range of our study periods.
Age–period–cohort analysis with the intrinsic estimator method
The age–period–cohort model, which was developed based on the Poisson distribution, can simultaneously estimate net age, period, and cohort effects on incidence trends (Osmond, Reference Osmond1985). The age–period–cohort model can be expressed as follows:

where E(Mij) denotes the expectation of incidence rate for the ith age group for i = 1, …α age group at the jth time period for j = 1, …, p time period born in the kth cohort for k = 1, …, α + p–1 birth cohort of observed data; Mij, Dij, and Pij denote the observed incidence rate, incidence number, and population size of that group, respectively; μ denotes the intercept or adjusted mean incidence rate; αi denotes the ith throw age effect or the coefficient for the ith age group; βj denotes the jth column period effect or the coefficient for the jth time period; γk denotes the kth diagonal cohort effect or the coefficient for the kth cohort; and ɛij denotes the random error with expectation E(ɛij) = 0.
The age–period–cohort model requires an equal time interval in age, period, and cohort. Otherwise, an information overlap in the adjacent queues will occur. The GBD 2017 assumed that no incidence prior to age 5 or after age 50 existed for ED and AN and that no newly diagnosed case before age 5 or from 39 years onward was observed for BN. These settings are in line with the corresponding cause of death model for ED, AN, and BN. For ED and AN, the sex-specific rates were appropriately recorded into successive 5-year groups (5–9, 10–14, …, 45–49 years), consecutive 5-year period from 1990 to 2017, and correspondingly consecutive 5-year birth cohort groups starting from 1943–1947 to 2008–2012. For BN, the patients were grouped into seven 5-year intervals (5–9, 10–14, …, 35–39 years), six 5-year periods from 1990 to 2017, and 12 equal birth cohorts starting from 1953–1957 to 2008–2012.
Evaluation of the independent effects of age, period, and cohort is difficult because of the well-known non-identifiability problem (cohort = period–age) (Cao et al., Reference Cao, Eshak, Liu, Gero, Liu and Yu2019; Jean, O'Donnell, Lagacé, Walsh, & Bancej, Reference Jean, O'Donnell, Lagacé, Walsh, Bancej and Brown2013). To solve this problem, the age–period–cohort framework with the intrinsic estimator method was used to account for the effects that may vary over the interrelated time scales of chronologic age, calendar period of diagnosis, and year of birth (Fu, Reference Fu2000; Yang, Schulhofer-Wohl, Fu, & Land, Reference Yang, Schulhofer-Wohl, Fu and Land2008). The age–period–cohort analysis with the intrinsic estimator method provided estimated coefficients for the age, period, and cohort effects. These coefficients were transformed into the exponential value [exp(coef.) = ecoef.], which denotes the incidence relative risk (RR) of a particular age, period, or birth cohort relative to the average level of all ages, periods, or birth cohorts combined. For example, for the age effect in males, the RR of ED incidence in people aged 10–14 years was 2.98, which indicated that the risk in this age group was 2.98 times greater than the risk for all ages combined. The age–period–cohort analysis was performed using STATA 15.0 software (StataCorp, College Station, TX, USA).
Results
Descriptive analysis
Trends in ED's sex-specific age-standardized incidence rates and its subtypes in China from 1990 to 2017 are shown in Fig. 1. Generally, ED's sex-specific age-standardized incidence rates and its subtypes (AN and BN) continuously increased from 1990 to 2017. For ED and BN, the annual age-standardized incidence rates in males were significantly higher than those in females during the observation period. However, the opposite tendency was observed for AN.
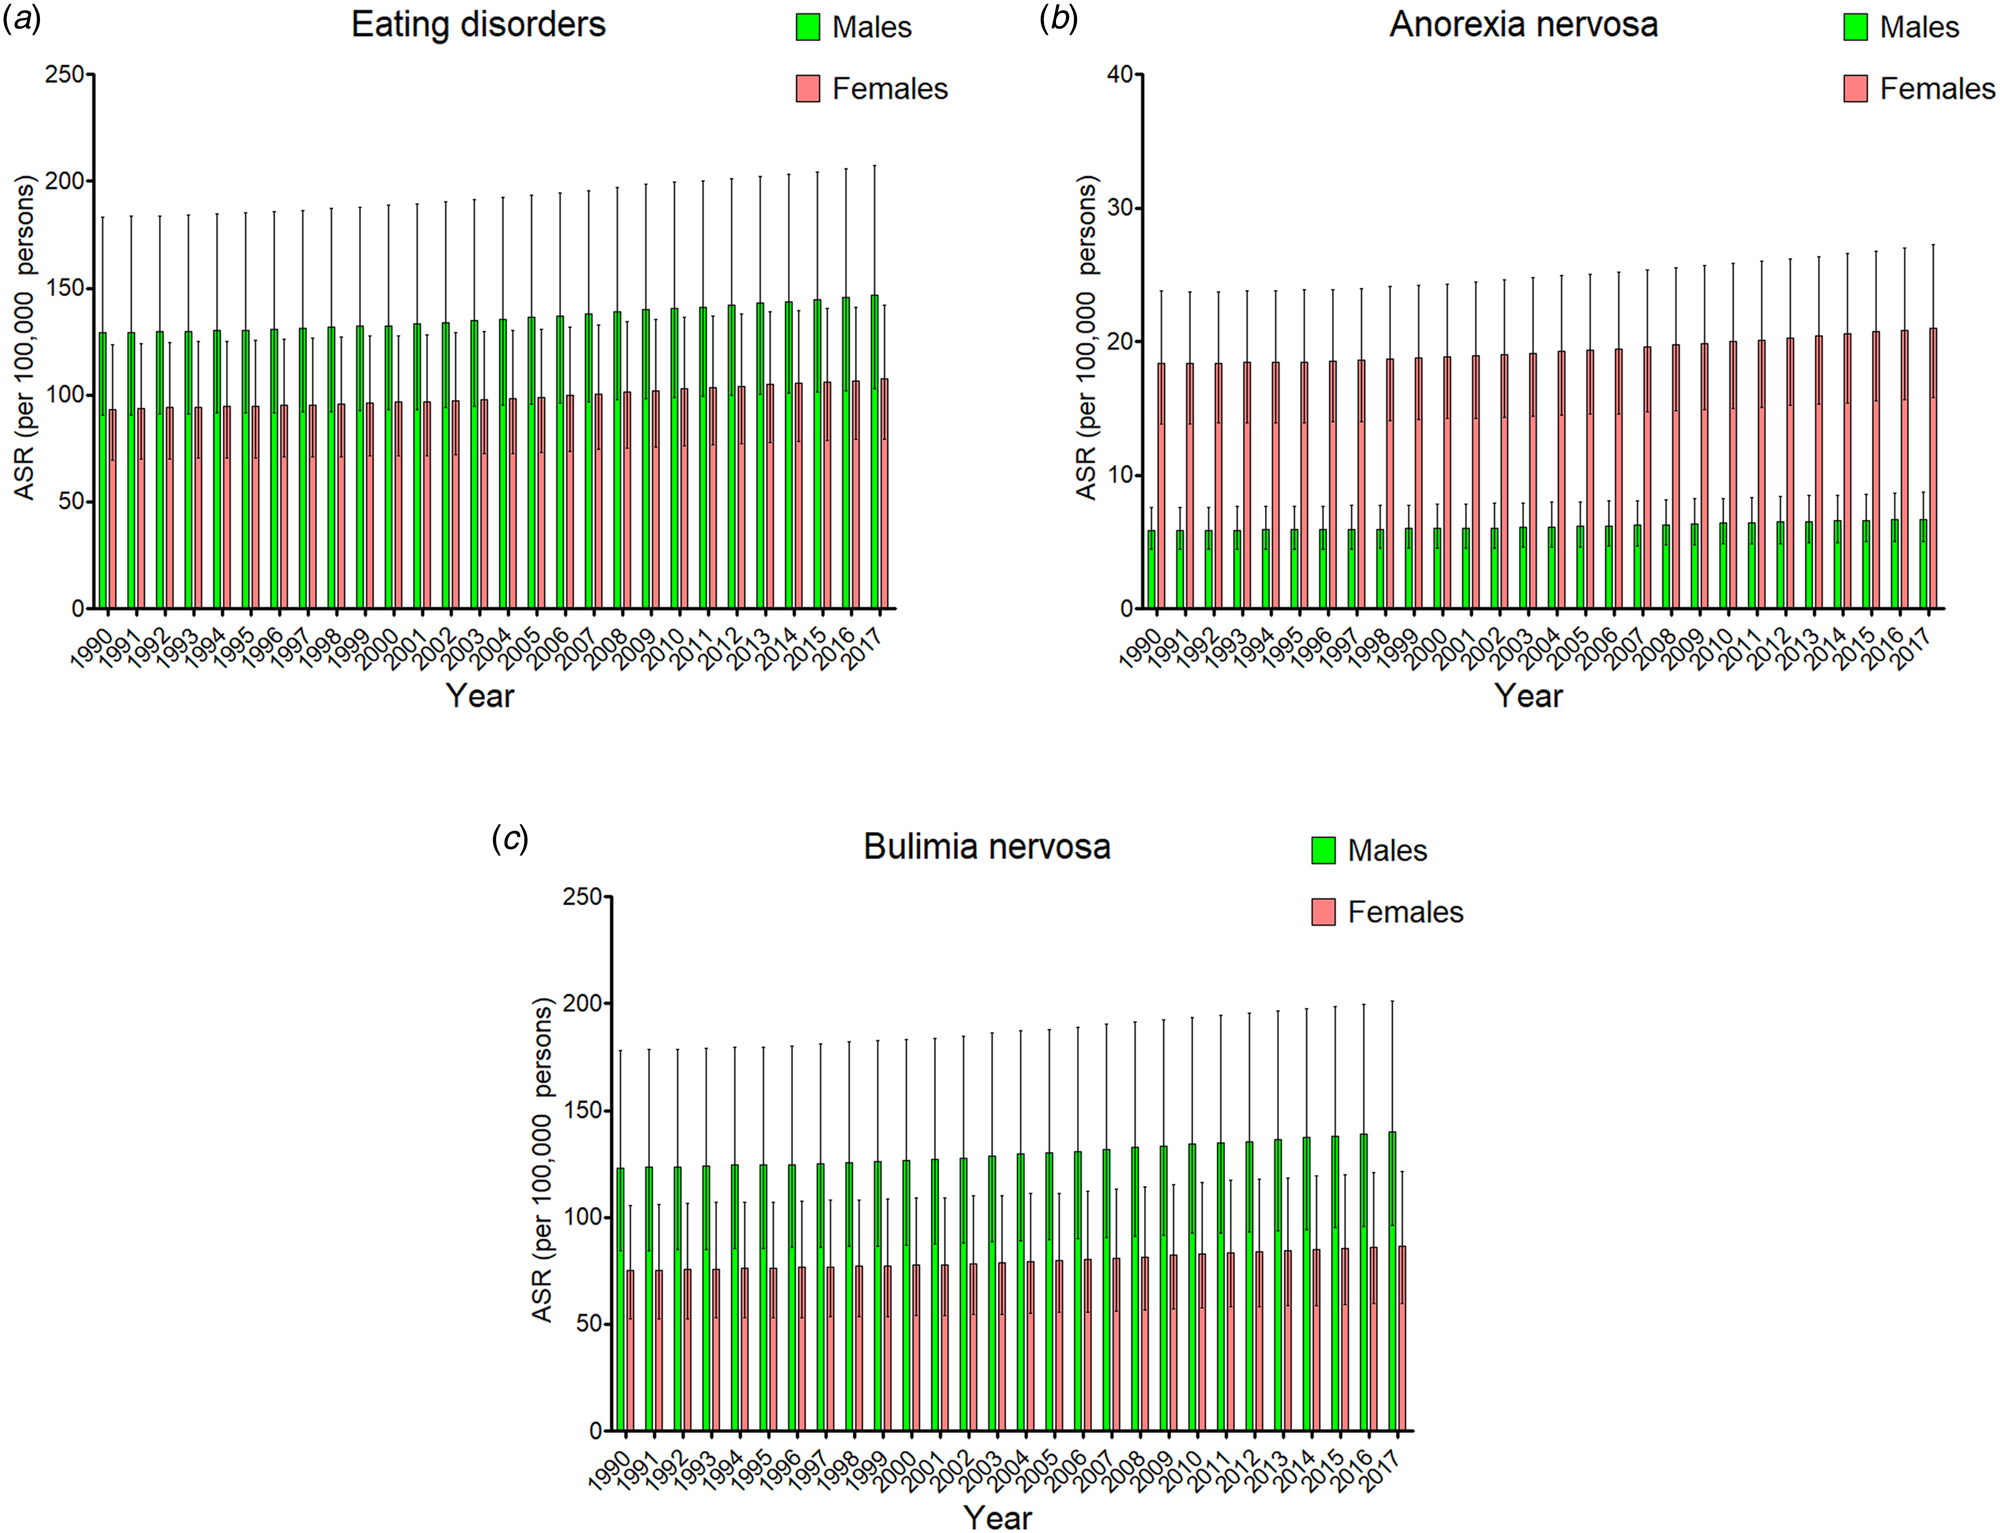
Fig. 1. The trends of eating disorders (a), anorexia nervosa (b), and bulimia nervosa (c) by sex in China from 1990 to 2017. ASR, age-standardized rates.
The incidence rates of ED, AN, and BN by age group in China in 2017 are listed in Table 1 and are shown in online Supplementary Fig. S1. In 2017, the age-standardized incidence rates of ED in China were 144.13 (95% UI 100.76–203.94) and 94.87 (95% UI 70.80–123.79) per 100 000 population of males and females, respectively. The age-standardized incidence rates were 7.51 (95% UI 5.62–9.70) in males and 22.46 (95% UI 15.56–29.67) in females for AN, and 136.63 (95% UI 92.58–197.51) in males and 72.41 (95% UI 49.90–102.02) in females for BN, respectively, per 100 000 population. For both sexes, the highest incidence rates of ED and BN were observed in the group aged 15–19 years, followed by the groups aged 20–24 and 25–29 years. For AN, the group aged 10–14 years exhibited the third highest sex-specific incidence rates, which were under the values of the groups aged 15–19 and 20–24 years.
Table 1. The sex–age-specific rates of eating disorders, anorexia nervosa, and bulimia nervosa in China in 2017 and their percentage changes from 1990 to 2017

a Indicated the AAPC was significantly different from zero at the α = 0.05 level.
UI, uncertainty interval; CI, confidence interval; ASR, age-standardized rates; AAPC, average annual percent change.
Joinpoint regression analysis
The AAPCs of age–sex-specific rates of ED and its subtypes from 1990 to 2017 are listed in Table 1, while the joinpoint regression analyses of sex-specific rates for ED and ED's subtypes are shown in online Supplementary Table S2, respectively. From 1990 to 2017, the age-standardized incidence rates of ED in China increased by 1.14% (95% CI 0.98–1.37, Fig. 2a) in males and 1.47% (95% CI 1.22–1.70, Fig. 2b) in females. The age-standardized incidence rates of AN rose by 1.54% (95% CI 1.32–1.81) in males (Fig. 2c) and 1.68% (1.55–1.92) in females (Fig. 2d) for AN, whereas the age-standardized incidence rates of BN rose by 1.11% (95% CI 0.95–1.33) in males (Fig. 2e) and 1.33% (1.21–1.49) in females (Fig. 2f). Significant increases in sex-specific incidence rates were also observed in ED, AN, and BN regardless of the age group. Moreover, the increments in age-standardized incidence rates of ED, AN, and BN after the 2000s were more pronounced than they were in the 1990s. In addition, compared to the males, the females showed substantial increases in ED and BN incidence for the past decade.

Fig. 2. Joinpoint regression analysis in sex-specific age-standardized incidence rates of eating disorders, anorexia nervosa, and bulimia nervosa in China from 1990 to 2017. (a) Eating disorders in males; (b) eating disorders in females; (c) anorexia nervosa in males; (d) anorexia nervosa in females; (e) bulimia nervosa in males; (f) bulimia nervosa in females. Notes: an asterisk indicates that the annual percent change is statistically significantly different from zero at the α = 0.05 level.
Age–period–cohort analysis with the intrinsic estimator method
The estimated RRs of ED incidence due to age, period, and cohort effects are shown in Table 2. When the period and cohort effects were controlled, the age RRs on ED incidence sharply increased from 0.12 (95% CI 0.09–0.18) in the group aged 5–9 to 9.13 (95% CI 7.96–10.51) in the group aged 15–19 for males, and from 0.20 (95% CI 0.15–0.26) in the group aged 5–9 to 5.67 (95% CI 5.13–6.27) in the group aged 15–19 for females. Then, RRs continuously decreased with increasing age in both males and females (Fig. 3a). Period and birth cohort have a non-significant effect on ED incidence. The RRs for period effects showed a slight increase from 0.98 (95% CI 0.82–1.16) in 1992 to 1.05 (95% CI 0.88–1.25) in 2017 for males, and from 0.93 (95% CI 0.83–1.05) in 1992 to 1.10 (95% CI 0.98–1.24) in 2017 for females (Fig. 3b). From the cohort effects, we observed that later birth cohorts experienced a relatively higher risk of developing ED compared to the earlier cohorts (Fig. 3c). The RRs due to cohort effects increased from 0.75 (95% CI 0.21–1.70) in the cohort 1943–1949 to 1.29 (95% CI 0.76–1.70) in the cohort 2008–2012 for males, and from 0.84 (95% CI 0.29–1.55) in the cohort 1943–1949 to 1.28 (95% CI 0.81–1.67) in the cohort 2008–2012 for females.

Fig. 3. Relative risks of eating disorders in China from 1990 to 2017 due to age (a), period (b), and cohort (c) effects.
Table 2. Sex-specific relative risks of eating disorders in China due to age, period, and cohort effects

Notes: RR denotes the relative risk of eating disorders incidence in a particular age, period, or birth cohort relative to the average level of all age, period, or birth cohort combined.
RR, relative risk; CI, confidence interval; AIC, Akaike Information Criterion; BIC, Bayesian Information Criterion.
The estimated RRs of AN incidence due to age, period, and cohort effects are shown in online Supplementary Table S3. With regard to AN, the highest RRs due to age effects were also observed in the group aged 15–19, and decreased with decreasing age before the age of 15. The RRs declined with increasing age after the age of 20, regardless of sex (online Supplementary Fig. S2a). Slight increments in RRs due to period and cohort effects were also observed in AN, which were similar to ED (online Supplementary Figs S2b–2c).
The estimated RRs of BN incidence due to age, period, and cohort effects are shown in online Supplementary Table S4. After an increase from the group aged 5–9 to the group aged 10–14, the RRs of BN due to age effects reached a peak in the group aged 15–19, and then significantly decreased with increasing age from 20 to 39 years (online Supplementary Fig. S3a). The RRs due to period effects increased from 0.76 (95% CI 0.71–0.80) in 1992 to 1.36 (95% CI 1.27–1.45) in 2017 for males, and from 0.75 (95% CI 0.68–0.81) in 1992 to 1.39 (95% CI 1.28–1.51) in 2017 for females (online Supplementary Fig. S3b). However, RRs of BN incidence due to cohort effects continuously decreased from the cohort 1953–1957 to the cohort 2008–2012 for both sexes, which differed from ED and AN (online Supplementary Fig. S3c).
Discussion
This study is the first to explore the long-term trends of ED incidence in China between 1990 and 2017 using the age–period–cohort framework. As expected, the estimated rates of AN incidence were higher in females than in males. A meta-analysis of 156 studies concluded that frequent appearance comparison led to more body dissatisfaction, especially among women as compared to men (Myers & Crowther, Reference Myers and Crowther2009). This study suggested that the popularization of healthy-eating attitudes and behaviors and a revision of distorted attitudes toward slimness are important. Although AN symptoms were much more common among females, males with AN may have more severe degree of medical complications, such as osteoporosis, than females (Westmoreland, Krantz, & Mehler, Reference Westmoreland, Krantz and Mehler2016). Also, men suffering from AN and a comorbid disease have a higher risk of suicide than women (Kask et al., Reference Kask, Ramklint, Kolia, Panagiotakos, Ekbom, Ekselius and Papadopoulos2017).
However, the age-standardized incidence rates of ED and BN in males were higher than those in females. These findings were inconsistent with the traditional views that men comprise a negligible proportion of the burden associated with ED. Most previous studies on the screening of ED in China were based on self-describing questionnaires, such as the Eating Attitudes Test, the Eating Disorder Inventory, the Eating Disorder Examination, and the Eating Disorder Examined Questionnaire. These questionnaires are of some value in identifying ED; however, they are not easy to define the central features of ED and are likely to produce an overestimate of ED diagnoses (Chan & Leung, Reference Chan and Leung2015; He, Sun, & Fan, Reference He, Sun and Fan2020). By contrast, face-to-face interviews based on the DSM criterion are regarded as the ‘gold standard’ in clinical ED assessment. In the first nationwide cross-sectional epidemiological survey of the prevalence of mental disorders in China, a two-stage design face-to-face interview based on DSM-IV criterion was conducted to identify people with different types of mental disorders among 32 552 participants with a proportion of 45.4% in males (Huang et al., Reference Huang, Wang, Wang, Liu, Yu, Yan and Wu2019). The results revealed that more males were detected as having ED than females with a male-to-female ratio of 4:1, which reflected that ED are more common in males than in females and the incidence rate of ED in males is higher than that in females in China. Traditionally, ED were categorized as AN, BN, and Eating Disorders Not Other Specified (EDNOS) by the previous diagnostic manuals, such as the DSM-IV. However, this classification was problematic because as many as three-quarters of ED patients fell into the catchall of EDNOS (Eddy et al., Reference Eddy, Le Grange, Crosby, Hoste, Doyle, Smyth and Herzog2010). Since 2013, the latest DSM-5 criteria have updated the diagnostic criteria that divide ED into four categories, namely, AN, BN, BED, and OSFEDs, to better capture the range of ED psychopathology observed in clinical practice (American Psychiatric Association, 2013). However, the GBD 2017 has not followed the latest DSM-5 classification, and only divided ED into two categories: AN and BN. Because of the similar clinical feature of recurrent episodes of binge eating (i.e. eating large amounts with loss of control), patients with BED were often diagnosed as BN, especially in the studies before 2013. Moreover, the previous GBD studies, such as GBD 2010, put BN, BED, and OSFEDs into one big category (Whiteford et al., Reference Whiteford, Degenhardt, Rehm, Baxter, Ferrari, Erskine and Vos2013). BED and OSFEDs are the most common subtypes of ED and demonstrate a smaller sex difference than AN and BN (Myers & Wiman, Reference Myers and Wiman2014; Raevuori, Keski-Rahkonen, & Hoek, Reference Raevuori, Keski-Rahkonen and Hoek2014). Thus, these factors might cause a higher estimate of ED in males than in females in the GBD studies.
In fact, many researchers believe that the male ED we are seeing today are just the tip of the iceberg. ED in males, cited in much of the previous research in China, are grossly underestimated (Dakanalis et al., Reference Dakanalis, Pla-Sanjuanelo, Caslini, Volpato, Riva, Clerici and Carrà2016). First, the marginalization of males from ED studies has hindered the assessment and clinical management of male patients (Murray et al., Reference Murray, Nagata, Griffiths, Calzo, Brown, Mitchison and Mond2017). Second, diagnostic efficiency would decline if the female-oriented diagnostic criteria were applied to males. Third, as ED are often considered primarily female disorders, men often face alienation and stigma for having a ‘women's disease’ (Robinson, Mountford, & Sperlinger, Reference Robinson, Mountford and Sperlinger2013). Thus, many male patients conceal the disease and do not seek treatment. Finally, diagnostic criteria were gender-biased, making it harder for males to be diagnosed. Therefore, it is difficult to get accurate data on how many men have this disease. Many recent studies indicate that ED in males are increasing as fast as those in females with no degree of difference in disease severity between the sexes (Mitchison & Mond, Reference Mitchison and Mond2015; Mitchison, Hay, Slewa-Younan, & Mond, Reference Mitchison, Hay, Slewa-Younan and Mond2014). To address this, the criteria for ED in the DSM-5 have recently been broadened to be less sex-specific. Although more attention has been focused on ED in males, there is still a clear lag in screening, assessment, classification, and treatment, which are in critical need of advancement. Until now, causes for sex differences in ED, such as genetic and cultural factors, have been less clear (Timko, DeFilipp, & Dakanalis, Reference Timko, DeFilipp and Dakanalis2019). Thus, the consideration of multivariate interaction, such as psychological, sociocultural, and environmental factors, may improve the understanding of the sex difference in ED incidence.
Globally, incidence rates have been stable in the past decades for AN, and stable or declining for BN (Treasure, Duarte, & Schmidt, Reference Treasure, Duarte and Schmidt2020). However, the joinpoint regression analysis showed that the incidence rates of ED continuously increased from 1990 to 2017 in China, regardless of subtype, sex, and age group. Importantly, these increments have been faster in the past two decades. As ED are associated with numerous comorbidities and even have the highest mortality among mental diseases, the relative burden of ED will further increase as the importance of other diseases, such as infection, and maternal and child diseases, decreases (GBD 2017 DALYs and HALE Collaborators, 2018). ED's increasing trends may be attributed to the improved awareness of mental disorders and changing diagnostic practices. According to a longitudinal study in China, economic growth was significantly associated with a deterioration in mental health in the 21st century (Wang & Tapia Granados, Reference Wang and Tapia Granados2019). An increase in rates was observed in all psychiatric diagnoses, and the increase in ED diagnosis was consistent with this general trend. As screening efforts improve and stigma is reduced, more ED patients seek treatment, which has also contributed to an increasing incidence rate of ED in China. Notably, people with atypical depression are likely to be misdiagnosed with BN because they often represent overeating and oversleeping in low-light months (Singleton, Kenny, Hallett, & Carter, Reference Singleton, Kenny, Hallett and Carter2019). Thus, clinicians must familiarize themselves with the clinical presentation and diagnostic criterion of ED to distinguish them from other mental disorders. While our understanding of ED has greatly improved, the available epidemiological data for ED in China are still limited. This lack of data about the general population prevents us from learning about the true epidemiology of ED in China.
Age is among the most important demographic factors for ED. In this study, the highest RRs of ED occurrence observed in the group aged 15–19 years in both males and females were not surprising, followed by the group aged 20–24 years. Students in high schools and universities, especially boarding schools, are considered high-risk populations for ED (Stice, Gau, Rohde, & Shaw, Reference Stice, Gau, Rohde and Shaw2017). These adolescents and young adults are in the period of development and are subject to stress related to body changes, further education, and employment, coupled with psychological immaturity. Hence, they are prone to developing various mental illnesses. Pursuit of the thin-ideal is among the most significant drives of the development of ED (Allen, Byrne, Oddy, & Crosby, Reference Allen, Byrne, Oddy and Crosby2013). The thin-ideal is very pervasive, and various groups face pressures to be thin from the media, family members, and peers (Cheng, Perko, Fuller-Marashi, Gau, & Stice, Reference Cheng, Perko, Fuller-Marashi, Gau and Stice2019). After puberty, adolescent women's weight gain is dominated by fat, which is in sharp contrast to the thin-ideal (Reference Keski-Rahkonen and MustelinKeski-Rahkonen & Mustelin, 2016). Young adults, especially females, are eager for peer recognition, and the peer assessment of weight, body size, and eating behavior are all very influential in individual behaviors (Nagata, Garber, Tabler, Murray, & Bibbins-Domingo, Reference Nagata, Garber, Tabler, Murray and Bibbins-Domingo2018). In the small groups to which young adults belong, they often share the same standard of ideal body size, which can lead to ED if the desired body size is unhealthy. Among all age groups, adolescents have the strongest desire to lose weight – a desire that extends to early adulthood (Rohde, Stice, & Marti, Reference Rohde, Stice and Marti2015).
Concerning the cohort effects, we determined that people born after the 1990s had a significantly higher risk of ED (RRs > 1) compared to the whole cohort. As China underwent rapid economic development, societal modernization, and the Westernization of its lifestyle after the 1990s, the possibility of exposure to various risk factors for ED is greater among people who were born after this period. In China, ED research began in the 1990s; after that, the recognition and diagnostic accuracy of ED have improved, resulting in an increased detection rate of ED. By contrast, people born after the 1990s suffered a lower risk of BN compared to the whole cohort, with one of the probable reasons being the more stringent diagnostic criteria for BN (Wade & O'Shea, Reference Wade and O'Shea2015). With respect to the period effects, the risk of developing BN continuously increased in all populations over time. This increasing trend of BN has been ascribed to certain sociocultural factors, including increased movement toward the value of thinness and the media's effects on the rise of health fashion (Tseng, Tu, Hsieh, & Chang, Reference Tseng, Tu, Hsieh and Chang2020). The term ‘risk factor’ refers to a measurable feature in existence prior to the onset of a disease. Until now, numerous risk factors have been identified as related to the onset of ED. For example, adolescent girls who gained or lost at least 10% of their body weight had a sevenfold increased risk of the onset of ED as compared to those with a stable weight, suggesting that body mass fluctuations may contribute to ED development (Thomas et al., Reference Zhou, Wang, Zeng, Yin, Zhu, Chen and Liang2011). Among women with a high degree of perfectionism and who regard themselves as overweight, ED symptoms are observed in those with low self-esteem (Kelly, Vimalakanthan, & Carter, Reference Kelly, Vimalakanthan and Carter2014). In terms of environmental factors, a higher level of parental education predicted a higher risk of ED in women; the number of female family members did not represent a risk factor for ED, whereas the presence of male siblings had a lowering effect on ED risk (Steinhausen & Jensen, Reference Steinhausen and Jensen2015). However, these risk factors were investigated based on single-center studies with small sample sizes. Further studies are required to validate these risk factors, especially the modifiable ones that can be included in a public health campaign to reduce the incidence of ED.
Although the GBD estimates fill the gap when the disease burden of ED on the general population of China is spare, some limitations should be acknowledged in the interpretation of the findings. First, the GBD estimates were reconstructed based on a large number of sources with different qualities, which (to some degree) may be deviant with regard to the actual data and which therefore must be validated by nationwide epidemiological surveys. Second, age–period–cohort analysis considers a community as the observed and analyzed unit, which can result in ecological fallacies. Thus, we have pointed out scientific assumptions concerning the causality of these temporal trends based on the available data and existing literature. Third, although the intrinsic estimator method represents the capability of non-bias, validity, asymptotic features, and superior estimation, the parameter estimates that this method generates are not intuitive. Moreover, the theoretical basis of this method is complicated, and the practical significance of parameter estimates cannot be explained. Fourth, because the GBD 2017 data did not include data on disease-related risk factors, we can only speculate on the drivers of the period and cohort effects that we observed for the ED incidence trends. Finally, BED and EDNOS contribute to a large proportion of the social burden, which should receive more attention, though the GBD 2017 made it impossible to understand their epidemiological situation.
Conclusion
In summary, a continuously increasing trend was seen in the incidence rates of ED in China from 1990 to 2017 regardless of subtype, sex, and age group, thereby predicting that the relative burden caused by ED will continue to increase in the future and should be a focus of research. Notably, adolescents have the highest risk of developing ED, followed by young adults, which suggests that age is the most influential factor in ED incidence. Period effects showed that the risk of developing ED continuously increased with increasing time periods in BN, but not in ED and AN. Concerning the cohort effects, people born after the 1990s presented a higher risk of ED and a lower risk of BN as compared to the whole cohort. Moreover, an enhanced understanding of risk profiles and onset patterns in ED could facilitate the early identification of individuals who are at risk of developing ED, thereby helping to match them with timely interventions that effectively reduce the ED burden.
Supplementary material
The supplementary material for this article can be found at https://doi.org/10.1017/S0033291720002706
Acknowledgements
This research was supported by the Natural Science Foundation of Guangdong (Grant No. 2015A030313827) from the Guangdong Natural Science Foundation Management Committee. The content is solely the responsibility of the authors and does not necessarily represent the official view of the Guangdong Natural Science Foundation Management Committee.
Conflict of interest
The authors have indicated that they have no conflicts of interest in the content of this article.


