


The stress response system (SRS) has a central role in orchestrating the physical and psychosocial development of both humans and nonhuman species (Ellis, Jackson, & Boyce, Reference Ellis, Jackson and Boyce2006; Korte, Koolhaas, Wingfield, & McEwen, Reference Korte, Koolhaas, Wingfield and McEwen2005) and crucially contributes to the ability to respond flexibly to challenges and opportunities in the environment (Boyce & Ellis, Reference Boyce and Ellis2005). One of the most remarkable features of the SRS is the wide range of individual variation in its physiological parameters. Some individuals respond quickly and strongly even to minor events, while others show relatively flat response profiles in most situations. Further, the balance of activation among the main SRS subsystems—the sympathetic nervous system (SNS), parasympathetic nervous system (PNS), and hypothalamus–pituitary–adrenal (HPA) axis—can vary considerably from one individual to the next. Understanding the causes of such individual differences and their development over the life course is important because patterns of stress responsivity regulate variation in a wide range of adaptive processes and behaviors, including (but not limited to) growth and metabolism, reproductive status and fertility, aggression and risk taking, pair bonding and caregiving, and memory and learning (Del Giudice, Ellis, & Shirtcliff, Reference Del Giudice, Ellis and Shirtcliff2011; Ellis & Del Giudice, Reference Ellis and Del Giudice2014).
In an attempt to advance understanding of individual differences in stress responsivity, Del Giudice et al. (Reference Del Giudice, Ellis and Shirtcliff2011) recently proposed the adaptive calibration model (ACM). Building on the theory of biological sensitivity to context (Boyce & Ellis, Reference Boyce and Ellis2005), the ACM has its main theoretical foundations in life history theory, an evolutionary biological framework for describing the developmental decisions of organisms and their allocation of resources over the life course (e.g., Belsky, Steinberg, & Draper, Reference Belsky, Steinberg and Draper1991; Chisholm, Reference Chisholm1999; Hill, Reference Hill1993; Kaplan & Gangestad, Reference Kaplan, Gangestad and Buss2005). In the ACM, individual differences in the SRS are thought to result largely (though not exclusively) from the operation of evolved mechanisms that function to match individuals' physiology and behavior to local environmental conditions over development. Thus, patterns of stress responsivity are seen as adaptive in the biological sense, because they operate in ways that ultimately tend to maximize the individual's probability of survival and reproduction (or at least did so in ancestral environments).
Although the ACM can be used to derive dozens of predictions at different levels of analysis, including predicted sex differences (for a full presentation of the model, see Del Giudice et al., Reference Del Giudice, Ellis and Shirtcliff2011), the current study does not attempt to test the full model. Instead, we provide a targeted empirical test of the four stress responsivity patterns hypothesized by the ACM in a longitudinal study of adolescent males (i.e., only the male-specific model of these patterns is tested here). We focus on the four responsivity patterns because of their centrality to the theory.
Life History Strategies in the ACM
Life history theory and research specifies relations between childhood exposures to stress and individual differences in the development of life history strategies (e.g., Belsky et al., Reference Belsky, Steinberg and Draper1991; Chisholm, Reference Chisholm1999; Ellis, Figueredo, Brumbach, & Schlomer, Reference Ellis, Figueredo, Brumbach and Schlomer2009; Nettle, Coall, & Dickins, Reference Nettle, Coall and Dickins2011). The ACM attempts to build on and further elucidate these relations by specifying intervening physiological mechanisms, as instantiated in the four responsivity patterns.
Different life history strategies encompass integrated suites of traits that vary along a dimension of slow versus fast (e.g., Ellis et al., Reference Ellis, Figueredo, Brumbach and Schlomer2009; Kaplan & Gangestad, Reference Kaplan, Gangestad and Buss2005). In terms of behavioral processes, individuals pursuing a slower life history strategy tend to have longer time horizons, tolerate more delay of gratification, show more aversion to risk, display better self-regulation and behavioral control, and maintain more cooperative and cohesive social relationships. By contrast, individuals pursuing a faster life history strategy tend to have shorter time horizons, discount future rewards and losses, engage in more risky and aggressive behavior, and are more socially antagonistic (Belsky et al., Reference Belsky, Steinberg and Draper1991; Ellis et al., Reference Ellis, Del Giudice, Dishion, Figueredo, Gray, Griskevicius and Wilson2012; Figueredo et al., Reference Figueredo, Vásquez, Brumbach, Schneider, Sefcek, Tal and Jacobs2006, Reference Figueredo, Wolf, Olderbak, Gladden, Fernandes, Wenner and Rushton2014). The behavioral indicators of life history strategy used in the current research were chosen to reflect these slow versus fast constructs.
Psychosocial Environmental Factors in the ACM
Following life history theory, the ACM responsivity patterns are shaped by early experiences and environmental conditions that are hypothesized to regulate the development of life history strategies: energy availability, extrinsic morbidity–mortality (i.e., external sources of disability and death that are relatively insensitive to the adaptive decisions of the organism), and environmental unpredictability (i.e., stability vs. instability of familial and ecological conditions; Ellis et al., Reference Ellis, Figueredo, Brumbach and Schlomer2009). Further, according to life history models, quality of parental investment (e.g., provision of resources, harsh parental discipline vs. warm and supportive parenting behaviors) serves as a conduit through which children receive information about risks and opportunities in their environment (Belsky et al., Reference Belsky, Steinberg and Draper1991; Ellis et al., Reference Ellis, Figueredo, Brumbach and Schlomer2009); thus, the effects of ecological factors on the development of children's life history strategies operate, in part, though these more proximal family processes.
Because the current research was conducted in a wealthy, stable Western country (The Netherlands), there was necessarily a restricted range of variation in some of the ecological factors that regulate life history strategy (e.g., energy availability and extrinsic morbidity–mortality). Accordingly, instead of trying to capture these ecological factors, the current research focused on more proximal family processes, resources, and experiences that reflect different levels of stress and support in and around the family (e.g., socioeconomic status, quality of parental investment, overall stressfulness of the child's life).
Finally, the ACM emphasizes that the development of stress responsivity is marked by a number of developmental “switch points” when plasticity is preferentially expressed and development is directed (or redirected) along alternative pathways. These switch points include the prenatal period, the first years of life, the juvenile transition (from early to middle childhood), and the pubertal transition. We attempted to measure environmental exposures over different developmental periods that roughly mapped on to these proposed switches (e.g., maternal report of prenatal stressors).
Patterns of Stress Responsivity in the ACM
According to the ACM, activation of the SRS and related biological systems during childhood provides crucial information about threats and opportunities in the environment, their type, and their severity. Over time, this information becomes embedded in the parameters (recurring set points and reactivity patterns) of these systems. These parameters provide the developing person with statistical summaries of key dimensions of the environment and function to regulate development of life history strategies to match those dimensions. The ACM posits that relations between psychosocial environmental factors encountered over development, stress responsivity levels (across the PNS, SNS, and HPA axis), and life history strategies have been organized by natural selection in ways that are complex and nonlinear, and that these relations can be characterized by a taxonomy of four prototypical responsivity patterns: sensitive (I), buffered (II), vigilant (III), and unemotional (IV).
Sensitive (Type I)
As shown in Figure 1, the sensitive responsivity pattern, in comparison with other ACM responsivity patterns, is predicted to develop in safe, low-stress environments. A highly responsive SRS in this context is hypothesized to enhance social learning and engagement with the external world. The physiological profile of sensitive individuals should favor sustained but flexible attention and sensitivity to social feedback, supporting a slower life history strategy (e.g., relatively low levels of risky and aggressive behavior and an orientation toward longer term investments and outcomes). Thus, the sensitive pattern, more than any other ACM pattern, should be associated with a slower life history strategy (Figure 1). The ACM proposes that sensitive phenotypes will be characterized by high PNS responsivity, moderate to high SNS responsivity, and high HPA responsivity (Table 1).

Figure 1. Predicted curvilinear relation between developmental context and optimal levels of stress responsivity. Developmental context refers to variation in rearing experiences (i.e., individual differences in developmental exposures to key dimensions of environmental stress and support). The figure does not imply that all components of the stress response system will show identical responsivity profiles, nor that they will activate at the same time or over the same time course (see Table 1 for specific predictions regarding different stress response system parameters). Male/female symbols indicate sex-typical patterns of responsivity, but the model also predicts substantial within-sex variation. Adapted from “The Adaptive Calibration Model of Stress Responsivity,” by M. Del Giudice, B. J. Ellis, and E. A. Shirtcliff, 2011, Neuroscience & Biobehavioral Reviews, 35, p. 1577. Copyright 2011 by Elsevier. Adapted with permission.
Table 1. Predicted physiological profiles of the four responsivity patterns
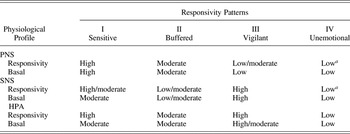
Note: Adapted from “The Adaptive Calibration Model of Stress Responsivity,” by M. Del Giudice, B. J. Ellis, and E. A. Shirtcliff, 2011, Neuroscience & Biobehavioral Reviews, 35, p. 1578. Copyright 2011 by Elsevier. Adapted with permission.
a Unemotional individuals may display autonomic activation when faced with immediate physical threats and during agonistic confrontations, in contrast to their general pattern of unresponsivity to nonagonistic stressors.
Buffered (Type II)
Buffered patterns are essentially expected to be “average on everything.” They are predicted to develop preferentially under conditions of moderate environmental stress, where they strike a balance between the costs and benefits of responsivity. Buffered responsivity is predicted to arise primarily through moderate, repeated activation of the SRS in childhood. Buffered responsivity is expected to be the modal pattern in most populations (with most SRS parameters set around the mean), particularly in low-risk, middle-class populations. Compared to Type III and IV patterns, buffered individuals are predicted to be lower in anxiety and aggression, less risk prone, and more sensitive to social feedback. Buffered responsivity can thus look like a “protective factor,” as postulated by the stress inoculation hypothesis (e.g., Macrì, Zoratto, & Laviola, Reference Macrì, Zoratto and Laviola2011; Parker & Maestripieri, Reference Parker and Maestripieri2011).
Vigilant (Type III)
Compared to sensitive and buffered patterns, vigilant patterns are predicted to develop in stressful contexts, where they enable people to cope with dangers and threats in the physical and social environment. Their SNS-dominated physiological profile mediates heightened attention to threats and high trait anxiety. In the ACM, the vigilant pattern, in comparison with the sensitive and buffered patterns, is predicted to be associated with elevated levels of aggressive/antisocial behavior (i.e., increased risk taking, agonistic social competition, and reactive aggression, as per a fast life history strategy). Further, compared with all of the other ACM patterns, the vigilant pattern is predicted to be associated with high levels of anxious/depressed behaviors. Thus, the vigilant pattern is most likely to be characterized by comorbid externalizing and internalizing behavior problems. The ACM proposes that vigilant phenotypes will be characterized by low to moderate PNS responsivity, high SNS responsivity, and high HPA responsivity (Table 1).
Unemotional (Type IV)
Compared with all of the other responsivity patterns, the unemotional pattern is predicted to display a profile of low stress responsivity (across PNS, SNS, and HPA systems; see Table 1), a developmental history of high exposures to stress, and fast life history strategies (as shown in Figure 1). Generalized unresponsivity inhibits social learning and sensitivity to social feedback; it can also increase risk taking by blocking information about dangers and threats in the environment (e.g., low anxiety). The predicted correlates of this pattern are low empathy and cooperation, impulsivity, competitive risk taking, and antisocial behavior, including high levels of proactive/instrumental aggression, especially in males.Footnote 1
In total, the proposed ACM responsivity patterns afford a number of hypotheses regarding relations between psychosocial environmental factors, stress responsivity profiles, and behavioral indicators of life history strategies. The ACM does not articulate these hypotheses with enough precision, however, to predetermine specific cutoffs for distinguishing between, for example, high versus moderate levels of childhood stress, low versus moderate levels cortisol reactivity, and so forth. Thus, in the current test of the model, higher versus lower will be determined relative to others in the sample (e.g., individuals displaying a sensitive stress physiology profile should be more likely to have grown up under safe, stable conditions than individuals displaying other stress physiology profiles).
Nonlinear Effects of Early Chronic Stress on SRS Functioning
A long-standing puzzle concerns the direction of the effects of early chronic stress on SRS functioning. Psychosocial stress and adversity over development can either upregulate or downregulate levels of SNS, PNS, and HPA responsivity. The empirical literature on this topic remains highly conflicted. On the one hand, many studies link stressful rearing experiences to hyperreactivity (e.g., Bosch et al., Reference Bosch, Riese, Reijneveld, Bakker, Verhulst, Ormel and Oldehinkel2012; de Bellis et al., Reference De Bellis, Baum, Birmaher, Keshavan, Eccard, Boring and Ryan1999; Essex et al., Reference Essex, Klein, Cho and Kalin2002; Evans & Kim, Reference Evans, Greaves-Lord, Euser, Tulen, Franken and Huizink2007; Hill-Soderlund et al., Reference Hill-Soderlund, Mills-Koonce, Propper, Calkins, Granger, Moore and Cox2008; Yehuda, Reference Yehuda2002), supporting the vigilant responsivity pattern. On the other hand, an equally impressive number of studies link stressful rearing experiences to hyporeactivity (e.g., Bruce, Fisher, Pears, & Levine, Reference Bruce, Fisher, Pears and Levine2009; Gunnar & Vazquez, Reference Gunnar, Vazquez, Cicchetti and Cohen2006; Gustafsson, Anckarsäter, Lichtenstein, Nelson, & Gustafsson, Reference Gustafsson, Anckarsäter, Lichtenstein, Nelson and Gustafsson2010; Tarullo & Gunnar, Reference Tarullo and Gunnar2006; Vigil, Geary, Granger, & Flinn, Reference Vigil, Geary, Granger and Flinn2010), supporting an unemotional responsivity pattern. To further complicate matters, an emerging body of research has now also linked highly supportive and nurturing family environments (as opposed to stressful ones) to heightened SNS, PNS, or HPA responsivity (e.g., Alkon et al., Reference Alkon, Boyce, Tran, Harley, Neuhaus and Eskenazi2014; Berry et al., Reference Berry, Blair, Willoughby, Granger and Mills-Koonce2016; Ellis, Essex, & Boyce, Reference Ellis, Essex and Boyce2005; Evans et al., Reference Evans, Greaves-Lord, Euser, Tulen, Franken and Huizink2013; Hackman et al., Reference Hackman, Betancourt, Brodsky, Kobrin, Hurt and Farah2013; Luecken, Kraft, & Hagan, Reference Luecken, Kraft and Hagan2009), supporting the sensitive pattern. Finally, the emergence of buffered responsivity patterns under conditions of moderate environmental stress is empirically consistent with the stress inoculation hypothesis, the idea that early exposure to repeated mild stressors downregulates the SRS and leads to increased resistance to stress later on (reviewed in Macrì et al., Reference Macrì, Zoratto and Laviola2011; Parker & Maestripieri, Reference Parker and Maestripieri2011). Taken together, although there is some empirical evidence for each of the four stress responsivity patterns specified by the ACM, no consensus has emerged regarding how childhood experiences regulate SRS functioning, and the implications of this literature for intervention remain unclear.
The ACM potentially explains these disparate findings by specifying nonlinear relations between environmental conditions and development of stress responsivity (Figure 1 and Table 1). According to the theory, developmental exposures to low to moderate levels of stress either upregulateFootnote 2 (in the sensitive pattern) or downregulate (in the buffered pattern) responsivity; likewise, developmental exposures to high levels of stress either upregulate (in the vigilant pattern) or downregulate (in the unemotional pattern) responsivity. Thus, if one considers the environment–responsivity curves shown in Figure 1, it is apparent that the results of any single study looking at linear statistical relationships can range from positive to null to negative, depending on the portion of the curve sampled in each case (Boyce & Ellis Reference Boyce and Ellis2005; Ellis et al., Reference Ellis, Essex and Boyce2005). The many inconsistent results in the stress literature may depend, at least in part, on the failure to consider nonlinear relationships between environmental factors and SRS parameters, or the failure to assess the full range of environmental variance necessary to capture all four patterns of responsivity and associated behavioral strategies specified by the ACM.
Past Research Testing the ACM
The ACM seeks to integrate the developmental study of stress responsivity in a modern evolutionary framework. An important feature of the ACM is the unified treatment of developmental outcomes in both supportive and risky environments. Many empirical studies have attempted to link child and adolescent physiological profiles with the kinds of contextual factors and behavioral outcomes theorized in ACM (reviewed in Del Giudice et al., Reference Del Giudice, Ellis and Shirtcliff2011; Ellis, Del Giudice, & Shirtcliff, Reference Ellis, Del Giudice, Shirtcliff, Beauchaine and Hinshaw2013; Obradovic, Reference Obradović2012; see above, Nonlinear Effects of Early Chronic Stress on SRS Functioning). Although not explicitly designed to test the four responsivity patterns of the ACM, some of these studies have used the model as a framework for interpreting their results (e.g., Berry et al., Reference Berry, Blair, Willoughby, Granger and Mills-Koonce2016; Essex et al., Reference Essex, Shirtcliff, Burk, Ruttle, Klein, Slattery and Armstrong2011; Laurent et al., Reference Laurent, Neiderhiser, Natsuaki, Shaw, Fisher, Reiss and Leve2014; Marsman et al., Reference Marsman, Nederhof, Rosmalen, Oldehinkel, Ormel and Buitelaar2012; Peckins, Susman, Negriff, Noll, & Trickett, Reference Peckins, Susman, Negriff, Noll and Trickett2015). However, because these studies tested ACM-related hypotheses based one SRS subsystem (e.g., HPA axis), rather than the ACM itself (which specifies complex interactions across multiple SRS subsystems), it is difficult to draw specific inferences about the validity of the ACM based on the results of these studies. There have not yet been any direct empirical tests of the ACM that have assessed all three SRS subsystems (PNS, SNS, and HPA) and incorporated indicators of life history strategy.
Only one previous empirical study has explicitly attempted to validate the four-pattern classification of the ACM (Del Giudice, Hinnant, Ellis, & El-Sheikh, Reference Del Giudice, Hinnant, Ellis and El-Sheikh2012). This study, which examined stress responsivity patterns in an at-risk sample of 8- to 10-year-old children, was able to identify four classes of autonomic nervous system activity during resting conditions and in response to a stressful task. SNS activity was indexed by skin conductance level and PNS activity was indexed by respiratory sinus arrhythmia (RSA). Physiological differences between the classes were dominated by SNS activity and (to a lesser extent) PNS basal activity. Further, the four patterns were associated with different levels of family stress, with two components of environmental stress emerging as significant predictors of class membership: negative family relationships and family warmth/predictability. As predicted, high-responsivity and low-responsivity patterns were found under both low-stress and high-stress conditions.
At the same time, the study by Del Giudice et al. (Reference Del Giudice, Hinnant, Ellis and El-Sheikh2012) had several limitations that we address in the current research. First, measures of physiological activity were limited to the autonomic nervous system; however, HPA axis functioning is central to the ACM and needs to be taken into account when determining responsivity patterns. We thus included measures of not only autonomic nervous system but also HPA axis functioning. Second, Del Giudice et al. (Reference Del Giudice, Hinnant, Ellis and El-Sheikh2012) employed the star-tracing task (a cognitive challenge) to elicit stress responsivity. Although the star-tracing task is a valid procedure, social–evaluative threats, and particularly exposure to challenging conditions that reliably elicit HPA axis activation, are necessary to obtain all of the responsivity data needed to classify individuals into the four responsivity patterns of the ACM. To address this issue, the current research employed a version of the Trier Social Stress Test, which past reports have shown to induce significant autonomic and HPA reactivity in this sample (Oldehinkel et al., Reference Oldehinkel, Ormel, Bosch, Bouma, van Roon, Rosmalen and Riese2011). Third, and most critically, Del Giudice et al. (Reference Del Giudice, Hinnant, Ellis and El-Sheikh2012) did not examine linkages between the identified responsivity patterns and indicators of life history strategy. Testing for these linkages is necessary to evaluate the theory, and especially to distinguish sensitive from vigilant phenotypes and buffered from unemotional phenotypes, which are hypothesized to display overlapping patterns of stress physiology but different life history strategies. The current research thus included assessment of life history strategy.
In addition to the work by Del Giudice et al. (Reference Del Giudice, Hinnant, Ellis and El-Sheikh2012), Quas et al. (Reference Quas, Yim, Oberlander, Nordstokke, Essex, Armstrong and Boyce2014) tested for coordinated patterns of stress responsivity across the PNS, SNS, and HPA axis. Because this work was not explicitly guided by the ACM and did not include measures of life history strategy, we defer discussion of Quas et al. (Reference Quas, Yim, Oberlander, Nordstokke, Essex, Armstrong and Boyce2014) until the Discussion section.
The Current Study
The current study examined responsivity patterns in a longitudinal study of adolescent males (N = 351), who were followed prospectively from ages 11 to 16 years. We focused on males because of constraints in studying HPA axis reactivity in females. Specifically, HPA axis reactivity measures in girls using oral contraceptives (43%) were not valid in our sample. Bouma, Riese, Ormel, Verhulst, and Oldehinkel (Reference Bouma, Riese, Ormel, Verhulst and Oldehinkel2009) showed that these girls do not show a cortisol response to the social stress test, whereas girls who do not use oral contraceptives do show a response. Because of the centrality of HPA axis functioning to the ACM, because the only previous empirical test of the ACM was greatly limited by the absence of HPA data (Del Giudice et al., Reference Del Giudice, Hinnant, Ellis and El-Sheikh2012), and because girls who are using oral contraceptives, on average, can be expected to differ from girls not using oral contraceptives on life history strategy (and thus dropping the contraceptive users would likely bias our sample on the main dependent variable), we chose to restrict our analyses to boys.
Employing latent profile analysis (LPA), our main goals were (a) to validate the four-pattern classification of the ACM using measures of the three SRS subsystems (SNS, PNS, and HPA axis) as class indicators and (b) to test for predicted associations between these four patterns and both antecedent environmental conditions and life history strategies. Although the four patterns described in Del Giudice et al. (Reference Del Giudice, Ellis and Shirtcliff2011) and summarized here are not intended to be an exhaustive taxonomy of stress responsivity profiles, they should emerge reliably as a broadband descriptive classification.
SNS activity was indexed by cardiac preejection period (PEP), the time interval between the onset of ventricular depolarization and the opening of the aortic valve, which gauges beta-adrenergic influences on the heart; PNS activity was indexed by RSA, a measure of the influence of the myelinated vagus on beat to beat variation in heart rate over the inhalation versus exhalation phases of a breathing cycle; and HPA axis activity was measured through salivary cortisol, the principal human glucocorticoid. Following the ACM, these three SRS subsystems were assessed under basal conditions and in response to laboratory stressors. In addition, to provide a more complete profile of the functioning of the SRS, we also assessed speed of recovery of each subsytem after the stress test. Although the ACM does not advance detailed predictions about recovery, the increasing recognition of the importance of recovery measures as indicators of stress responsivity (see Koolhaas et al., Reference Koolhaas, Bartolomucci, Buwalda, de Boer, Flügge, Korte and Fuchs2011) justifies their inclusion in the analyses.
The assessment of life history strategy focused on more general behavioral strategies rather than specific sexual or reproductive outcomes. In life history theory, the prediction that psychosocial stress will accelerate pubertal development is specific to girls (e.g., James, Ellis, Schlomer, & Garber, Reference James, Ellis, Schlomer and Garber2012); thus, timing of puberty would not be a useful life history marker in the current study of adaptive calibration in boys. Further, data on number of sexual partners were not collected at age 16. Instead, we assessed aggressive/rule-breaking behavior to index components of a fast life history strategy involving aggressive, risky, and socially antagonistic behavior. Conversely, we assessed self-regulation/effortful control to index components of a slow life history strategy involving self-discipline and behavioral and attentional control. In addition, because the ACM includes hypotheses about internalizing behaviors, we included measures of anxiety and depression. To gauge environmental stress and support during the proposed ACM “switch points” for the calibration of stress responsivity, we assessed prenatal and perinatal risk factors, childhood stress in the first decade of life, and socioeconomic status and quality of family environment at age 11.
Methods
Sample
Data were collected in the Tracking Adolescents' Individual Lives Survey (TRAILS), a large prospective population study of Dutch adolescents with bi- or triennial measurements from age 11 to at least early adulthood (Oldehinkel, Rosmalen, et al., Reference Oldehinkel, Rosmalen, Buitelaar, Hoek, Ormel, Raven and Hartman2014; Ormel et al., Reference Ormel, Oldehinkel, Sijtsema, van Oort, Raven, Veenstra and Verhulst2012). Parental informed consent was obtained after the procedures had been fully explained. Detailed information about sample selection and analysis of nonresponse bias has been reported elsewhere (de Winter et al., Reference de Winter, Oldehinkel, Veenstra, Brunnekreef, Verhulst and Ormel2005; Nederhof et al., Reference Nederhof, Jorg, Raven, Veenstra, Verhulst, Ormel and Oldehinkel2012). Data presented in this article are from the first (Time 1 [T1], March 2001 to July 2002), second (Time 2 [T2], September 2003 to December 2004), and third (Time 4 [T3], September 2005 to August 2008) assessment waves of TRAILS (Nederhof et al., Reference Nederhof, Jorg, Raven, Veenstra, Verhulst, Ormel and Oldehinkel2012). During T3, a subsample of 744 adolescents were invited to perform a series of laboratory tasks, in addition to the usual assessments, hereafter referred to as the laboratory session. It was during this laboratory session that participants were assessed on biological reactivity to stress. We slightly oversampled participants with a high risk of mental health problems. High risk was defined based on temperament (high frustration and fearfulness, low effortful control), lifetime parental psychopathology (depression, anxiety, addiction, psychoses, or antisocial behavior), and living in a single-parent family. In total, these higher risk adolescents represented 66% of participants in the laboratory session, whereas they represented 58% of the total TRAILS population (see details in Sijtsema et al., Reference Sijtsema, Nederhof, Veenstra, Ormel, Oldehinkel and Ellis2013). Of all invited adolescents, 715 (96.1%; 351 boys) agreed to participate. Using full information maximum likelihood estimations, we were able to use data from all 351 boys who participated in the laboratory session. These boys had a mean age of 11.11 years (SD = 0.55, range = 10.05–12.54) at T1, 13.49 years (SD = 0.49, range = 12.38–15.08) at T2, and 16.14 years (SD = 0.61, range = 14.87–18.13) at T3.
Laboratory session
The laboratory session consisted of a number of different challenges, listed here in chronological order: a spatial orienting task, a gambling task, a startle reflex task, and a social stress test. The session was preceded and followed by a 40-min period of rest. The participants filled out a number of questionnaires at the start and end of the session. Before, during, and after the experimental session, extensively trained test assistants assessed cardiovascular measures and cortisol. The experimental protocol was approved by the Central Committee on Research Involving Human subjects. The laboratory sessions took place on weekdays, in soundproof rooms with blinded windows at selected locations in the towns where participants resided. The sessions lasted about 3.25 hr and started between 8:00 and 9:30 a.m. (morning sessions, 49%) or between 1:00 and 2:30 p.m. (afternoon sessions, 51%). Participants were asked to refrain from smoking and from using coffee, milk, chocolate, and other sugar containing foods in the 2 hr before the session. In addition, the tasks preceding the stress test took about 2 hr, during which time the participants did not eat anything. At the start of the session, the test assistant, blind to the participants' risk status, explained the procedure and administered a short checklist on current medication use, quality of sleep, and physical activity in the last 24 hr. Participants were attached to the equipment for cardiac autonomic measurements at this time.
Sympathetic, parasympathetic, and HPA (re)activity were assessed in response to the Groningen Social Stress Task (GSST; see Bouma et al., Reference Bouma, Riese, Ormel, Verhulst and Oldehinkel2009), a standardized protocol inspired by the Trier Social Stress Task (Kirschbaum, Pirke, & Hellhammer, Reference Kirschbaum, Pirke and Hellhammer1993) for the induction of moderate performance-related social stress. During the GSST, cardiac autonomic function was recorded continuously. Participants were instructed, on the spot, to prepare a 6-min speech about themselves and their lives and deliver this speech in front of a video camera. They were told that their videotaped performance would be judged on content of speech as well as on use of voice and posture, and rank ordered by a panel of peers after the experiment. The risk of being judged negatively by peers was included to induce threat of social rejection. Participants had to speak continuously for the whole period of 6 min. The test assistant watched the performance critically, without showing empathy or encouragement. After 6 min of speech, the participants were told that there was a problem with the computer and they had to sit still and be quiet. Subsequently, they were asked to perform mental arithmetic. The participants were instructed to repeatedly subtract the number 17 from a larger sum, starting with 13,278. A sense of uncontrollability was induced by repeated negative feedback from the test assistant (e.g., “No, wrong again, begin at 13,278”). The mental arithmetic challenge lasted for 6 min, again followed by a 3-min period of silence, after which the participants were debriefed about the experiment.
Measures: Biological (re)activity
HPA
Salivary cortisol (nmol/l) was assessed with a Salivette sampling device (Sarstedt, Numbrecht, Germany) containing a small swab in a plastic tube on which the participants had to chew for 60 s until the swab was soaked with saliva (for details on collection, storage, and assays, see Bouma et al., Reference Bouma, Riese, Ormel, Verhulst and Oldehinkel2009). Participants were asked to collect two morning saliva samples on the day of the laboratory session, one directly after waking up (mean time of awakening was 7:39 a.m., SD = 1:10 hr) and one 30 min later; they were instructed to neither eat nor brush their teeth prior to the collection of these samples. Morning cortisol was available for 308 boys. Basal HPA axis functioning was operationalized as cortisol concentration at waking up. Cortisol levels were also assessed just before the start of the GSST (Cortisol 1 [C1], available for 342 boys), directly after the end of the test (Cortisol 2 [C2], available for 344 boys), 20 min after the test (Cortisol 3 [C3], not used in the current analyses), and 40 min after the test (Cortisol 4 [C4], available for 340 boys). All cortisol samples were set at missing for 10 boys due to medication or drug use or smoking before the experiment that could influence cortisol concentrations.
Because there is a delay of approximately 20 min between the production of cortisol by the adrenal glands and the detectability of representative levels of cortisol in saliva (Kirschbaum, Read, & Hellhammer, Reference Kirschbaum, Read and Hellhammer1992), all samples reflect stress reactions about 20 min earlier. For most participants, C1 captured their lowest cortisol levels (Bouma et al., Reference Bouma, Riese, Ormel, Verhulst and Oldehinkel2009), as it reflects HPA axis activity 20 min earlier when the participants were filling out questionnaires; C1 was thus considered a pretest measure. C2 was peak cortisol (Bouma et al., Reference Bouma, Riese, Ormel, Verhulst and Oldehinkel2009), because it was taken immediately after cessation of the test (and thus reflects HPA axis activity 20 min earlier, which corresponds to the time when participants had just finished the 7-min preparation phase and were about to start their speech—a highly stressful point in the GSST). C4 was considered a recovery measure, as cortisol levels had returned almost to C1 levels (Bouma et al., Reference Bouma, Riese, Ormel, Verhulst and Oldehinkel2009).Footnote 3 HPA axis reactivity was operationalized as the residual of C2 predicted by C1. HPA axis recovery was operationalized as the residual of C4 predicted by C2. Two scores (>5 SD from the mean) were removed as outliers.
Autonomic nervous system
Cardiac autonomic function was assessed prior to the GSST (pretest: 300 s), during speech (360 s), after speech (180 s), and 25 min posttest (300 s), with each assessment based on the mean for that block. A three-lead electrocardiogram and a four-lead impedance cardiogram were registered using 3M/RedDot Ag/AgCl electrodes (Type 2255, 3M Health Care, Neuss, Germany), while the participant was sitting and breathing spontaneously. With a BIOPAC Amplifier-System (MP100, Goleta, CA), the signals were amplified and filtered before digitization at 250 samples/second. Dedicated software (PreCARSPAN, previously used in, e.g., Dietrich et al., Reference Dietrich, Riese, Sondeijker, Greaves-Lord, van Roon, Ormel and Rosmalen2007) was used to visually inspect the signal for stationarity and arrhythmias, to correct for artifacts, to detect R-peaks, and to calculate the interbeat interval between two heartbeats. Blocks were considered invalid if they contained artifacts with a duration of more than 5 s, if the total artifact duration was more than 10% of the registration, or if the block length was less than 100 s.
PNS activity was operationalized as heart rate variability in the high-frequency band (0.15–0.40 Hz), also called RSA (ms2s); higher scores (i.e., greater variability) indicate stronger PNS influence on cardiac function (i.e., greater tonic inhibitory control of heart rate through the vagus; Thayer & Lane, Reference Thayer and Lane2009). Calculation of RSA was performed by power spectral analysis in the CARSPAN software program (Mulder, van Dellen, van der Meulen, & Opheikens, Reference Mulder, van Dellen, van der Meulen, Opheikens, Maarse, Mulder and Akkerman1988) using estimation techniques based on Fourier transformations of interbeat interval series (Robbe et al., Reference Robbe, Mulder, Ruddel, Langewitz, Veldman and Mulder1987). For RSA, 331 scores were available during speech, 323 scores were available after speech, and 336 scores were available at rest. The missing data resulted from problems with the ECG data (e.g., <100 s were available). Five PNS scores were removed as outliers (>5 SD from the mean).
Thoracic impedance was assessed with a BIOPAC NICO100C Noninvasive Cardiac Output Module. The PEP reflects the time interval in milliseconds between the onset of the electromechanical systole (Q-wave onset) in the ECG and the opening of the aortic valves co-occurring with the B-point in the ICG. The B-points were manually scored by an extensively trained rater using the VU-AMS interactive software. When there was doubt about the B-point, the scoring was discussed with a second rater. Outliers were checked, and quality of the PEP rates was subjectively scored on a 0–10 scale. PEP data were considered invalid if the quality of the PEP was low (i.e., a score of <6) or the signal contained too many artifacts (including participants with arrhythmias or extrasystoles). Valid PEP data were available for 296 boys during speech, 295 boys after speech, and 301 boys during rest. There were no PEP outliers.
Because autonomic arousal was significantly lower and less variable at posttest than at any other measurement period (Oldehinkel et al., Reference Oldehinkel, Ormel, Bosch, Bouma, van Roon, Rosmalen and Riese2011), the posttest rather than pretest measures were used as baseline indicators. Basal PNS and SNS activity were thus operationalized as the resting (posttest) RSA and PEP, respectively. PNS and SNS reactivity were operationalized as the residual of RSA/PEP during speech predicted by RSA/PEP during rest. PNS and SNS recovery were operationalized as the residual of RSA/PEP after speech predicted by RSA/PEP during speech. PEP variables were reverse scored so that higher scores indicated higher basal SNS activity (shorter PEP intervals), greater SNS reactivity (shorter residual PEP intervals during speech), and slower SNS recovery (i.e., shorter residual PEP intervals after speech).
Measures: Behavioral indicators of life history strategy at age 16
Effortful control
The effortful control measure was created from the parent-reported 11-item effortful control subscale (5-point scale: 1 = very false to 5 = very true; M = 3.00, SD = 0.67, α = 0.86) of the Revised Early Adolescent Temperament Questionnaire (Oldehinkel, Hartman, de Winter, Veenstra, & Ormel, Reference Oldehinkel, Hartman, de Winter, Veenstra and Ormel2004; Putnam, Ellis, & Rothbart, Reference Putnam, Ellis, Rothbart, Eliasz and Angleitner2001), and the self-reported 8-item self-discipline subscale (5-point scale: 1 = very false to 5 = very true; M = 3.23, SD = 0.60, α = 0.74) of the Neuroticism–Extraversion–Openness Personality Inventory (Costa & McCrae, Reference Costa and McCrae1992; Hoekstra, Ormel, & de Fruyt, 2003). The parent-reported effortful control subscale included questions about voluntary attentional control (“My child pays close attention when told how to do something”) and voluntary behavioral control (“My child starts right away with difficult assignments”). The self-reported self-discipline subscale included questions about voluntary behavioral control (“I have trouble making myself do what I should” reversed). The mean of the standardized parent-reported effortful control subscale and the standardized self-reported self-discipline subscale (r = .38; p < .001) was used as the measure for effortful control.
Aggressive/rule breaking
Aggressive/rule-breaking behaviors were assessed with the Dutch version of the Youth Self-Report (YSR; Achenbach, Reference Achenbach1991) and the parent-reported Child Behavior Checklist (CBCL; Achenbach & Rescorla, Reference Achenbach and Rescorla2001). The YSR and CBCL are commonly used questionnaires in child and adolescent research; their reliability and validity have been confirmed for the Dutch translation (Verhulst, van der Ende, & Koot, Reference Verhulst, van der Ende and Koot1997). Using a 3-point scale (0 = not at all, 2 = often), the 32-item externalizing measure consists of the highly correlated aggressive behavior and rule-breaking behavior syndrome scales (self-report; M = 0.34, SD = 0.23, α = 0.88), or 35 items (parent report; M = 0.18, SD = 0.20, α = 0.91). Two examples of statements are “Cruelty, bullying or meanness to others” and “Steals at home.” Parent and child-reports were log-transformed, and the standardized mean of these transformed variables (r = .42, p < .001) was used as the measure for aggressive/rule-breaking behavior.
Withdrawn/depressed
Withdrawn/depressed behavior was also assessed using the YSR and the CBCL (same 3-point scale as above). The eight-item withdrawn/depressed behavior subscale consists of statements such as “Withdrawn, doesn't get involved with others” and “There is little he/she enjoys” (self-report: M = 0.32, SD = 0.31, α = 0.75; parent report: M = 0.29, SD = 0.30, α = 0.75). Parent and child reports were log-transformed, and the standardized mean of these transformed variables (r = .37; p < .001) was used as the measure for withdrawn/depressed behavior.
Anxious/depressed
Anxious/depressed behavior was also assessed using the YSR and the CBCL (same 3-point scale as above). The anxious/depressed behavior scales consist of 13 items (self-report: M = 0.19, SD = 0.21, α = 0.77; parent report: M = 0.14, SD = 0.18, α = 0.78). Two sample statements are “Fears he/she might think or do something bad” and “Worries.” Parent and child reports were log-transformed, and the standardized mean of these transformed variables (r = .41, p < .001) was used as the measure for anxious/depressed behavior.
Measures: Familial and ecological conditions and life stress
Family environment
Both child and parent perceptions of parenting style were included in our parenting measure. All measures were taken during the first TRAILS measurement wave (age 11). Children completed the EMBU (a Swedish acronym for My Memories of Upbringing) for Children (Markus, Lindhout, Boer, Hoogendijk, & Arrindell, Reference Markus, Lindhout, Boer, Hoogendijk and Arrindell2003), which was developed to assess children's perception of parental rearing practices. Questions are asked about the father and the mother. Using a 4-point scale (1 = no, never, to 4 = yes, almost always), children completed the 17-item rejection scale (rating of father: M = 1.54, SD = 0.37, α = 0.85; rating of mother: M = 1.54, SD = 0.38, α = 0.88; correlation between mother and father ratings = 0.68), and the 18-item emotional warmth scale (rating of father: M = 3.10, SD = 0.57, α = 0.91; rating of mother: M = 3.22, SD = 0.51, α = 0.91; correlation between mother and father ratings = 0.79). The rejection scale is characterized by hostility, punishment, derogation, and blaming of the child. Emotional warmth refers to giving special attention, praising for approved behavior, unconditional love, and being supportive and affectionately demonstrative. Child perceptions of parental warmth and rejection (averaged across mothers and fathers) were moderately correlated (r = –.35, p < .001).
Parental perceptions of the family environment were assessed using the general functioning subscale of the McMaster Family Assessment Device (FAD; Epstein, Balswin, & Bishop, Reference Epstein, Balswin and Bishop1983) and the Parental Stress Index (PSI; Abidin, Reference Abidin1983). The 12-item general functioning subscale (4-point scale: 1 = strongly disagree to 4 = strongly agree; M = 1.81, SD = 0.35, α = 0.85) of the FAD included items such as “In time of crisis we can turn to each other for support” (reverse scored) and “There are lots of bad feelings in the family.” The 24-item PSI (6-point scale: 1 = strongly disagree to 6 = strongly agree; M = 2.00, SD = 0.87, α = 0.95) included items such as “It takes a long time for parents to develop close, warm feelings for their children.” Scores on the FAD and the PSI were correlated (r = .33, p < .001). The average of the two standardized child-reported and the two standardized parent-reported scales was used as the measure of family environment. Parent-reported and child-reported measures of parenting were modestly correlated (r = .25, p < .001). All scales contributing to this composite were coded so that higher scores indicated more warmth/support and less stress/rejection in the family environment.
Socioeconomic status (SES)
SES was assessed during the first measurement wave (age 11) based on parent reports. The assessment included income level (median income = between €2042 and €2495 per month; 16.8% of families had an income at or below the welfare level of €1135 per month); educational level of both parents (3.2% of mothers and 4.1% of fathers had only received elementary school education; 8.1% of mothers and 15.9% of fathers had a university degree); and occupational level of both parents (12.6% of mothers and 27.4% of fathers had a low occupation level, including craft and trade workers, plant and machine operators, and assemblers and other elementary occupations; 31.4% of mothers and 35.9% of fathers had a high occupation level, including legislators, senior officials, managers, and professionals; 15.7% of mothers and 0.9% of fathers never had any occupation). These five variables were standardized and combined into one scale (α = 0.84; Vollebergh et al., Reference Vollebergh, ten Have, Dekovic, Oosterwegel, Pels, Veenstra and Verhulst2005).
Prenatal and perinatal risk factors
Prenatal and perinatal risks were assessed during the first assessment wave (age 11) with the TRAILS Family History Interview. Following Buschgens et al. (Reference Buschgens, Swinkels, van Aken, Ormel, Verhulst and Buitelaar2009), the variable pregnancy and delivery adversities was created based on questions about maternal prenatal smoking, maternal prenatal alcohol use, birth weight, gestational age, and pregnancy and delivery complications. A sum score was calculated (M = 1.44, SD = 1.01) based on number of prenatal and perinatal risks.
Childhood stress
Childhood stress was assessed during the second measurement wave (age 13.5) based on parent and child ratings of the overall stressfulness of the child's life between the ages of 0 and 5 and 6 and 11, respectively. Parents were asked: “How stressful was your child's life in this life phase?” Adolescents were asked: “How many stressful events did you experience in this period?” Childhood stress could be rated on an 11-point scale, ranging from 0 = not at all to 10 = very much (child report 0–5 years: M = 1.65, SD = 1.87; child report 6–11 years: M = 2.54, SD = 2.43; parent report 0–5 years: M = 2.67, SD = 2.16; parent report 6–11 years: M = 3.44, SD = 2.15). The two parent- and two child-reported ratings were averaged (r = .17, p < .01) to get an indication of stress between ages 0 and 11. Previous research has shown that higher scores on this measure strongly increase the probability of onset of major depression in early adolescence (Oldehinkel, Ormel, Verhulst, & Nederhof, Reference Oldehinkel, Ormel, Verhulst and Nederhof2014).
Statistical analyses
To capture the complex multivariate distribution characterizing patterns of psychophysiological function, we employed LPA. LPA is a form of person-centered analyses that is used when researchers believe that a sample distribution may be composed of distinct groups of individuals (i.e., classes). In the present case, LPA should be regarded as a useful approximation. Although the ACM postulates a continuum of individual variation, nonlinear associations between continuous measures of environmental stress, physiological function, and behavior across multiple systems are much easier to capture in a typological model based on prototypical profiles. In particular, the classes identified by LPA can be used to test for complex relations between environmental context and physiology and between physiology and behavior, obviating the need for fitting high-order interactions to the data.
Results
Physiological reactivity to the GSST
As a manipulation check, we initially examined whether SRS parameters changed as expected in response to the GSST. Cortisol concentrations, F (2, 322) = 50.5, p < .001, RSA, F (2, 319) = 3.1, p = .05, and PEP, F (2, 280) = 170.7, p < .001, each changed significantly over the social stress test, indicating that the test provoked physiological reactions across the three SRS subsystems.
As shown in Table 2, there was a clear central tendency toward both increased HPA and SNS activation in response to the GSST (positive reactivity values), followed by reduced activation in recovery after the task (negative recovery values). For the HPA axis, average changes in cortisol over both the reactivity period and the recovery period (as indicated by raw difference scores shown in Table 2) were approximately 0.5 SD. Because HPA reactivity and HPA recovery scores are standardized residuals (Ms = 0), an HPA reactivity score of 1 is equivalent to about a 1.5 SD increase in cortisol from just before to just after the GSST (i.e., strong reactivity). Conversely, an HPA recovery score of 1 is equivalent to about a 0.5 SD increase in cortisol from just after the GSST to 40 min later (i.e., slow recovery). For the SNS, average changes in PEP over both the reactivity period and the recovery period (as shown by raw difference scores in Table 2) were approximately 1 SD. Given that SNS reactivity and SNS recovery scores are also standardized residuals (Ms = 0), an SNS reactivity score of 1 is equivalent to about a 2 SD reduction in PEP intervals from rest to speech (i.e., strong reactivity). Conversely, an SNS recovery score of 1 is approximately equivalent to no change in PEP intervals from speech to after speech (i.e., slow recovery).
Table 2. Means, standard deviations, correlations between, and residual variances for physiological variables

Note: HPA, Hypothalamus–pituitary–adrenal axis; PNS, parasympathetic nervous system; SNS, sympathetic nervous system. In the HPA reactivity and recovery, means and standard deviations of unstandardized differences scores are given; reactivity is the value directly after the end of the stress test minus the value just before the start of the stress test; recovery is the value 40 min after the stress test minus the value directly after the end of the stress test. In the PNS and SNS reactivity and recovery, means and standard deviations of unstandardized differences scores are given; reactivity is the value at speech minus the value at rest; recovery is the value after speech minus the value at speech. Preejection period was reversescored so that higher scores indicated higher basal SNS activity, stronger SNS reactivity, and slower SNS recovery.
Finally, as shown by the raw difference scores in Table 2, for the PNS, average changes in RSA over both the reactivity and the recovery periods were close to zero (≤0.05 SD), but showed wide variation in responsivity ranging from strong vagal augmentation to strong vagal withdrawal. Because PNS reactivity and PNS recovery scores are standardized residuals (Ms = 0), scores above zero can be interpreted as vagal augmentation (increasing RSA from rest to speech, or speech to after speech, with a score of 1 approximating a 1 SD increase) and scores below 0 can be interpreted as vagal withdrawal (decreasing RSA from rest to speech, or speech to after speech, with a score of –1 approximating a 1 SD decrease). Whereas vagal augmentation decelerates heart rate and reduces engagement with environmental demands (see El-Sheikh & Erath, Reference El-Sheikh and Erath2011), vagal withdrawal accelerates heart rate and, in the ACM, is conceptualized as an indicator of greater openness or susceptibility to environmental influence.
Correlations between physiological variables are reported in Table 2. Although indicators of basal activity, stress reactivity, and recovery were largely uncorrelated across SRS subsystems (PNS, SNS, and HPA), there was a significant positive correlation between HPA and SNS reactivity (r = .25, p < .001), showing coordination between these related subsystems. Further, within each SRS subsystem, higher SRS activation was associated with slower SRS recovery, as shown in the negative correlations between the reactivity and recovery measures in Table 2. These negative correlations are consistent with the assumption that both changes in SRS activity from baseline in response to a stressor and speed of SRS recovery after a stressor are indicators of stress responsivity. Finally, within each ANS subsystem, higher baseline activation was associated with less reactivity, as shown in the negative correlations between basal PNS and PNS reactivity and between basal SNS and SNS reactivity (Table 2).
Levels and range of variation in measures of familial and ecological conditions and life stress
To fully test for the ACM responsivity patterns, the study sample needs to encompass a wide range of psychosocial stress and support over development, ranging from low-stress, safe environments to severe, traumatic stress (Figure 1). Detailed descriptive information for the current measures of familial and ecological conditions and life stress is presented in the Methods section. Although TRAILS is not a high-SES sample (e.g., 16.8% of families had an income at or below the welfare level of €1135 per month; only 8.1% of mothers and 15.9% of fathers had a university degree), average levels of psychosocial stress were low (e.g., high mean levels of warmth/support and low mean levels of stress/rejection in the family environment; an average of only 1.44 prenatal and perinatal risks). Nonetheless, there was substantial variation in all measures, as indicated by standard deviations. In total, TRAILS has better coverage of the safe, stable end of the environmental spectrum than the dangerous, traumatic end. TRAILS should be well positioned to address questions regarding the effects of low-stress environments on the development of stress responsivity and life history strategy. At the same time, TRAILS also has enough variation in psychosocial environmental factors to address development under higher stress conditions, but it is not well positioned to investigate development under conditions of severe, traumatic stress.
LPA
All variables were standardized into z scores before entering the analyses. Responsivity profiles were created using LPA in Mplus 5 (http://www.statmodel.com), where missing data are handled using full information maximum likelihood estimation. We used MPlus default settings, apart from increasing the number of initial stage random starts (100), final stage random starts (10), and initial stage iterations (20). We used the basal activity, reactivity, and recovery measures of HPA, SNS, and PNS functioning as profile indicators, giving them primacy in defining the profiles. Basal activity scores were entered as z scores and reactivity and recovery scores were entered as standardized residuals. Models were compared using the Akaike information criterion (AIC), the Bayesian information criterion (BIC), entropy, and the adjusted Lo–Mendell–Rubin likelihood ratio test (LMR-LRT). Lower AIC and BIC indicate better fit. Entropy closer to one is an indicator of higher accuracy with which participants are assigned to profiles. Significant LMR-LRT indicates that a model with K profiles fits the data significantly better compared to a model with K–1 profiles.
As stated by Marsh, Lüdtke, Trautwein, and Morin (Reference Marsh, Lüdtke, Trautwein and Morin2009, p. 194),
Although there is diverse opinion on how to choose the correct number of groups [in LPA], it is useful to explore solutions with varying numbers of groups and to select one that makes most sense in relation to theory, previous research, the nature of the groups, and interpretation of the results—as well as alternative goodness-of-fit indexes and tests of statistical significance.
Accordingly, we based our final choice regarding number of groups on the fit indices in combination with theoretical consistency and interpretability of results.
As is often the case with LPA (e.g., Flaharty & Kiff, 2012), the different fit indices were ambiguous regarding the best fitting model. The AIC and the BIC continued decreasing up to a model with six profiles, whereas the LMR-LRT suggested that a three-profile model best fit the data (Table 3). Entropy was quite stable over the different solutions. Visual inspection of the various solutions indicated that the model with four profiles included one distinct, additional profile compared to the three-profile solution that was interpretable within the ACM. The five-profile solution, however, did not include a distinct, additional profile but rather an extra “severity” profile (a profile that had the same shape as one of the profiles in the four-profile solution, but with more extreme scores). This additional profile included only 1.2% of the participants, whereas the four-profile solution distributed at least 6% of participants into each group. Thus, although AIC and BIC supported as many as six profiles, four profiles was the maximum number in which all groups were adequately populated. Taken together, the fit indices were neither consistent nor particularly useful in determining a precise number of profiles, but potentially supported either a three- or four-profile solution. Given the four-pattern structure specified by the ACM, we retained the four-profile model to describe our data (Figure 2). This decision concurs with the widely held view in the LPA literature that substantive as well as statistical considerations should guide decisions regarding the number of profiles to retain in the final model (e.g., Flaherty & Kiff, Reference Flaherty, Kiff and Cooper2012; Marsh et al., Reference Marsh, Lüdtke, Trautwein and Morin2009; Muthen, Reference Muthen2003). The average probability of profile membership in the four-profile model was uniformly high: .95 for Profile 1 (later called sensitive), .97 for Profile 2 (later called buffered), .94 for Profile 3 (later called vigilant), and .94 for Profile 4 (later called unemotional), which implies good discrimination among the classes.
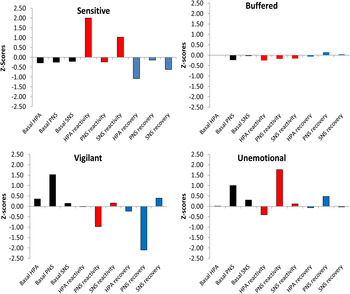
Figure 2. (Color online) Latent profile analysis solution for the four-class conceptualization of stress responsivity. SNS, Sympathetic nervous system; PNS, parasympathetic nervous system; HPA, hypothalamus–pituitary–adrenal axis. Preejection was reverse scored so that higher scores indicated higher basal SNS activity, stronger SNS reactivity, and slower SNS recovery.
Table 3. Model fit criteria for one- to six-class models

Note: N = 351. AIC, Akaike information criterion; BIC, Bayesian information criterion; LMR, Lo–Mendell–Rubin; LRT, likelihood ratio test.
The residual variances (i.e., the amount of variance in each physiological indicator that was not explained by profile membership) are shown in Table 2. These residual variances indicate that profile membership accounted for most of the variation in HPA reactivity, PNS reactivity, HPA recovery, and PNS recovery. Further, profile membership accounted for moderate amounts of variance in SNS reactivity and basal PNS. By contrast, profile membership accounted for only small amounts of variances in basal HPA, basal SNS, and SNS recovery. In total, the various measures of reactivity and recovery were most successful in differentiating between profiles (i.e., they had the largest range of means across the profiles, as shown graphically in Figure 2).
After a decision for the best model was made based on the physiological variables, we ran a model that included the behavioral indicators of life history strategy (effortful control, aggressive/rule-breaking, anxious/depressed and withdrawn/depressed behaviors) as covariates. The loadings of these covariates on the four profiles are shown in Figure 3. Next we ran a model that included the indicators of familial and ecological conditions and life stress (family environment, SES, prenatal and perinatal risk factors, and childhood stress) as covariates. The loadings of these covariates on the profiles are shown in Figure 4.

Figure 3. Latent profile analysis solution for the four-class conceptualization of stress responsivity with behavioral indicators of life history strategy as covariates.

Figure 4. Latent profile analysis solution for the four-class conceptualization of stress responsivity with indicators of familial and ecological conditions and life stress as covariates.
Description of the four-class LPA model
As discussed by Lubke and Muthén (Reference Lubke and Muthén2007), inclusion of covariates can improve parameter coverage and classification accuracy. In Mplus 5, profile indicators are tested for statistical significance against the mean (0 in the present case because we used all standardized variables) in linear regression models, and covariates are tested for statistical significance against each other (with one profile serving as the reference group) in multinomial logistic regressions (to predict participants' latent profile membership). We initially used Profile 2 (later called buffered) as the reference group because all values were close to zero. However, because Profile 2 contained 74% of the participants, all of the other profiles were relatively small (6%–10% of participants); thus, when comparing the mean values of covariates for any of these smaller profiles with the mean values for Profile 2 (which essentially represents the sample mean), large effects would be required to attain statistically significant differences. However, no comparisons were statistically significant when Profile 2 was used as the reference group. We instead used Profile 4 (later called unemotional) as the reference group, as it was expected to have the most extreme scores in terms of environmental conditions and life history strategy. When the data analytic goal is to compare the magnitude of responses across groups, the use of an extreme comparison group is recommended (van Ryzin, Chatham, Kryzer, Kertes, & Gunnar, Reference van Ryzin, Chatham, Kryzer, Kertes and Gunnar2009).
After having identified four classes of individuals, we set out to describe the indices of biological (re)activity, the behavioral indicators of life history strategy, and the measures of familial and ecological conditions and life stress that were associated with each class and to evaluate differences between classes on these variables. The mean values of each variable within each class are shown in Figures 2–4, with 0 indicating the sample mean for each variable across classes. For the profile indicators (i.e., the stress physiology variables), the Bs reported below can be understood as regression parameters for the intercept and, therefore, as estimates of the mean for a given variable within each profile (shown in Figure 2). For the covariates (which include the behavioral indicators of life history strategy and the measures of familial and ecological conditions and life stress), the B values reported below do not have such a clear intuitive meaning; they are best interpreted in terms of their odds ratios, which indicate the extent to which a 1 SD increase in a covariate results in a higher (or lower) probability that a person belongs to the target class versus the reference class.
Class 1: Sensitive
The first class (10%; n = 33) was labeled sensitive for its similarity with Pattern I of the ACM. As shown in Figure 2, this profile was characterized by significantly higher than average HPA reactivity (i.e., very high residual cortisol levels at the end of the GSST; B = 2.00, SE = 0.31, p < .001) and higher than average SNS reactivity (i.e., shortened residual PEP intervals during speech; B = 1.02, SE = 0.21, p < .001). Consistent with the pattern of heightened stress responsivity, PNS reactivity showed a pattern of vagal withdrawal (i.e., lower than average RSA residual scores during speech; B = –0.23, SE = 0.07, p = .001). This heightened multisystem reactivity was then followed by strong recovery, as indicated by faster than average HPA recovery (i.e., relatively low levels of residual cortisol at the end of the assessment protocol; B = –1.08, SE = 0.16, p < .001) and faster than average SNS recovery (i.e., longer residual PEP intervals after speech; B = –0.62, SE = 0.26, p < .05).
As shown in Figures 3 and 4, higher scores on the aggregate measures of quality of family environment (B = 0.95, SE = 0.417, p < .05; odds ratio [OR] = 2.57) and on withdrawn/depressed behavior (B = 0.78, SE = 0.39, p < .05; OR = 2.18) significantly increased the probability of belonging to the sensitive (vs. unemotional) profile. In contrast, higher scores on aggressive/rule-breaking behavior (B = –0.57, SE = 0.27, p < .05; OR = 0.57) significantly reduced the probability of belonging to the sensitive (vs. unemotional) profile. In total, the sensitive profile was characterized by a developmental history of relatively high warmth/support and low stress/rejection in the family environment, heighted stress responsivity across all three SRS subsystems, fast SRS recovery, low scores on the main indicator of fast life history strategy (aggressive/rule-breaking behavior), and high scores on withdrawn/depressed behavior.
Class 2: Buffered
The second class (74%; n = 251) was labeled the buffered for its similarity with Pattern II of the ACM. This profile was characterized by scores closest to the overall group mean; that is, 0 on essentially all indicators (Figure 2). In other words, the buffered profile was characterized by moderate basal arousal, reactivity, and recovery across all three SRS subsystems, as well as average levels of aggressive/rule-breaking behavior, withdrawn/depressed behavior, anxious/depressed behavior, and effortful control (Figure 3). As would be expected, the buffered profile was also characterized by scores that are close to the overall mean on all measures of familial and ecological conditions and life stress (Figure 4). There were no statistically significant differences between the buffered profile and the reference group.
Class 3: Vigilant
The third class (6%; n = 20) was named vigilant for its similarity with Pattern III of the ACM. This profile was characterized by significantly higher than average basal PNS activity (i.e., high RSA values at rest; B = 1.53, SE = 0.15, p < .001). Reactivity and recovery of the PNS were also significantly different from zero. Both PNS reactivity (i.e., residual RSA values during speech; B = –0.97, SE = 0.28, p = .001) and PNS recovery (i.e., residual RSA values after speech; B = –2.10, SE = 0.32, p < .001) were below the mean, indicating two increasing phases of vagal withdrawal (i.e., significantly reduced residual RSA levels), with heart rate variability first going down during speech and then again further after speech.
Scores on withdrawn/depressed behaviors for the vigilant class were the highest of all profiles (Figure 3). Higher scores on withdrawn/depressed behavior (B = 0.98, SE = 0.46, p < .05; OR = 2.66) significantly increased the probability of belonging to the vigilant (vs. unemotional) profile. Although Figure 4 suggests that high scores on prenatal and perinatal risk factors and childhood stress make membership in the vigilant class more likely, these measures did not significantly predict membership in this profile. Because the comparison group (unemotional) was also elevated on prenatal and perinatal risk factors and childhood stress, contrasts between the vigilant and unemotional profiles were not likely to produce statistically significant differences on these measures.
Class 4: Unemotional
The fourth class (10%; n = 33) was named unemotional for its similarity with Pattern IV of the ACM. This profile was characterized by higher than average basal PNS activity (i.e., high RSA at rest; B = 0.99, SE = 0.16, p < .001), indicating elevated vagal tone. Reactivity and recovery of the PNS were also significantly different from zero. Both PNS reactivity (i.e., residual RSA levels during speech; B = 1.77, SE = 0.21, p < .001) and PNS recovery (i.e., residual RSA levels after speech; B = 0.48, SE = 0.17, p < .01) were above the mean, indicating two increasing phases of vagal augmentation (i.e., significantly increased residual RSA levels), with heart rate variability first increasing during speech and then again further after speech. Increasing RSA from baseline decelerates heart rate, reduces engagement with environmental demands (El-Sheikh & Erath, Reference El-Sheikh and Erath2011), and is a marker of low biological sensitivity to context (Obradović, Bush, Stamperdahl, Adler, & Boyce, Reference Obradović, Bush, Stamperdahl, Adler and Boyce2010). In addition, HPA axis reactivity was significantly below average (i.e., relatively low residual cortisol levels at the end of the GSST; B = –0.41, SE = 0.11, p < .001), indicating hyporesponsivity.
The unemotional profile was the reference group for testing significance of the covariates (behavioral indicators of life history strategy and familial and ecological conditions and life stress). Therefore, test statistics are not available for this profile. As reported in the statistical analyses above, compared with the sensitive profile, membership of the unemotional profile was predicted by low scores on quality of family environment, low scores on withdrawn/depressed behavior, and high scores on aggressive/rule-breaking behavior. Likewise, compared with the vigilant profile, membership of the unemotional profile was again predicted by low scores on withdrawn/depressed behavior. Although not statistically significant in relation to other profiles, membership in this profile was also more likely for adolescents who were low in effortful control, who came from low-SES backgrounds, who had relatively high levels of prenatal and perinatal risk factors, and who were high on childhood stress (Figure 3 and Figure 4).
Post hoc analyses
In the covariate analyses described above, we used composite measures that combined parent and child reports of the behavioral indicators of life history strategy (effortful control, aggressive/rule-breaking, anxious/depressed, and withdrawn/depressed behaviors) and two of the indicators of familial and ecological conditions and life stress (family environment and childhood stress), whereas the assessments of SES and prenatal/perinatal risk factors were based solely on parent reports. This is potentially problematic because, as is typical in developmental family research, parent and child reports were only moderately correlated, making it challenging to interpret the combined scores. Thus, post hoc, we (a) ran two models that included the child-reported and parent-reported behavioral indicators of life history strategy separately, and (b) ran two models that included the child-reported and parent-reported indicators of the family environment and childhood stress separately (with parent-reported SES and prenatal/perinatal risk factors included in both of these latter analyses). As in the primary covariate analyses, the unemotional profile served as the comparison group. When separating out these parent and child reports, the only notable difference was that higher scores on parent-reported childhood stress (B = –0.57, SE = 0.34, p = .09; OR = 0.57) reduced the probability of belonging to the sensitive (vs. unemotional) profile. The odds ratio indicated that a 1 SD increase in parent-reported childhood stress reduced the odds of membership in the sensitive profile by nearly 50% (though this effect only achieved marginal statistical significance). By contrast, higher scores on child-reported childhood stress (B = 0.27, SE = 0.25, p = .29; OR = 1.31) slightly increased the probability of belonging to the sensitive (vs. unemotional) profile; however, this effect did not approach statistical significance.
In total, post hoc analyses including child-reported and parent-reported behavioral indicators of life history strategy separately, and analyses including child-reported and parent-reported indicators of the family environment and childhood stress separately, yielded very similar results as were described above. The only notable difference was that higher parent-reported childhood stress reduced the probability of membership in the sensitive profile.
Discussion
In this article, we used a longitudinal data set with a diverse community sample of Dutch adolescents (11–16 years old) to test several predictions from the ACM of stress responsivity (Del Giudice et al., Reference Del Giudice, Ellis and Shirtcliff2011). The results both lend initial support to the model and raise important issues and questions, opening the way to further investigations and more fine-grained empirical studies. Despite the limitations of the present study (see Limitations section), the current results provided measured support for the basic four-pattern classification of the ACM. These results suggest that the ACM may provide a useful framework for organizing research on stress responsivity in relation to both environmental antecedents and behavioral outcomes.
The LPA was able to identify four classes of adrenocortical and autonomic nervous system activity indexed by cortisol, RSA, and PEP during resting conditions, in response to a stressful task, and at recovery. The four classes could be reasonably mapped on the four responsivity patterns described in the ACM, though with various caveats described below. The four patterns were associated with our antecedent measures of familial and ecological conditions and life stress (especially quality of family environments) and were differentially associated with aggressive/rule-breaking behavior and depressed/withdrawn behavior.
Most participants in our study fit the buffered responsivity pattern, displaying about average levels of psychosocial stress, stress responsivity, and behavioral indicators of life history strategy. The ACM predicts that this normative, buffered pattern (without either hyper- or hyporesponsivity) will emerge among most children developing in normative environments that are not characterized by extremes of either nurturance and support or adversity and trauma. The LPA placed about three-quarters of the participants into the buffered profile (74%) and distributed the remaining one-quarter among the other three profiles (6%–10%); this may reflect the current statistical approach, including use of standardized variables with normal distributions, and software that, by default, tends to produce a large group of “average on everything” (see also Quas et al., Reference Quas, Yim, Oberlander, Nordstokke, Essex, Armstrong and Boyce2014). This raises the question of whether researchers working with nonclinical samples will have adequate power to capture the smaller profiles. This may depend on the level of risk, or range of risk, in a given sample. TRAILS is a relatively low-risk sample. In contrast, the US sample studied by Quas et al. (Reference Quas, Yim, Oberlander, Nordstokke, Essex, Armstrong and Boyce2014; the Peers and Wellness Study) had more diverse sociodemographic and ethnic characteristics than TRAILS. Their LPA resulted in a buffered group with 52% of the participants. Finally, the at-risk US sample studied by Del Giudice et al. (Reference Del Giudice, Hinnant, Ellis and El-Sheikh2012) had a buffered group with only 45% of the participants.
Consistent with the ACM, the LPA revealed two patterns of high stress responsivity in the context of the GSST. One profile (labeled sensitive) exhibited heightened multisystem reactivity across PNS, SNS, and HPA axis parameters in response to the GSST followed by fast recovery of both the SNS and HPA axis after the GSST. The other profile (vigilant) exhibited PNS-specific reactivity, with strong vagal withdrawal; that is, heart rate variability first substantially decreased during speech and then decreased further after the speech. Thus, in the case of the vigilant responsivity pattern, there was strong vagal withdrawal to the social–evaluative threat (speech) without the normal or expected recovery of parasympathetic tone after the speech. According to Koolhaas et al. (Reference Koolhaas, Bartolomucci, Buwalda, de Boer, Flügge, Korte and Fuchs2011, p. 1293), “a stressor can be distinguished from a normal controllable situation by the recovery of the physiological response rather than the magnitude of the response.” By this conceptualization, the vigilant profile demonstrated a strong physiological stress response to the GSST.
The two patterns of high stress responsivity (sensitive and vigilant) replicate the results of Quas et al. (Reference Quas, Yim, Oberlander, Nordstokke, Essex, Armstrong and Boyce2014), who also conducted LPA of PNS, SNS, and HPA axis measures. Whereas Quas et al. (Reference Quas, Yim, Oberlander, Nordstokke, Essex, Armstrong and Boyce2014) documented these two patterns (multisystem reactivity and PNS-specific reactivity) across multiple studies of children in middle to late childhood (ages 5–12 years), the current research extended these results by documenting these two patterns in adolescents (age 16 years) and incorporating recovery measures.
In support of the ACM, the two high-responsivity patterns (sensitive and vigilant) differed in their developmental histories in relation to familial and ecological stress. Whereas the sensitive responsivity pattern was characterized by significantly elevated scores on quality of family environment (where higher scores indicated more warmth/support and less stress/rejection in the family environment) and low scores on childhood stress (though only on the basis of parent reports and not child reports), the vigilant responsivity pattern was characterized by the highest levels of prenatal/perinatal risk factors and childhood stress.Footnote 4 Thus, as specified by the original theory of biological sensitivity to context (Boyce & Ellis, Reference Boyce and Ellis2005; Ellis et al., Reference Ellis, Essex and Boyce2005) and further elaborated by the ACM, high responsivity emerged under both relatively low and high levels of psychosocial stress. Consistent with ACM, the sensitive pattern specifically displayed heightened multisystem reactivity across all three SRS subsystems. By contrast, the vigilant profile was PNS dominated, which was not predicted by the ACM (see further discussion below).
In articulating the ACM responsivity patterns, Del Giudice et al. (Reference Del Giudice, Ellis and Shirtcliff2011, p. 1578) state: “In very safe and protected settings, sensitive individuals will rarely experience strong, sustained activation of the SNS and HPA systems; thus, the individual enjoys the benefits of responsivity without paying significant health costs (e.g., immune, energetic).” In the current research, the strong recovery of the SNS and HPA axis in sensitive individuals following stress exposure, together with a developmental history of warm–supportive family relationships, concurs with this hypothesis.
To further understand the profiles, behavioral indicators of life history strategies were included as covariates in the model. According to the ACM, heightened stress responsivity interacts with positive, supportive developmental environments to produce relatively slow life history strategies (e.g., relatively low levels of risky and aggressive behavior, an orientation toward longer term investments and outcomes), as per the sensitive pattern. Conversely, interactions between high responsivity and risky, threatening developmental environments result in faster life history strategies characterized by greater vigilance, wariness, and reactive aggression, as per the vigilant pattern. In the current research, the vigilant responsivity pattern was characterized by the highest levels of depressed/withdrawn behavior and was also moderately (though not significantly) elevated on aggressive/rule-breaking behavior. This combination converges with the vigilant–agonistic/withdrawn pattern specified by the ACM, where high responsivity is paired with comorbid internalizing and externalizing behaviors. By contrast, the sensitive pattern was characterized by the lowest levels of aggressive/rule-breaking behavior together with moderately elevated levels of depressed/withdrawn behavior. The divergence between sensitive and vigilant profiles on aggressive/rule-breaking behavior suggests that the sensitive pattern was linked to a slower life history strategy and the vigilant pattern to a faster life history strategy, as specified by the ACM. However, the direct measure of a slow life history strategy—effortful control—was not associated with either profile. This challenges the notion that sensitive phenotypes are associated with enhanced self-regulation and behavioral control. Future research will need to carefully consider behavioral patterns characteristic of the sensitive profile.
Although the current research converges with Quas et al. (Reference Quas, Yim, Oberlander, Nordstokke, Essex, Armstrong and Boyce2014) in documenting a pattern of high multisystem reactivity, we found that multisystem reactivity (the sensitive profile) was associated with a high-quality family environment. By contrast, Quas et al. (Reference Quas, Yim, Oberlander, Nordstokke, Essex, Armstrong and Boyce2014) found that multisystem reactivity was associated with high family adversity and, employing the terminology of the ACM, described this pattern as vigilant. The reasons for this contrasting result are not clear; however, there are many notable differences between the two studies. The results of Quas et al. (Reference Quas, Yim, Oberlander, Nordstokke, Essex, Armstrong and Boyce2014) were derived from 5-year-olds (compared with our 16-year-olds); were based on cross-sectional data (whereas our family environment measures preceded the assessment of stress physiology by 5 years); were based on more distal measures of family stress such as marital quality, financial stress, and parental psychopathology (whereas our measures focused on more proximal parent-child processes); did not incorporate recovery measures; and did not include indicators of life history strategy to further define the profiles. The substantial reorganization of neurobiological stress responses at puberty (Dahl & Gunnar, Reference Dahl and Gunnar2009; Forbes & Dahl, Reference Forbes and Dahl2010) may be especially relevant to explaining these divergent results. In any case, future research is needed to resolve the issue of multisystem reactivity in sensitive versus vigilant profiles. The ACM itself is ambivalent on this issue (see Table 1).
Although both the sensitive and the vigilant patterns were characterized by higher than average vagal withdrawal and withdrawn/depressed behavior, the vigilant profile was more extreme on both of these variables. This concurs with past theory and research suggesting that, while moderate vagal withdrawal in response to environmental demands (as found in the sensitive profile) may reflect optimal engagement with the environment, strong vagal withdrawal may reflect emotional lability (Beauchaine, Reference Beauchaine2001). The centrality of vagal withdrawal and internalizing problems to the vigilant profile is consistent with the emphasis of polyvagal theory on the role of the PNS in regulation of emotion (Porges, Doussard-Roosevelt, & Maiti, Reference Porges, Doussard-Roosevelt and Maiti1994) and the proposal that strong vagal withdrawal “promotes a physiological state related to emotion dysregulation, hypervigilance, and internalizing symptoms in which high levels of anxiety are a core characteristic” (Hinnant & El-Sheikh, Reference Hinnant and El-Sheikh2013, p. 421). In total, extant theory and the current data suggest that different levels of PNS reactivity may need to be more carefully distinguished in future descriptions of the ACM vigilant pattern, which in the original theory emphasized SNS and HPA reactivity.
Finally, although the ACM predicted low basal PNS activity in the vigilant profile, we found high basal PNS activity. In general, the literature on basal PNS activity and depression is highly conflicted (for a meta-analysis, see Rottenberg, Reference Rottenberg2007), as is the literature on basal PNS activity and emotion regulation or competence in children (reviewed in Conradt et al., Reference Conradt, Abar, Sheinkopf, Lester, Lagasse, Seifer and Hinckley2014). In the current study, the pattern of high basal PNS activity followed by strong vagal withdrawal that characterized the vigilant profile conformed to the law of initial values (Benjamin, Reference Benjamin1963) which states that higher starting values on physiological measures have greater capacity for decreases, a phenomenon that has been documented in past PNS research (Beauchaine, Reference Beauchaine2001).
Consistent with the ACM, the LPA resulted in two responsivity patterns that were characterized by relatively high levels of stress and faster life history strategies, with opposing patterns of stress responsivity. One of these profiles was characterized by high stress responsivity (the vigilant pattern) and the other by low responsivity (the unemotional pattern); both were PNS dominated. This distinction between the vigilant and the unemotional patterns underscores the importance of assessing baseline, reactivity, and recovery measures of stress responsivity. These two profiles displayed similar parasympathetic tone at baseline; contrasting PNS activation/deactivation only occurred under stress and in recovery. Specifically, in contrast to the vigilant profile, the unemotional profile was characterized by vagal augmentation; that is, heart rate variability first increased substantially during speech and then further after the speech. Vagal augmentation is specified by the ACM as a component of the hyporesponsive unemotional pattern. Note that, in the ACM, low responsivity does not mean that SRS parameters do not change from baseline in response to environmental challenges. Rather, low responsivity means that these parameters either change in a way that reduces engagement with environmental demands and diminishes biological sensitivity to context (as in the case of vagal augmentation; see El-Sheikh & Erath, Reference El-Sheikh and Erath2011; Obradović et al., Reference Obradović, Bush, Stamperdahl, Adler and Boyce2010) or change relatively little (as in low HPA axis reactivity). Both of these factors, vagal augmentation and low HPA axis reactivity, characterized the unemotional profile.
The unemotional profile was clearly linked to a fast life history strategy (highest scores on aggressive/rule-breaking behavior; lowest scores on effortful control) and to low scores on withdrawn/depressed behavior. In addition, membership in this profile was predicted by the low scores on quality of family environment and was associated with elevated scores on all of the childhood adversity measures (e.g., low SES). The contrast between the PNS-dominated vigilant and unemotional profiles converges with past developmental research showing that a pattern of strong vagal withdrawal in response to social or cognitive challenges (as in the current vigilant responsivity pattern) is associated with internalizing symptoms or co-occurring internalizing–externalizing behavior problems, whereas weak vagal withdrawal or vagal augmentation (as in the current unemotional responsivity pattern) is associated with externalizing behavior problems (Boyce et al., Reference Boyce, Quas, Alkon, Smider, Essex and Kupfer2001; Calkins, Graziano, & Keane, Reference Calkins, Graziano and Keane2007; Calkins & Keane, Reference Calkins and Keane2004; El-Sheikh, Hinnant, & Erath, Reference El-Sheikh, Hinnant and Erath2011; Gazelle & Druhen, Reference Gazelle and Druhen2009; Hinnant & El-Sheikh, Reference Hinnant and El-Sheikh2009).
These relations are complex, however, and not always consistent, particularly when comparing clinical and normative samples (see Zisner & Beauchaine, Reference Zisner, Beauchaine and Cicchetti2016). For example, Hinnant and El-Sheikh (Reference Hinnant and El-Sheikh2013) found that vagal augmentation in boys was associated with co-occurring high internalizing and high externalizing trajectories across middle to late childhood, and Pang and Beauchaine (Reference Pang and Beauchaine2013) documented excessive vagal withdrawal specifically in response to an emotionally evocative video in 8- to 12-year-old children who were extremely high in conduct problems. In the ACM, both vigilant and unemotional patterns are associated with higher rates of externalizing behavior, but they reflect different patterns of SRS activity. In the current research, the linkages between vagal augmentation, low cortisol reactivity, low withdrawn/depressed behavior, and high aggressive/rule-breaking behavior are consistent with the ACM conceptualization of unemotional phenotypes as generally unresponsive to social feedback and evaluation.
To our knowledge, the current research is the first to integrate all three major SRS subsystems (PNS, SNS, and HPA) across all three phases of activation (baseline, reactivity, and recovery) in a single analysis. Further, this analysis was guided by strong theory and included both behavioral indicators of life history strategy and antecedent measures of familial and ecological conditions and life stress. Extant research on SRS functioning often studies each subsystem separately, empirically isolates different phases of SRS activation, focuses on individual environmental antecedents or behavioral outcomes, and employs inductive theory building. The result has been more fragmentation than a coherent body of knowledge. The ACM attempts to overcome these limitations through its integrative, multisystem, multiphasic approach rooted in life history theory.
Limitations
Limitations of the present study should be noted because they provide important directions for future research. These limitations should be kept in mind when interpreting the current results, especially in view of the complexity of the model we set out to evaluate.
The TRAILS sample itself affords both notable strengths and weaknesses for evaluating the ACM. The strength is that TRAILS involves a large, representative, community sample, with 351 adolescent males who completed the GSST. However, the existence of different responsivity patterns at different frequencies in the population raises challenges concerning sample size. If a given pattern is comparatively rare (e.g., the vigilant pattern in the present study) or expected to emerge under conditions of severe stress (i.e., the unemotional pattern), then large and diverse samples are required to permit accurate estimates of their characteristics. The current sample was large (particularly given the stress physiology assessment) but not highly diverse in terms of psychosocial stress. Because the lower end of psychosocial stress is well represented in the TRAILS sample, the study was well positioned to test for the sensitive responsivity pattern, which we found good support for overall. Specifically, a pattern of multisystem responsivity to the GSST, with high reactivity followed by fast recovery (as per the ACM description of the sensitive profile), emerged under relatively supportive environmental conditions (i.e., higher quality family environments and lower parent-reported childhood stress) and was associated with a key indicator of a slow LH strategy (i.e., low aggressive/rule-breaking behavior).
By contrast, restriction of range in the TRAILS sample on the stressful, traumatic end of childhood conditions may have limited our ability to adequately capture the unemotional pattern (in terms of the high-stress developmental pathway to this phenotype). Accordingly, observed associations between unemotional responsivity and low-quality family environments could reflect gene–environment correlations (rather than calibration to the environment). Future research is needed to determine the extent to which the male responsivity patterns documented in the current research actually reflect environmental influences and generalize to higher risk samples. Further, consistent with the restriction of range at the stressful, traumatic end of childhood conditions, the sample means on both internalizing and externalizing behavior problems were quite low, thus limiting our ability to predict these outcomes.
Another limitation of the current study is that stress physiology was only assessed at one time point, in response to a single protocol, in a laboratory setting. Although the Trier Social Stress Test is the current gold standard for evoking multisystem stress reactivity, and was successful in activating sympathetic, parasympathetic, and adrenocortical responses in the current study, these responses still reflect a singular, contrived context. It would be valuable in future tests of the ACM to also assess stress responsivity in more natural contexts, over multiple occasions, using methods such as ecological momentary assessment.
Finally, the current analyses did not evaluate the role of genetic factors in producing the observed associations between stress responsivity, behavioral indicators of life history strategy, and antecedent measures of familial and ecological conditions and life stress. In the ACM, genetic variation and environmental inputs interact to determine the development of responsivity patterns; in addition, different pathways may involve a different causal balance of genetic and environmental factors (see Del Giudice et al., Reference Del Giudice, Ellis and Shirtcliff2011). Although the present results are consistent with the hypothesis that adolescents' patterns of stress responsivity reflect conditional adaptations to their developmental context, further genetically sophisticated studies (and molecular genetic analyses in TRAILS) are needed to detail the gene–environment interplay involved in the calibration of the SRS.
Conclusion
Theoretical models are useful insofar as they explain known facts and make novel, testable predictions. The ACM is a complex model, and it can be used to derive dozens of predictions at different levels of analysis, including hypotheses about the relationship between childhood stress and stress responsivity, stress responsivity and behavior, individual differences in neuromodulation, Gene × Environment interactions, sex differences in life history strategies, and responses to domain-specific stressors (such as agonistic confrontations). Clearly, no single study can address all of these predictions, and multiple studies will be required even to evaluate the more basic ones. The present investigation provided an initial empirical test of the four responsivity patterns of the ACM. We found measured support for these patterns by documenting complex, nonlinear relations between (a) childhood indices of familial and ecological conditions and life stress, (b) multisystem/multiphasic patterns of stress responsivity in adolescence, and (c) behavioral indicators of life history strategy in adolescence. The ACM proved to be a useful tool in predicting and explaining these relations, helping us move toward a more coherent “big picture” of the biosocial processes involved in developmental adaptation to the environment. At the same time, there were limitations of the current study, and deviations of the findings from the predicted model, that highlight important methodological challenges and empirical questions for future research.


