1. INTRODUCTION
Collision and grounding accidents account for approximately 85% of maritime accidents, which are defined as navigational accidents (Wróbel et al., Reference Wróbel, Montewka and Kujala2017; Erol et al., Reference Erol, Demir, Çetişli and Eyüboģlu2018). Consequence estimation for navigational accidents is essential in the risk domain (Baniela and Ríos, Reference Baniela and Ríos2011). As defined by Kaplan (Reference Kaplan1997), risk is a combination of likelihood and consequence in different scenarios. This opinion is widely accepted (Mazaheri et al., Reference Mazaheri, Montewka and Kujala2014) and adopted in the well-known formal safety assessment framework (Wang, Reference Wang2001); risk mitigation should be carried out by decreasing the likelihood or reducing the consequences in the risk control option step (Zhang et al., Reference Zhang, Teixeira, Guedes Soares, Yan and Liu2016a,Reference Zhang, Yan, Zhang, Yang and Wang2016b; Wang et al., Reference Wang, Zio, Wei, Zhang and Wu2019). Moreover, from the viewpoint of emergency management (Jasionowski, Reference Jasionowski2011; Xiong et al., Reference Xiong, Long, Tang, Wan and Li2015), if the consequences can be predicted, the response actions will be easy to perform in restricted conditions (Wu et al., Reference Wu, Zong, Yan and Guedes Soares2018).
The Bayesian network (BN) is widely used for quantitative risk assessment (Zhang et al., Reference Zhang, Teixeira, Guedes Soares, Yan and Liu2016a,Reference Zhang, Yan, Zhang, Yang and Wang2016b), especially for consequence estimation (Zhang et al., Reference Zhang, Yan, Yang, Wall and Wang2013,Reference Zhang, Teixeira, Guedes Soares, Yan and Liu2016a,Reference Zhang, Yan, Zhang, Yang and Wang2016b) in maritime transportation because of the intuitive graphical structure and quantitative presentation of the relationships among influencing factors. In practice, when introducing BNs, the historical data should be collated to develop the quantitative component (Zhang et al., Reference Zhang, Teixeira, Guedes Soares, Yan and Liu2016a,Reference Zhang, Yan, Zhang, Yang and Wang2016b).
Another significant aspect of BNs is the qualitative component, which, in reality, always relies on expert judgements (Wu et al., Reference Wu, Yan, Yip and Wang2017b). To reduce the time required to procure expert judgements, mutual information, which was first proposed by Shannon and Weaver (Reference Shannon and Weaver1949), is suggested in this paper. The principle of mutual information (Li et al., Reference Li, Xie and Goh2009) is that it can be used as an indicator of the mutual dependence of two factors (e.g. gross tonnage and time of day). A BN based on mutual information analyses the mutual dependence or independence among pairs of factors (Nicholson and Jitnah, Reference Nicholson and Jitnah1998). A BN will then be constructed with minimum biases. This method has recently been applied for the rational implementation of port state control inspections (Yang et al., Reference Yang, Yang and Yin2018).
Note that when introducing the mutual information-based BN (Yang et al., Reference Yang, Yang and Yin2018), both the graphical structure and conditional probability tables (CPTs) are derived from the data set; this is very useful when there are adequate data for such modelling. However, in practice, the data are often inadequate, which renders developing a BN difficult using only accident data. One reason is that certain data may be omitted from the data set. When estimating the consequences of navigational accidents for this paper, data on economic loss were missing, despite this being a critical factor for consequence estimation according to the regulations of the Ministry of Transportation (MoT) of China. Another reason is that when developing the graphical structure of a BN, intermediate factors are often introduced to intuitively describe accident development; however, this data cannot be directly collated from accident data. For similar reasons, an alternative method (Trucco et al., Reference Trucco, Cagno, Ruggeri and Grande2008; Akhtar and Utne, Reference Akhtar and Utne2014), which derives the inter-node relationships from accident investigation reports, was not adopted. This is because it is impossible to obtain the accident investigation reports of these navigational accidents for the Yangtze River. Hence, the motivation behind the research presented here was to develop a BN that only uses mutual information to derive the relevance of the influencing factors. The data set used in this paper was collated from the Vessel Traffic Service Centre, which has few descriptions of the accident development process but contains detailed data on environmental factors, ship particulars and emergency resources used.
The remainder of this paper is organised as follows. The mutual information-based BN is introduced in Section 2, where the influencing factors are identified from historical data and previous studies; mutual information is calculated to define the independence of the influencing factors; and the historical data are used to establish CPTs. Section 3 applies the proposed method for consequence estimation for the Yangtze River. Discussions are carried out in Section 4. Conclusions are drawn in Section 5.
2. CONSEQUENCE ESTIMATION MODEL USING MUTUAL INFORMATION-BASED BN
2.1. Proposed mutual information-based BN model
Traditionally, there are three steps in the basic BN modelling process. The first step is to identify the influencing factors from the historical data and/or from experts. In the second step, the graphical structure (the qualitative element) is developed using expert inputs. In the third step, the quantitative relationship is established by introducing the CPTs.
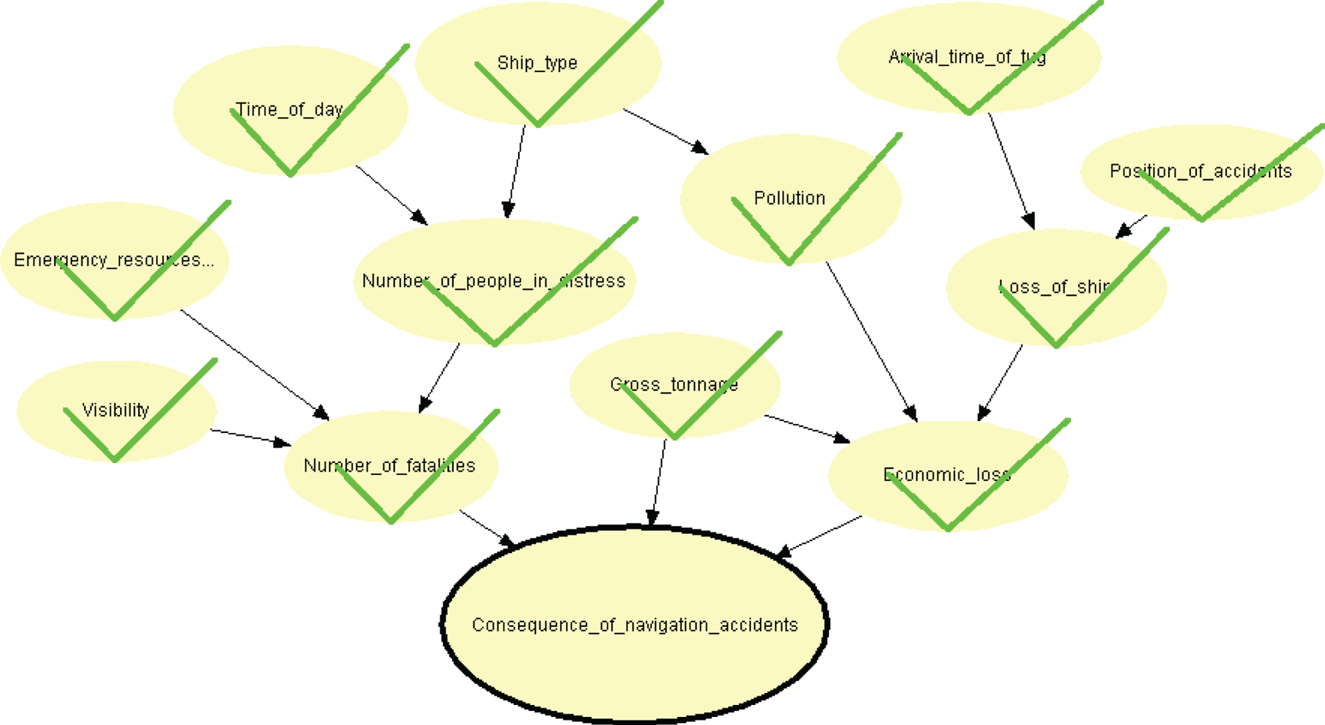
The proposed consequence estimation model for navigational accidents is shown in Figure 1. The modelling process can be summarised in the following three steps.

Figure 1. Proposed mutual information-based BN for consequence estimation.
The first step is to identify the influencing factors from the historical data and previous studies. Moreover, the associated states and probabilities are defined in this step. Two rules are defined to exclude certain irrelevant factors in the accident database. Afterwards, three methods are utilised to define the states of the factors, whereas the probabilities of the associated states are derived from the historical data.
The second step is to construct the graphical structure using the mutual information. After obtaining the marginal probability for two influencing factors (any one with another), the mutual information can be obtained. The calculation of the mutual information can be used to determine the dependence of the two factors by defining a threshold for the mutual information. However, it should be mentioned that the mutual information can only be used to determine the dependence or independence between two factors; it cannot be used to determine which one is the parent- or child node. In practice, experience or expert judgement should be used. However, it is very difficult to find two totally independent or dependent factors, therefore, a small value (i.e. 0·05) is used in this paper to indicate that two variables have a probability of around 95% of being independent from the simulation results (Pethel and Hahs, Reference Pethel and Hahs2014).
In the third step, the quantitative component of the BN is established using the CPTs, because the majority of factors are derived from the accident database, which can be easily obtained. However, in this paper, as economic loss was not recorded in the database, this intermediate factor should be introduced to facilitate the modelling process.
The main difference between the proposed mutual information-based method and the basic BN is the establishment of a qualitative element. In the basic BN, this is established using experts. However, the proposed method uses the existing information to determine dependence among the variables. Although occupational experience or expert judgements are used to define the parent- and child nodes after obtaining the dependence relationship of the influencing factors, this process is much easier than solely relying on expert opinion. The chi-square test of independence can also be used to determine dependence between two variables in the second step; the advantage of mutual information is that it can be applied to small data sets, whereas chi-square requires the asymptotic limit of infinite data (Pethel and Hahs, Reference Pethel and Hahs2014). There will be no further discussion of such advantages and disadvantages, as all methods are widely used and have similar results in practice; rather the focus will be on the mutual information-based method.
2.2. Identifying the influencing factors for the consequence estimation of navigational accidents
Because there are more than 20 factors recorded in this database, to simplify the modelling process, influencing factors were excluded according to the following two rules. (Note that excluded factors are not considered in the BN model and that only factors that are strongly related are excluded.)
If one factor strongly relates with another factor, only one of the factors is selected in this modelling process. Taking ‘ship length’ and ‘gross tonnage’ as examples, these two factors have a strong relationship with an R 2 = 0 · 956 when polynomial curve fitting is applied, therefore only the factor ‘gross tonnage’ is selected. However, if one factor has a weak relationship with the other factors, this factor is excluded. This can also be achieved using mutual information. To illustrate this, the factor ‘ship owner’, which includes the states of state owned and private, will be used in this paper (the result is shown in Subsection 3.1.).
After using these two rules, the influencing factors can be identified from the following previous studies. The influencing factors of wind, visibility, time of day and arrival time of the tug boat have a significant impact on maritime safety control in the Yangtze River (Wu et al., Reference Wu, Zong, Yan and Guedes Soares2018). The influencing factors of the ship gross tonnage and the position of the accidents is used for decision support of grounded ships (Wu et al., Reference Wu, Yan, Yip and Wang2017b). Emergency resources, and the number of people in distress is used for the evaluation of the effectiveness of search and rescue operations (Zhang et al., Reference Zhang, Yan, Zhang, Haugen and Yang2014). It should be noted that the emergency resources used indicates how many types of emergency resources have been used in the emergency response. In practice, helicopters, costal patrol vessels, civil ships and tug boats are treated as one type of emergency resource. Ship type was found to be related to oil spillages in a previous study (Yip et al., Reference Yip, Talley and Jin2011). Pollution, economic loss, loss of ship and number of fatalities are directly related to the consequences as set out in the MoT regulations, which makes them easy to obtain.
2.3. Determining the states of the influencing factors
The node states should be handled carefully when using a BN. The reasons why the node states are defined is shown in Table 1. To define feasible and reasonable states for all nodes, three methods are used in this paper.
Table 1. Reasons for defining the node states.

First, as the states of some nodes in the database are described using mutually exclusive ‘yes’/‘no’ response options, it is very easy to define them using the existing terms. For example, in the database, pollution is described as yes or no. Similarly, the nodes for time of day and visibility, loss of ship, and hull damage after collision are defined in this way.
Second, some states, such as wind conditions, are defined according to occupational experience and previous studies. In the study by Balmat et al. (Reference Balmat, Lafont, Maifret and Pessel2011), a wind condition of less than 3 on the Beaufort scale is defined as having little impact on maritime safety, whereas, according to the regulations of the Maritime Safety Administration (MSA), ships are prohibited to navigate in the fairway when the wind condition is more than 6. Therefore, the states of the wind can be defined as ‘less than 3’, ‘from 3 to 6’, and ‘more than 6’. The emergency resources used, ship type, arrival time of the tug boat, position of the accident, whether run aground, needing tug assistance, flooding, and condition after an intervention are all defined in this way.
Third, the states of certain influencing factors are defined according to the regulations of the MoT (Zhang et al., Reference Zhang, Teixeira, Guedes Soares, Yan and Liu2016a, Reference Zhang, Yan, Zhang, Yang and Wang2016b). Ship tonnage, economic loss, and consequences of collision accidents are defined according to the definitions of the MoT. Similarly, number of people in distress and the number of fatalities are defined in this way as the MoT also defines incident level by using this criterion.
2.4. Using mutual information for dependence determination
Mutual information is derived from entropy theory. This method measures the dependence between two variables, and has been widely used for such calculations in previous studies (Peng et al., Reference Peng, Long and Ding2005). Define X and Y as two random variables. The mutual information of these two variables can be calculated using Equation (1).
 $$I(X;Y)=\sum\limits_{y\in Y} {\sum\limits_{x\in X} {P(x,y)\log _2 \left({\frac{P_{xy} (x,y)}{P(x)P(y)}} \right)} }$$
where I(X;Y) is the joint probability distribution of X and Y, while P(x) and P(y) represent the marginal probability distributions for X and Y, respectively. The relationship between entropy and mutual information is as follows. The mutual information is the overlap entropy between two random variables and can be defined as Equation (2) and simplified as Equation (3).
 $$\begin{align} I(X;Y)&=H(X)-H(X\vert Y) \end{align}$$
 $$\begin{align} I(X;Y)&=H(X)+H(Y)-H(X,Y) \end{align}$$
where H(X) is the entropy of the variable X, H(Y) is the entropy of the variable of Y, and H(X, Y) is the joint entropy, while H(X| Y) is the conditional probability. This can also be illustrated as in Figure 2.

Figure 2. Diagram for the relationship between mutual information and entropy.
According to the mutual information theory developed by Shannon and Weaver (1994), if the mutual information is zero, these two factors are totally independent; if the mutual information is 1, these two factors are totally dependent. However, in reality, it is very difficult to find two totally independent or dependent factors. Therefore, the threshold, ℓ, is introduced to determine the dependence of two factors such that if the mutual information satisfies the inequality equation, I(X;Y) < ℓ, these two factors are assumed to be independent.
2.5. Establishing the CPTs for economic loss to facilitate the consequence estimation
The consequence of accidents is a combination of economic loss, gross tonnage and fatalities according to the definition of the MoT in China (Zhang et al., Reference Zhang, Teixeira, Guedes Soares, Yan and Liu2016a, Reference Zhang, Yan, Zhang, Yang and Wang2016b). Economic loss should be assessed because there are no such records in the historical data. After consulting staff at the MSA, loss of ship, gross tonnage, and pollution were identified as factors to estimate economic loss. However, as can be seen from Table 1, pollution and loss of ship are recorded using ‘yes’/‘no’ response options; this is too ambiguous to assess of economic loss, therefore further analysis was carried out to obtain the CPT for economic loss.
First, the volume of an oil spill can be derived from historical data. There are two sources of such data. One is from a research study in Portugal in which the researchers concluded that approximately 89% of the incidents involved quantities of less than 7 tonnes of oil, 8% between 7 and 700 tonnes and only 3% were above 700 tonnes (Gouveia and Guedes Soares, Reference Gouveia, Guedes Soares, Guedes Soares and Parunov2010). Another data source is from research in China in the 1990–2010 period (Xiong et al., Reference Xiong, Long, Tang, Wan and Li2015), where each tonne of oil was valued at approximately 3k RMB. However, the clean-up cost should also be considered in this estimation. Several studies have been carried out to estimate such costs (Montewka et al., Reference Montewka, Weckström and Kujala2013; Xiong et al., Reference Xiong, Long, Tang, Wan and Li2015; Li et al., Reference Li, Cai, Lin, Chen and Zhang2016); however, as this paper does not focus on accurate clean-up costs, following advice from MSA staff, the clean-up cost is estimated to be more than twice the oil price. By introducing the above-mentioned data and assumptions, the economic loss caused by pollution can be estimated and is shown in Table 2.
Table 2. Estimated economic loss of pollution.

Another economic loss – the loss of a ship – should also be estimated. According to historical data, during 2006–2013, 80 ships were lost among the 797 navigational accidents on the Yangtze River. Of these 80, 36% of them were less than 500 tonnes gross tonnage (gt); 44% were between 500 and 3,000 gt; tonnes and 20% were over 3,000 tonnes gt. In more detail, traffic distribution of less than 500 tonnes gt, from 500 to 3,000 tonnes gt and over 3,000 tonnes gt were 34%, 47% and 19%, respectively.
Based on the two investigations into economic loss, experts were invited to offer advice and judgements to obtain the CPT. Three staff members from the MSA were invited, two experts hold bachelor's degrees in marine engineering and have worked for at least 8 years (i.e. one has worked 8 years, the other 12 years), the third expert holds a master's degree in marine engineering and has 5 years' experience. When making assessments, the well-known extended if–then scheme, which has been widely used in previous studies (Wu et al., Reference Wu, Yan, Yip and Wang2017b), was adopted. The CPT for economic loss was established as shown in Table 3.
Table 3. CPT for economic loss.

3. APPLICATION OF THE PROPOSED BN ON THE YANGTZE RIVER
3.1. Calculating the mutual information for influencing factors
Data on then 797 navigational accidents on the Yangtze River (2006–2013) were from the Jiangsu MSA, which is located in the downstream area of the river. Collision accidents account for 82·8%, while grounding accidents account for 17·2%. To obtain all the mutual information between the influencing factors, the mutual information was calculated one by one. In Subsection 2.4, mutual information between the two independent factors ‘gross tonnage’ and ‘time of day’ was used as an illustrative example of this calculation process. The remaining mutual information was derived in the same way. For the sake of brevity, only one example of two dependent factors, ‘number of people in distress’ and ‘ship type’, will be introduced in detail. The CPT for these two factors with their marginal probabilities is shown in Table 4.
Table 4. CPT for ‘ship type’ and ‘people in distress’ with marginal probability.

The mutual information between these two factors in different states was calculated, as shown in Table 5. It can be seen from this table that the mutual information is 0·1848; in this paper, the threshold for mutual information is set at 0·05. Therefore, these two factors are assumed to be dependent.
Table 5. Mutual information between ‘ship type’ and ‘people in distress’.

After calculating the mutual information among all the influencing factors, the mutual information matrix was obtained (see Table 6). Note that as there was no data for economic loss, a substitute method was introduced to establish the CPT for this node. Similarly, as the consequence of navigational accidents is defined by the MoT, this node was not used in the calculation. Note that ‘ship owner’ is used as an example to illustrate that mutual information is useful in identifying irrelevant factors, even though this factor does have a relationship with the occurrence of maritime accidents in the midstream of the Yangtze River (Zhang et al., Reference Zhang, Yan, Yang, Wall and Wang2013).
Table 6. Mutual information matrix for influencing factors of navigational accidents.

Note: GT = gross tonnage; VB = visibility; ND = number of people in distress; ST = ship type; NF = number of fatalities; ERU = emergency resourced used; TD = time of day; PL = pollution; AT = arrival time of the tug boat in normal conditions; PA = position of accidents; LS = loss of ship.
As this paper defines the threshold as 0·05 to determine whether two factors are dependent or independent, it can be seen from Table 6 that several factors are dependent. Ship type is dependent on the number of people in distress; this is because passenger ships have more people in distress, while there are only crew members on the other types of ships (Montewka et al., Reference Montewka, Ehlers, Goerlandt, Hinz, Tabri and Kujala2014). The number of fatalities is dependent on visibility and the number of people in distress because visibility will influence the search and rescue operation, and the more people there are in distress, the larger the probability that people will not to be saved due to limited resources (Jasionowski, Reference Jasionowski2011; Wu et al., Reference Wu, Yan, Wang and Guedes Soares2017a). The emergency resources used depend on the number of fatalities because of the ineffectiveness of the search and rescue operations in emergency responses (Zhang et al., Reference Zhang, Yan, Zhang, Haugen and Yang2014). Pollution is related to ship type because oil tankers or chemical ships may cause large-volume spills (Yip et al., Reference Yip, Talley and Jin2011). The loss of a ship is related to the arrival time of the tug boat and the position of accidents. If the emergency recourses cannot arrive in a limited time, ship accidents may develop into flooding or other types of accidents (Mazaheri et al., Reference Mazaheri, Montewka and Kujala2014; Montewka et al., Reference Montewka, Ehlers, Goerlandt, Hinz, Tabri and Kujala2014). The Yangtze River has many bridges; if the accident occurs near a bridge, attempts to save the ship may not be made because of the risk of colliding with the bridges.
3.2. Establishing and validating the qualitative part of the BN
After obtaining the mutual information between all the influencing factors, their relationships can also be derived. It should be noted that only the relationship can be obtained; the direction of the influence diagram cannot be derived using mutual information. In other words, the mutual information cannot be used to judge which is the parent- and which is the child node. Therefore, previous studies and expert opinion should be used to define the direction of influence.
From the mutual information, ‘time of day’, ‘number of fatalities’ and ‘ship type’ were found to be related to ‘number of people in distress’. From previous research and accident development logic it can be surmised that as people are asleep during the night, the number of people in distress will be greater than during the day (Jasionowski, Reference Jasionowski2011); moreover, evacuations at night are more difficult, therefore, ‘time of day’ will influence ‘number of people in distress’, which means that ‘time of day’ is the child node and ‘number of people in distress’ is the parent. In another example, ‘number of people in distress’ would be the child node for ‘number of fatalities’ because the people in distress have a probability of being saved, and the number of fatalities is the number of people in distress minus the number of people saved. All other parent- and child nodes were defined similarly and their reasons given in Table 7. After defining the relationships among the influencing factors, the graphical structure of the BN was obtained and is shown in Figure 3. In the figure it can be seen that both the nodes and arcs have been defined. Note that when using a basic BN (Zhao et al., Reference Zhao, Wang and Qian2012), the relationship between any pair of nodes should be determined by using a set of relationship values, specifically, direct, not direct, uncertain, and reverse direct. It takes a long time for experts to assess such relationships; however, by introducing the proposed mutual information-based method, only direct or reverse direct relationships need to be assessed. Therefore, the proposed method will save a great deal of time.

Figure 3. Graphical structure of the BN for consequence estimation.
Table 7. Define the parent- and child nodes for consequence estimation.

After the development of the qualitative component of the BN, the graphical structure should be validated to ensure that the nodes are linked by a serial connection, a diverging connection or a converging connection. The d-separation method was used to validate whether two variables were separated through an intermediate variable. When two variables are d-separated, the following should be true (Pristrom et al., Reference Pristrom, Yang, Wang and Yan2016): (1) the connection is either serial or diverging, and the state of the intermediate variable is known, (2) the connection is converging, and the state of the intermediate variable or any of its descendants is not known. This is easily carried out using Hugin Expert software; the results are shown in Figure 4, which demonstrates that the nodes of the developed BN are d-separated.

Figure 4. Results of the d-separation analysis of the developed BN.
3.3. Introducing logistic regression for influencing factors validation
In order to validate that the selected influencing factors in the BN modelling were significant for the consequence estimation, logistic regression was introduced. Before using this method on the data, a sample of navigation accident data from 2014, which included 108 accidents, was used to validate the method. Descriptions of the influencing factors are presented in Table 8. From the table, it can be seen that the distribution of the majority of influencing factors are close to the 2006–2013 data except for the position of accidents. In the sample data, only 12·96% of navigation accidents occurred in the restricted area, while during 2006–2013, the percentage was 24·97%; there were also slight differences in relation to other influencing factors.
Table 8. Influencing factors description.

Logistic regression, a suitable method of predicting correlations between a set of independent variables and a target variable (Weng and Meng, Reference Weng and Meng2011), was introduced using the data from 2014. The target variable was treated as dichotomous for two reasons. First, there were only six accidents with the severity rating of catastrophic and 15 of major severity; the data set was too small to derive a reasonable result if these two severities were treated separately. Second, as the objective of this step was to validate that the influencing factors were dependent on the target variable, this treatment would not influence the validation result. Therefore, the target variable y, consequence of navigation accidents, can only take two values: y = 1 for the high consequence and y = 0 for the low consequence. The binary logistic regression model can be written as Equation (4).
 $$ln\left( {\frac{\pi (x_1, \cdots x_7 )}{1-\pi (x_1, \cdots x_7 )}} \right)=\alpha _0 +\sum\limits_{i=1}^7 {\alpha _i x_i}.$$
The probability that the navigation accidents are of high or low consequence can be calculated using Equation (5).
 $$P(y=1\vert x_1 \cdots x_7 )=\pi (x_1 \cdots x_7 )=\frac{e^{\alpha _0++\sum\nolimits_{i=1}^7 {\alpha _i x_i } }}{1+e^{\alpha _0++\sum\nolimits_{i=1}^7 {\alpha _i x_i } }}$$
where x i, i = 1,···, 7 are the seven influencing factors such as gross tonnage, time of day; π(x 1 · · · x 7) is the conditional probability of P(y = 1| x 1 · · · x 7); and αi is the coefficient variable of the influencing factors.
The results of this logistic regression method are shown in Table 9. From the p-values, it can be seen that all seven identified influenced factors were significant with a significance level of 0·10 (Weng and Meng, Reference Weng and Meng2011); this confirms that the mutual information-based method can be used to identify influencing factors. Moreover, from the coefficients in Table 9, is can be seen that GT, time of day and position of accidents are negatively associated with the consequences of navigation accidents, while the other four influencing factors are positively associated. Note that emergency resources used is positively associated with the consequences of navigation ac cidents, the reason being that if an emergency scenario is very complex, for example, man overboard, they would have to search for the individual over a large area meaning several emergency resources would be requested.
Table 9. Statistical results of the logistic regression model for consequence of navigation accidents.

3.4. Using the BN for consequence estimation
Before introducing the quantitative element of the BN, the CPT for the consequences of navigational accidents should be defined. The definition of this CPT is simple because the MoT has defined the regulations for this (see Table 10). It should be noted that for brevity, only part of the CPT is presented, and the states of the number of fatalities have been simplified.
Table 10. CPT for consequence of navigational accidents.

Note: no = no fatalities; SI = serious injury; LT2 = 1 to 2; O2 = over 2.
Prior information on navigational accidents can be derived using historical data, as presented in Table 11. By introducing prior information, the BN for the consequence estimation of navigational accidents can be obtained; the results for the current study are shown in Figure 5.

Figure 5. The BN for the consequence estimation of navigational accidents.
Table 11. Prior information on influencing factors of navigational accidents.

It can be seen from Figure 5 that the consequence of navigational accidents is ‘negligible’ with a probability of 0·42, ‘minor’ with a probability of 0·31, ‘major’ with a probability of 0·19 and is ‘catastrophic’ with a probability of 0·08. Although 797 navigational accidents occurred on the Yangtze River during the 2006–2013 period, only 8% were catastrophic accidents. The reason for this is that emergency management has played an essential role in reducing accident consequences (Zhang et al., Reference Zhang, Yan, Zhang, Haugen and Yang2014). As the consequences of navigational accidents is an essential component of any risk analysis in the formal safety assessment framework (Zhang et al., Reference Zhang, Yan, Yang, Wall and Wang2013), the decision maker can use these results to further analyse the safety level on the Yangtze River. By establishing the criteria for the risk levels, the decision maker can take actions to accept the safety level or improve it. The risk control options, also a component of a formal safety assessment, can be further analysed to mitigate navigational risk by taking countermeasures. However, as the focus of this research was to develop a practical method for consequence estimation, further analysis was not carried out.
3.5. Sensitivity analysis for partial validation of the developed model
After deriving the consequences of navigational accidents using a BN, a sensitivity analysis should be carried out to partially validate the quantitative component of the model. This analysis is necessary as certain assumptions (i.e. the CPT of economic loss) are used, which may cause uncertainty. Two axioms are often used to validate the developed model (Zhang et al., Reference Zhang, Yan, Yang, Wall and Wang2013, Reference Zhang, Teixeira, Guedes Soares, Yan and Liu2016a, Reference Zhang, Yan, Zhang, Yang and Wang2016b; Akhtar and Utne Reference Akhtar and Utne2014; Pristrom et al., Reference Pristrom, Yang, Wang and Yan2016), as follows.
1. Axiom 1. A slight increase/decrease in the prior probabilities of each parent node should certainly result in a relative increase/decrease of the posterior probabilities of the child node.
2. Axiom 2. The total influence magnitudes of the combination of the probability variations from x attributes (evidence) on the values should always be greater than that from the set of x − y(y ∈ x) attributes (sub-evidence).
The validation of these two axioms was as follows.
1. Test of Axiom 1. Taking ‘consequence of navigational accidents’ as an example, the utility values of severity were defined as V 1(catastrophic) = 40, 000; V 2(major) = 3, 000; V 3(minor) = 500; V 4(negligible) = 200, and the consequence measured as 1,000 Yuan. Therefore, the consequence can be estimated by using the equation
 $I_{j} =\sum\nolimits_{i=1}^{N} {V_{i} P_{i} } $, where V i is the utility value, P i is the associated probability of V i, and N is 4 as there are four types of severities. When increasing the values of ‘serious injury’ (i.e. one state of the number of fatalities) by 10% and 20%, the consequence of the navigational accidents increases from 3,969 to 3,976 and 3,981, respectively. The other nodes can similarly be validated by following Axiom 1.
2. Test of Axiom 2. When each sub-evidence of ‘emergency resources used = more than 3’, ‘visibility = bad’, and ‘number of people in distress = from 3 to 10’ was entered, the consequence of navigational accidents was 5,100, 4,376 and 4,794, respectively. When ‘emergency resources used?=?more than 3’, ‘visibility = bad’, and ‘number of people in distress = from 3 to 10’ were entered into this model, the consequence of navigational accidents was 7,498. Further tests were also undertaken for other nodes (e.g. economic loss), and the results reflected that the model follows Axiom 2.

3.6. Results analysis of catastrophic accidents
From Figure 5 it can be seen that 8% of the 797 navigational accidents were catastrophic. To validate this result, the catastrophic accidents in the Yangtze River during the 2006–2013 period were collated. From the statistical analysis, eight accidents caused more than two fatalities. The detailed information on these accidents is shown in Table 12.
Table 12. Detailed information on navigational accidents that caused over two fatalities.

However, only 1% of the navigational accidents caused more than two fatalities because the other 7% of catastrophic accidents were caused by economic loss; this can be observed in Figure 5. Therefore, by analysing the catastrophic accidents, the estimated accident consequence was close to the real accident data. It can also be deduced that the majority of catastrophic accidents were caused by economic loss (eight times the number of catastrophic accidents caused by fatalities). In reality, a comprehensive assessment of the accident consequence should be carried out, not only considering the fatalities but also the economic losses. From historical data, there were approximately 20 ships lost and 83 pollution accidents. The number of ship lost and pollution accidents are close to the historical data, and will be discussed in detail in the discussion section to illustrate that the proposed model achieved a high level of accuracy.
Note that for Case 3 in Table 12, when the ‘number of people in distress’ is less than 10 and ‘emergency resources used’ is more than 3, the probability of no death is 0·53 but there is still a probability of 0·04 of causing more than 2 fatalities, which is shown in Figure 6. Similarly, in Case 6, when ‘number of people in distress’ is more than 10 and ‘emergency resources used’ is more than 2, there is a 0·56 probability of causing no death, but also a probability of 0·05 of causing more than 2 fatalities. Since there were 797 accidents during the period researched, it is possible there was one such case causing more than two fatalities in the historical data.

Figure 6. Marginal probability analyses for the navigational accidents.
3.7. Predominant factors analysis of navigational accident consequence
A predominant factor analysis is essential to discover which factors influence the consequence of navigational accidents most, meaning countermeasures can be focused on these factors to improve maritime safety. This type of analysis is often carried out in risk modelling by using a BN, the principles of which will not be presented in detail here (Hänninen and Kujala, Reference Hänninen and Kujala2012). To discover the predominant factors in the consequence of navigational accidents, Hugin Expert software was introduced, and the values of the information module of this software were used to facilitate the calculation process. The analysed results are shown in Figure 7. Note that only the input variables were analysed while the intermediate nodes were ignored because the decision maker can only take countermeasures on the input variables.

Figure 7. Predominant factor analysis of the consequences of navigational accidents.
From Figure 7, it can be seen that four factors have the most influence on the consequences of navigational accidents: ship type, visibility, number of people in distress and emergency resources used. Ship type is an essential factor because a passenger ship will cause more people in distress than other types of ship, which is also an important factor for the consequence of navigational accidents. A dangerous cargo ship may have a relatively high probability of causing pollution. Low visibility will have a crucial impact on navigational safety and on search and rescue operations. The more people there are in distress, the greater the probability of fatalities in maritime accidents. Emergency resources can help to save lives after accidents, and can also reduce the severity of the accident consequences. Based on this analysis, the MSA, which is in charge of maritime safety in China, can take countermeasures such as ‘paying more attention to passengers and dangerous cargo ships’, ‘prohibiting ship navigation when visibility is low’ and ‘developing more emergency facilities along the Yangtze River’ to reduce the severity of accidents.
This result can also be explained using marginal probability. When the response to ‘emergency resources used’ is ‘no’, there is a 0·006 probability of causing more than two fatalities. Similarly, when ‘emergency resources used’ changes to ‘less than 3’ or ‘more than 3’, the probability of causing more than two fatalities increases to 0·02 and 0·04, respectively. This means that when the number of emergency resources used increases, the probability of more than two fatalities also increases. This is the same as the results using the logistic regression model in Subsection 3.3. This indicates that emergency resources used is an important factor for the consequences of navigation accidents. Similarly, it can also be found that when the number of people in distress increases from ‘less than 3’ to ‘from 3 to 10’, and to ‘more than 10’, the number of fatalities is above 2 with a probability of 0·004, 0·01 and 0·03, respectively. This implies that the number of people in distress is important for the consequences of navigation accidents.
4. DISCUSSION
By introducing mutual information, this paper proposes a modified BN for the consequence estimation of navigational accidents. Compared with the basic BN (Zhao et al., Reference Zhao, Wang and Qian2012), the proposed method uses mutual information to judge the independence of the influencing factors from which the parent- and child nodes can be defined. The merit of this method is that it can save time by solely using subjective judgements in the modelling process, rather than using expert judgements for defining the graphical structure as in traditional BN (Hänninen and Kujala, Reference Hänninen and Kujala2012; Wu et al., Reference Wu, Yan, Yip and Wang2017b), while the proposed method uses the data. However, compared with the traditional mutual information-based BN (Yang et al., Reference Yang, Yang and Yin2018), which requires adequate data for modelling, expert judgement is required for this proposed method.
The advantages and disadvantages of these three methods are shown in Table 13. It can be seen that the proposed method and the basic BN describe the accident development very well, while the traditional mutual information-based method can also describe it well when the data set describes the accident development adequately. Moreover, the validation of the traditional mutual information method was convincing as it agreed with the results from the data, while validation of the basic BN and proposed BN were only assessed as reasonable as they both used expert judgements. Therefore, the applicability of the traditional mutual information-based method is very good if the data set is adequate, while the other two methods can be flexibly applied to other scenarios.
Table 13. Comparison of the three types of BN methods.

However, as economic loss was lacking in the historical data, this node was introduced to facilitate the consequence estimation by using expert inputs and the existing data to derive the CPT rather than the relationships. However, in practice, if these data can be collated, the quantitative component of this node can also be derived using the mutual information-based method. The node for consequences of navigational accidents was derived from MoT regulations; this node could also be obtained using mutual information.
According to the analysis of the developed BN, the results were reasonable and could be used for consequence estimation of navigational accidents. First, fatalities greater than two totalled approximately 1%, which is the same as the historical data. Because eight navigational accidents caused more than two fatalities (see Table 12), this was very close to the predicted result (1% × 798 = 8). Second, according to the historical data, there were approximately 20 ships lost; although this was slightly different from the prediction (2% × 798 = 16), the result was close to the historical data. Third, the historical data on pollution accidents (83) were close to the predicted result (11% × 798 = 88). Although there were no records of economic loss, which makes the result difficult to validate using historical data, this result should be reasonable bearing in mind these three factors were verified using historical data.
Note that it is difficult to validate all the obtained outcomes. Background knowledge is often used in the risk modelling process (Aven, Reference Aven2010; Mazaheri et al., Reference Mazaheri, Montewka and Kujala2014; Goerlandt and Montewka, Reference Goerlandt and Montewka2015). However, background knowledge is not always equally available in order to understand the interactions among all parts of a system (Montewka et al., Reference Montewka, Ehlers, Goerlandt, Hinz, Tabri and Kujala2014) and could ultimately cause uncertainty. In practice, it is inevitable that assumptions will need to be simplified, which will also cause uncertainty. In this paper, the historical data on fatalities, ship loss and pollution were used for validation, and the analysed results were close to the statistical data, as previously discussed. Therefore, the results can be assumed to be reasonable, especially for major- and catastrophic-severity accidents. The deficiency is that there are no records on economic loss and expert opinions were therefore used to facilitate the modelling process, which makes validation difficult with severity ratings of ‘negligible’ and ‘minor’. However, from the perspective of accident analyses, it is the major and catastrophic accidents that must be prevented and given more attention than negligible and minor incidents.
5. CONCLUSIONS
The main contribution of this paper is the proposal of a mutual information-based BN method for the consequence estimation of navigational accidents and identification of the predominant factors in such accidents. First, the influencing factors for the consequence of navigational accidents were identified from the historical data and previous research. Second, mutual information was utilised to judge the independence of the influencing factors; the graphical structure of the BN could then be derived. Finally, CPTs were established using historical data. Because the traditional BN often uses expert judgements to define the graphical structure of a BN, this paper utilised mutual information to reduce the need for expert judgements in the modelling process. By applying this mutual information-based BN to consequence estimation, four predominant factors for the consequence of navigational accidents were identified: ship type, visibility, number of people in distress, and emergency resources. Based on these findings, countermeasures can be taken to reduce the consequences of such accidents.
Although this paper uses the Yangtze River as a case study, the proposed model could be readily applied to other waterways to predict the consequences of maritime accidents if the data for the proposed waterways have similar characteristics. Specifically, if the majority of the data are available for modelling, even though certain data may be missing from the data set, the process might still be used. However, it should be noted that when applying this method to other waterways, the influencing factors should be dealt with carefully because the Yangtze River is an inland waterway transportation route with limited the channel width and water depth. Moreover, the CPTs expounded in this model should also be updated when applied to other waterways. If the historical data collated are detailed, however, the mutual information-based method can be straightforwardly applied to determine the dependencies of the influencing factors.
ACKNOWLEDGEMENTS
The research presented in this paper was sponsored by a grant from National Science Foundation of China (Grant No. 51809206), International Cooperation and Exchange of the National Nat-ural Science Foundation of China (Grant No. 51920105014), National Key Technologies Research & Development Programme (2017YFE0118000), the Fundamental Research Funds for the Central Universities (Grant Nos. WUT:2019IVB062, WUT:2019IVB085) and the Hong Kong Scholar Programme (Grant No. NO.2017XJ064).