

Casual and academic observers alike have described American politics as increasingly subject to division and animosity between partisans. Research in political science provides support for this perception. A considerable amount of research has demonstrated the parties in Congress have moved farther apart from one another ideologically while becoming more homogenous internally.Footnote 1 Roll call votes can now be predicted by a legislator’s position along a single left–right ideological dimension – traditionally crosscutting issues such as civil rights have largely disappeared and party unity has increased.Footnote 2 While there is little disagreement over the fact that political elites have become increasingly polarized, there is a considerable debate about how this increase in elite polarization has affected mass-level attitudes and behaviors. Has it gone unnoticed by all but the most attentive voters? Or has the growing ideological divide between elected officials affected how the majority of the electorate perceives the parties?
We argue that the increase in elite-level polarization has dramatically reshaped the political behaviors of the American electorate in a multitude of ways – and not just among those voters who are highly attuned to politics. Specifically, we argue that the distribution of voters’ basic policy orientations has remained relatively unchanged over the past forty years, yet, how these orientations affect political attitudes and behaviors has changed a great deal. We argue that these changes in mass-level attitudes and behaviors are being driven by polarization on the elite-level. Perceptions of the parties depend on what party leaders do, and individuals are better able determine the parties’ ideological positions as the cues sent by party elites have become more distinct.Footnote 3 This relationship is evidenced by recent mass-level trends. Recent literature has demonstrated that individuals have sorted into the political camp that best matches their political orientations. For example, those who hold conservative orientations have become increasingly likely to identify as a Republican.Footnote 4 Our findings support this view. However, we contend that the effect of elite-level polarization on mass-level attitudes and behaviors goes beyond partisan sorting and extends to other attitudes and behaviors as well. We argue that the increase in elite-level polarization has led to increasingly polarized voting behavior and increasingly negative attitudes toward partisan out-groups. Our analysis of American National Election Study (ANES) survey data spanning 1972–2012 supports this argument.
Our attempt to establish the relationship between elite-level polarization and its mass-level consequences is organized into five sections. First, we outline the relevant literature on political polarization and ideological sorting and work to develop some expectations about the potential consequences of the parties’ increasing ideological distinctiveness at the elite level. Second, we turn to establishing the electorate’s political orientations.Footnote 5 We utilize ANES data that spans 1972–2012 and a measurement model to develop a measure of each respondent’s latent policy orientations. We find that Americans’latent policy orientations are two dimensional, consisting of independent economic and social dimensions. Third, we link a voter’s latent policy orientations with their expressed attitudes and behaviors across these dimensions. We also find that an individual’s economic and social policy orientations have become a stronger predictor of their attitudes and behaviors, but that this effect is conditional upon elite-level dynamics. It appears that an increase in polarization on the elite level makes individuals more prone to identify with and vote for the ideologically proximate party – this relationship is especially strong among individuals with more extreme policy orientations. Last, we discuss the implications of our findings. In particular, we draw upon the social psychology literature and discuss how the presence of overlapping group memberships can contribute to an increase in political hostility.
Polarization and Ideological Sorting on the Mass Level
The label ‘polarized’ is generally used to describe how a trait is distributed in a population. In the abstract, polarization is a state in which two points on opposite sides of a central tendency (and with some distance from it) dominate the frequency of responses. Specific to our concerns, describing an electorate as polarized requires that citizens are concentrated at ideological extremes, rather than clustered around the median position – the distribution of citizens in policy space is bimodal, with the poles carrying more weight than the center.Footnote 6 When an electorate or legislative body is polarized, there are necessarily fewer moderates and more ideological extremists. Yet, many scholars have found that the American public is not especially polarized across most issue dimensions – in many ways Americans appear ideologically moderate (or normally distributed) as opposed to polarized.Footnote 7 Some scholars have noted that there actually appears to be a good deal of agreement between Republicans and Democrats (as well as between red states and blue states).
Yet, we contend that polarization on the elite level can dramatically affect electoral behavior even if it is not associated with any type of dramatic change of the electorate’s basic underlying ideological or policy orientations. Levendusky demonstrated that individuals have become increasingly well sorted into ideologically homogenous party coalitions.Footnote 8 Conservatives have become more likely to identify as Republicans and liberals have become more likely to identify as Democrats.Footnote 9 Moreover, Levendusky established that elite polarization was causally linked to mass-level ideological sorting – meaning voters are cognizant of partisan cues and respond to them by adopting views that correspond with those of party elites.Footnote 10 It is important to note that sorting is not equivalent to polarization – sorting does not necessarily alter the ideological distribution of voters in the electorate. Rather, the ideological distribution of voters remains unchanged but an individual’s policy principles become a stronger predictor of their partisanship – meaning voters are more likely to sort into the ‘correct’ ideological camp. This process leads to a scenario where the distribution of individuals’ underlying policy orientations remains constant, but their expressed attitudes and behaviors change.
The question is whether this process of sorting is politically meaningful if it is not connected with an increase in ideological polarization? We contend that there is reason to think that sorting is consequential in its own right, even in the absence of increased issue polarization in the mass public. Many scholars have linked the sorting of the party coalitions to the increases in partisan bias and hostility that have been observed in recent decades.Footnote 11 Much of the recent research from the social identity perspective has demonstrated that the process of partisan sorting is extremely consequential and explains the rise of vitriolic politics.Footnote 12 According to this perspective, the rise of overlapping and mutually reinforcing partisan, ideological, and social identities has led to increasingly hostile and divided (and commonly referred to as polarized) political process, even without an associated increase in issue polarization. Thus, the process of partisan sorting is likely of considerable importance, not only because it has led to the emergence of more homogenous parties in the electorate, but also because this process of sorting is associated with the increase in behavioral polarization and the increasingly negative assessment of political out groups.
The Elite Roots of Attitudinal and Behavioral Polarization
We contend that the process of partisan sorting is being driven by increasingly distinct party coalitions at the elite level. Moreover, we argue that elite-level factors are driving changes in a number of attitudes and behaviors, including an increase in out-group hostility and polarized voting behavior, as measured by a decrease in ideological crossover voting, where conservative voters support the Democratic Party and liberal voters support the Republican Party.Footnote 13 The reason why we argue polarization on the elite level is connected with such a wide array of individual level phenomena is due to the fact that individuals orient themselves in the political world by assessing where they stand relative to the positions of the parties.Footnote 14 This assessment becomes more straightforward as the parties’ offer more distinct choices and become ‘easier’ to distinguish from one another.Footnote 15 The distinctiveness of the available party options is important because most individuals only pay a limited amount of attention to politics.Footnote 16 This ‘rational ignorance’, leads individuals to utilize heuristics such as party identification and other shortcuts in order to determine what party best represents their political orientations. However, there is no guarantee that cost-saving heuristics will lead an individual to identify with the ‘right’ party. Individuals could possibly identify with the party that is not ideologically proximate if the parties’ ideological positions are difficult to tell apart, or if there is considerable overlap in the parties’ ideological positions.Footnote 17
There is ample evidence that the parties are now more distinct than they were decades ago: the parties are both more ideologically unified internally and farther apart from one another.Footnote 18 As Poole and Rosenthal pointed out, the party system that emerged following the New Deal was essentially a three party system, consisting of the Republicans, liberal Northern Democrats and conservative Southern Democrats.Footnote 19 Identifying the Democratic party with a particular ideological position was difficult during this time period because Democratic legislators ran the gamut from liberal to conservative. Thus, voters likely had difficulty determining how ideologically proximate the Democratic party’s position actually was, seeing that the Democrats represented a wide variety of positions.
However, the ideological composition of the parties today is quite different to that which existed before the breakup of the ‘Solid South’. The conservative Democrats from the South are now largely extinct, as conservative white Republicans have replaced virtually all white Southern Democrats in the House and Senate. Democrats can now be reliably described as liberals while Republicans can be described as conservatives. The parties’ increasing internal homogeneity is largely the product of increasing within-party agreement on multiple issue dimensions. One of the key insights of Poole and Rosenthal’s research on congressional ideology and roll call voting is that there are two ideological dimensions that can structure congressional roll call voting. During the 1960s and 1970s legislative roll calls were characterized by the presence of two-meaningful dimensions – different legislative coalitions formed depending onto which dimension the vote fell.Footnote 20 Typically, this meant Southern Democrats voting with the Northern Democrats on economic issues (the first dimension) but with the Republicans on civil rights issues (the second dimension).
However, the explanatory power of this second dimension is fairly limited in a temporal sense, and has decreased over time. Since the 1970s the importance of the second dimension has decreased, as a legislator’s position on the general left–right dimension began increasingly to explain their votes on racial and social issues as well.Footnote 21 The legislative coalitions that now form on economic issues are nearly the same as those that form on civil rights or other social issues. The implications of this are that the parties are now increasingly unified across both issue dimensions – crosscutting legislative issues are an increasing rarity. For example, it is now possible to predict accurately where a legislator stands on abortion based on their position on tax cuts for the wealthy, because the positions of the party elites on these two dimensions have become increasingly positively correlated.Footnote 22 The increasing within-party ideological homogeneity across a number of different issue dimensions is the process Layman and Carsey termed ‘conflict extension’.Footnote 23 Republican and Democratic elected officials and activists (as well as highly informed citizens) are now likely to agree with their party across a host of issue dimensions.Footnote 24 Elite cues are now much more unified than they were previously. Thus, individuals are likely to be better able to determine the party that is more ideologically proximate to them.Footnote 25
The evidence of an increase in polarization on the elite-level is straightforward. The parties are now farther apart ideologically and more ideologically homogeneous internally. Moreover, crosscutting issues have largely disappeared as the dimensionality of congressional roll call votes has moved closer and closer to one. This increase in congressional polarization has coincided with a rise in partisanship and the ideological sorting of the electorate, meaning that these elite and mass-level trends are collinear.Footnote 26 Disentangling these collinear trends is an analytical challenge, because it is difficult to observe whether the elites or the masses are driving the change in the other. This analytical challenge implies that we need to pay special attention to research design in order to gain the leverage necessary to uncover the relationship between elite-level and mass-level changes.
We address this challenge by utilizing a measurement model to uncover the American electorate’s underlying policy orientations. These orientations are distinct from positions on individual issues, partisanship, or ideological self-placement – they are best thought of as an individual’s position along broadly defined economic and social policy dimensions. Using this measurement model we create two variables that capture an individual’s position along each of the two policy dimensions. We can then assess how an individual’s underlying policy orientations are translated into behaviors and attitudes and whether this translation into behaviors is conditional upon changes on the elite level. The question is this: How does this increasing level of polarization affect the political perceptions, attitudes, and behaviors of American citizens? We argue that there is a direct link between the positions parties adopt and how individual voters translate their ideological orientations into political attitudes and behaviors.
Policy Orientations
Policy orientations can be thought of as the predisposition to evaluate a set of government actions within a specific issue domain with some degree of favor or disfavor.Footnote 27 In this section we intend to measure individuals’ policy orientations, with the goal of creating a measure that is comparable across individuals and across time. For this analysis, we use ANES data that spans 1972–2012. While the ANES has been in existence since 1948, it was not until 1972 that the surveys began to ask and record respondents’ attitudes toward a wide variety of political issues, including government involvement in the economy, healthcare, aid to minority groups, abortion, civil rights, welfare, and gay rights. These questions do not gauge an individual’s opinion on a specific policy – rather, these questions are geared toward capturing respondents’ broader political dispositions regarding government intervention in the economy and moral traditionalism. We attempt to measure an individual’s underlying political orientations by analyzing their pattern of responses across a variety of survey items.
A Measurement Model
The measurement of policy orientations involves several practical and theoretical issues that must be addressed before moving forward. We generally think of these orientations ranging from liberal to conservative, however, a one-dimensional model is likely to be too simplistic. A considerable amount of recent research has demonstrated that at least two independent ideological dimensions structure the electorate’s policy orientations.Footnote 28 Therefore, we must utilize a measurement strategy that is capable of both determining the dimensionality of the electorate’s orientations as well as assessing where each individual respondent is located along each dimension.
We determine the dimensionality of the policy space using confirmatory factor analysis. Factor analysis is a statistical technique that is used to uncover the latent dimensions that structure individual attitudes by examining the patterns of interrelationships that exist among a set of variables.Footnote 29 Factor analysis has been used by a number of scholars to analyze ANES data in an effort to determine the ideological dimensions that structure Americans’ political ideologies.Footnote 30
The results of the factor analysis reveal that there are two underlying dimensions that structure individual orientations – economic issues load highly on the first dimension while social issues load highly on the second dimension.Footnote 31 These two dimensions are stable across each of the eleven elections in the sample.Footnote 32 The two dimensions that we uncover are broadly similar to those found by Schofield, Miller and Martin’s factor analysis of ANES data from 1964 and 1980 and Ansolabehere, Rodden and Snyder’s analysis of ideological constraint and issue voting.Footnote 33 We use the scoring coefficients from the factor analysis as each individual voter’s coordinates in the two-dimensional policy space.
By construction, the mean (0) and standard deviation (1) of these dimensions is the same in each year. Scores range from approximately −3 (the most liberal) to +3 (the most conservative), with the majority of respondents being located between −1 and +1. We ensure that the measurement of individuals’ policy positions is consistent from year to year by using questions that are common to all survey years as anchors. We assess the degree that the measurement model measures the same underlying concept in each year by assessing the factor loadings of questions that are common to every year. We present this analysis in full in section 1.1 of the supplemental online appendix (see Table A1 specifically). The core finding of this analysis is that factor loadings for the questions that are common to each year are quite similar across the entirety of the sample. The substantive interpretation of this finding is that a score of −1 on the economic or social dimension means roughly the same thing in 2012 as it did in 1972. This is vital because change can only be evaluated relative to some constant, and our measure of the electorate’s political orientation provides us with a constant measure that we can use as a benchmark to assess change.
The strength of this model is that it fixes the policy space and allows us to make valid comparisons across time.Footnote 34 This means the policy content and measurement of the dimensions (i.e. the mean and standard deviations) are constant across years. Accordingly, whatever changes we observe in the level of behavioral/attitudinal sorting or polarization that have occurred cannot be the result of a shift in the electorate’s policy orientations – a constant cannot explain a change. However, as we demonstrate below, the relationship between an individual’s policy orientations and that individual’s expressed political attitudes and behaviors is conditional upon the level of elite polarization. An exogenous change – presumably some type of change on the elite level – must be the underlying catalyst of attitudinal and/or behavioral polarization on the mass level. In the next section we assess the relationship between an individual’s underlying policy orientations and their political self-identification and their evaluation of political groups.
The Changing Relationship between Policy Orientations, Attitudes, and Behaviors
So how do an individual’s underlying policy orientations affect how they behave? In our first analysis we assess how well an individual’s position in policy space predicts their vote choice, party identification, ideological self-labeling and the level of hostility felt toward the opposing party (i.e. affect polarization). We are interested in these outcomes because they all relate to how an individual’s underlying policy orientations affect how they evaluate their own position relative to the parties. Simply put, if the electorate is becoming more attitudinally and behaviorally polarized in response to polarization at the elite level, then we should expect an individual’s basic underlying policy orientations to become an increasingly strong predictor of political attitudes and behaviors.
First, we utilize an individual’s underlying position on the economic and social dimensions as independent variables, which we use to predict four outcomes of interest: (1) Vote choice – coded 1 if voted Democratic and 0 otherwise; (2) An individual’s reported position on the seven-point Party ID scale, with 1 being strong Democrat and 7 being strong Republican; (3) An individual’s self-placement on a seven-point ideology scale, with 1 being strong liberal and 7 being strong conservative;Footnote 35 (4) Affect polarization – the difference in the feeling thermometer (which runs from 0 to 100, with 100 being the most favorable) scores between the respondent’s in-party evaluation minus the respondent’s out-party evaluation (e.g. 100IP−30OP=70). Accordingly, larger values on this variable mean greater affect polarization. The base equation we use to test these possibilities is the same in all four instances is shown below:
 $$Y_{i} =a{\plus}B_{1} E_{i} {\plus}B_{2} S_{i} {\plus}e_{i} $$
where,
Y i is the dependent variable (i.e. Vote choice, PID, Ideology, or Affect polarization);
a is a fixed regression constant;
E i is individual i’s position on the economic dimension;
S i is individual i’s position on the social dimension;
And e i is an error term.
All four models are specified identically. We estimate all models using Ordinary Least Squares, with the exception of the vote choice, which is estimated using a probit model. We present a separate regression for each year (1972–2012). Thus, we are able to assess the relationship between a voter’s underlying policy orientations and their expressed attitudes and behavior for each year of the ANES data. Rather, we can directly observe how the coefficients change over time, both in terms of substantive effect/magnitude and statistical significance. The empirical expectation here is that the coefficient on voters’ position in policy space should become a larger over time. In addition, model fit should improve as individuals’ underlying policy orientations begin to explain an increasing proportion of the variance in attitudes and behaviors. We present the results of these analyses in Table 1.Footnote 36
Table 1 Predicting Outcomes with Economic and Social Dimension Ideology Scores

Notes: Robust standard errors in parentheses: *p<0.10, **p<0.05, ***p<0.01.
The results of these models demonstrate that individuals’ underlying policy orientations have become an increasingly strong predictor of their expressed attitudes and behaviors. Both the social and economic dimension have become stronger predictors of individuals’ evaluations of partisan objects. The economic dimension is generally significant for all years in all four series. The substantive impact of these coefficients also appears to increase over time. The changes in the coefficients for a respondent’s position on the social dimension are also quite striking. The sizes of the coefficients for the social dimension have at least doubled across all four series of analyses. In the case of partisan identification, the sign flips after 1972, and the coefficient on the social dimension becomes consistently statistically significant beginning in 1996. Similarly, the social dimension for the vote choice models becomes statistically significant starting in 1980, and the magnitude of the coefficient generally increases over time. The model fit statistics also generally improve over time, suggesting that as a whole, there is an increasingly strong link between an individual’s policy orientations and the party they support, the ideological label that they apply to themselves and their evaluations of partisan out-groups.Footnote 37 Overall, the results of these models provide evidence that the electorate has sorted, and that underlying policy orientations increasingly serve as strong predictors of individuals’ expressed attitudes and behaviors.
The basic set of conclusions that we draw from this analysis are fairly simple: individuals with conservative (liberal) underlying policy orientations are increasingly likely to self-identify as conservative (liberal), self-identify as Republicans (Democrats), vote Republican (Democrat), and to express negative attitudes toward the opposite party.Footnote 38 Moreover, the effect of these underlying policy orientations is strengthening over time. Rather, the marginal effect of an increase in the underlying ideology scales is greater in 2012 than in 1972. The question, then, is what force is driving these changes? We contend that the masses have sorted because it has become increasingly easy to identify the party that more closely matches an individual’s underlying political orientations. We test the relationship between polarization on the elite-level and mass attitudes and behaviors in the next section.
An Analysis of the Link between Elite Polarization and Mass Level Sorting
The question we have is simple: Is polarization on the elite level driving increasing partisan conflict on the mass level? Rather, do individuals become better able to sort themselves into the most ideologically proximate party as the two party options become more distinct from one another? This explanation presupposes that there have been significant changes in the level of elite polarization in the past several decades. In order to assess this possibility empirically, we need to operationalize the level of elite ideological polarization in a way that comparable across years. We assess the level of elite polarization using Poole and Rosenthal’s Common Space DW-NOMINATE Data, which provide an estimate of the ideological position of each member of Congress based on their observed pattern of roll call votes.Footnote 39 The Common Space DW-NOMINATE data allow for comparisons of legislators’ ideological positions both across years and across chambers. Thus, this measure provides us with a common benchmark with which we can evaluate change in the level of elite polarization across time.
We operationalize elite-level polarization as the ideological distance between each party’s mean NOMINATE score (this measure includes both Representatives and Senators). The party positions in the aggregate become more distinct as the mean scores move farther apart. The difference between the means represents the ideological distance between each party’s average legislator.
Figure 1 displays the mean of the first dimension NOMINATE scores for each party, and the distance between the mean values, for each Congress between 1972 and 2012.Footnote 40 As Figure 1 demonstrates, the level of elite polarization has increased substantially over the past forty years. The parties have adopted increasingly opposing positions in policy space. This increase in polarization has largely been driven by the Republican party’s increasing level of ideological conservatism. The Democratic party has also drifted to the left, but the magnitude of this shift is less than the Republican shift to the right. The increasing distance between the party positions has created a situation in which the parties are increasingly distinct from one another. Our question is this: How do these changes relate to the increasingly strong relationship between an individual’s policy principles and their evaluation of the parties?
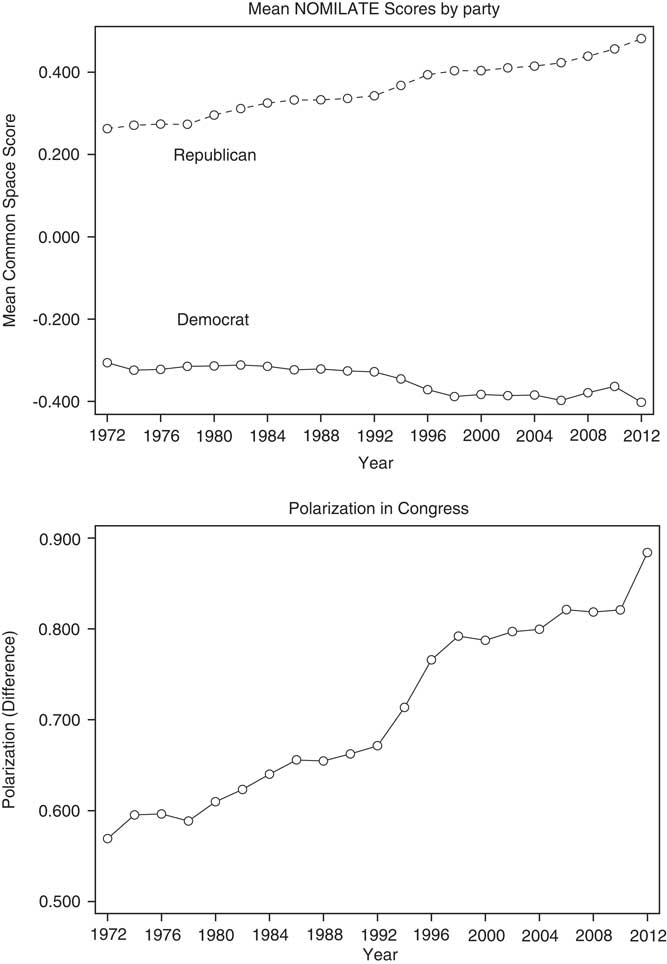
Fig. 1 Mean congressional ideological position by party and difference in party means (polarization)
A Combined Model
In the two preceding sections we have established two basic facts: first, that an individual’s underlying policy orientations have become a stronger predictor of a number of political behaviors, attitudes, and evaluations. Second, the parties have become more polarized on the elite level. In this section we present a model that is designed to examine the relationship between these two patterns, and to explore some additional extensions. Our model specification is as follows:
 $$Y_{i} =a{\plus}B_{1} E_{i} {\plus}B_{2} S_{i} {\plus}B_{3} (R_{j} \,{\minus}\,D_{j} ){\plus}B_{4} (E_{i} {\asterisk}R_{j} \,{\minus}\,D_{j} ){\plus}B_{5} (S_{i} {\asterisk}R_{j} \,{\minus}\,D_{j} ){\plus}X_{i} {\plus}e_{i} $$
where
Y i is the dependent variable (i.e. Vote choice, PID, Ideology, or Affect polarization);
a is a fixed regression constant;
E i is individual i’s position on the economic dimension;
S i is individual i’s position on the social dimension;
R j is the mean Republican Congressional NOMINATE position in year j;
D j is the mean Democratic Congressional NOMINATE position in year j;
X i is a vector of control variables for each individual respondent;
e i is an error term.
The intuition behind this model is fairly simple: the relationship between an individual’s underlying policy orientations and their evaluation of the parties is conditional upon the ‘distinctiveness’ of the available party choices. Rather, how individuals’ underlying policy orientations on the economic and/or social dimensions translate into political behaviors or expressed attitudes is conditional upon elite-level factors. As we have established previously, the coefficients on the economic and social dimensions for individual voters become stronger over time. We argue that individuals’ translation of their political orientations into corresponding behaviors and evaluations of the parties varies as a function of the choices available. Thus, we should expect any given position in the underlying policy space to translate into evaluations differently depending on the how distinct the party positions are. It is for this reason that our theoretical model includes an interaction between an individual’s position on both dimensions of the individual policy orientation measures, and our variable capturing polarization at the elite level, which is the distance between the parties’ mean ideological positions in Congress (i.e., E i * R j −D j and S i * R j −D j ). The expectation is that an individual’s underlying policy orientations will become increasingly strong predictors of attitudes and behaviors as the parties become increasingly distinct from one another. In the next subsection we test the relationship between increasing elite-level polarization and corresponding mass level changes using a series of analyses testing our combined model.
Testing the Relationship between Elite Level Polarization and Mass Level Sorting
We begin our analysis by assessing the relationship between congressional polarization, individuals’ underlying policy orientations, and their expressed political attitudes and behaviors. We utilize the four basic analyses that we conducted in the third section as a starting point, however, there are some key differences between this first set of models and the models we present here, which are designed to test our core argument. One key difference is that rather than presenting individual analyses for each year, here we pool the yearly panels into one data set, which includes panels for all presidential election years from 1972 through 2012. In order to test how increasing elite-level polarization has affected the translation of individuals policy orientations into observable choices, it is necessary to pool the data so as to allow our elite-level measures to vary over time. In order to do this we include the distance between the party means (polarization) as an independent variable, as well as the interaction between an individual’s position on the economic dimension and the polarization variable, and also the interaction between an individual’s position on the social dimension and the polarization variable.Footnote 41 The inclusion of this interaction term allows us to test whether an individual’s behaviors and expressed attitudes are conditional upon the interaction between elite-level factors and individual-level factors.
We include several demographic control variables in addition to our primary independent variables. We include controls for respondent race, level of education, income and region. We also include controls for the mean congressional ideological position, and the Democratic share of the two party vote in the given election year, in order to account for short-term forces that might lead voters to support/identify with a particular party at a higher rate than would be expected under normal conditions. We present our initial set of analyses in Table 2. Given the inclusion of several interaction terms, we will rely primarily on a series of figures to aid in interpreting the results. Additionally, we should note that we display the marginal effect of a change in the elite-level variables. That is, the marginal effects graphs display the marginal effect of an increase in elite-level polarization across the range of the individual-level policy orientation variables. We do this so we can examine how individuals’ underlying policy orientations respond differently to such elite-level changes. The marginal effects that we plot essentially capture the between-group differences for an increase in polarization from one standard deviation below the mean to one standard deviation above the mean. That is, how the outcome variable differs for a 1 (for example) between conditions of high and low polarization. Accordingly, for any given point on the X-axis, we can see whether or not the increasing elite polarization corresponds to a change in the attitudes or behavior of voters at that position. Note that the marginal effect in the linear models represents a change from one standard deviation below the mean to one standard deviation above the mean, which represents a fairly substantial change and takes many years to unfold.Footnote 42
Table 2 Models Regressing Party ID, Ideology, Affect Polarization and Vote Choice on Individual Level Orientations and Congressional Polarization: Main Models, Elite and Mass Polarization

Notes: Robust standard errors in parentheses: *p<0.10, **p<0.05, ***p<0.01.
Figure 2 shows the marginal effect of an increase in congressional polarization for the following outcomes: Party ID, Individual Ideology, and Out-Party Evaluations. The top row of graphs shows the interaction with the first dimension policy orientation score, while the bottom row shows the second dimension policy orientation score.

Fig. 2 Marginal effect of change in congressional polarization on party evaluations
The results indicate that as elite-level polarization increases, more liberal individuals (X < 0) tend to more strongly identify themselves with the Democratic party, while more conservative individuals (X > 0) tend to identify more strongly with the Republican party. Similarly, we see that as elite-level polarization increases, individuals with more liberal policy orientations tend to self-identify as more extreme liberals. This effect is not symmetrical, however, as more conservative individuals do not appear to change in response to increases in elite polarization. Lastly, we see that as polarization increases, more liberal individuals are likely to express less favorable opinions of the Republican party, while the most conservative individuals express slightly less favorable opinions of the Democratic party.Footnote 43 This finding mirrors those of Iyengar, Sood and Lelkes, as well as Mason.Footnote 44 Interestingly, the effects are most consistent for liberal individuals. Where the effects are significant for conservatives, they tend to be smaller in magnitude.
The second row shows the estimated marginal effects for an increase in polarization across the range of the second dimension. Here we see similar relationships, with a few minor caveats. For Party ID, expressed ideology, and evaluations of the out-party, we can see that an increase in polarization leads individuals with more socially liberal policy orientations to identify more closely as strong Democrats and/or as extremely liberal. The estimated effects also indicate that as elite polarization increases, more socially liberal individuals tend to express increasingly unfavorable attitudes about the Republican Party. In the case of ideology, we see that increasing elite polarization is not correlated with increasingly strong self-identification as a conservative for the most socially conservative individuals. This result mirrors the result for economic ideology (top row), which was not correlated with any difference in ideological self-identification for the most conservative individuals. In the case of party identification, strong social conservatives see a small statistically significant effect, meaning that an increase in elite polarization leads to strong social conservatives identifying more closely with the Republican party.
Figure 3 shows the marginal effect of an increase in congressional polarization on Democratic vote choice for each of the two individual dimensions. In the left panel, which shows the economic dimension, we can see that an increase in elite-level polarization correlates with an increase in the predicted probability that more liberal individuals voted for the Democratic candidate in a given election. Alternatively, increasing polarization is correlated with a lower probability that more conservative individuals voted for a Democratic candidate in a given election. Given the sigmoid curvature of the plotted effects and associated confidence intervals, there appears to be a statistically significant change in the magnitude of this effect for liberal voters. Specifically, the effect appears larger for center-left voters, and smaller for the most liberal voters. This is likely to reflect the fact that the many liberal voters have always been more likely to vote for Democratic presidential candidates, but increasing polarization has had the strongest effect on more moderate liberals, who perhaps had a lower baseline probability of casting a Democratic vote. More broadly, the substantive implication of this finding is that ideological crossover voting is increasingly rare as polarization increases, which might help to explain why presidential campaigns have become increasingly focused on turning out core supporters rather than persuading undecided voters.Footnote 45
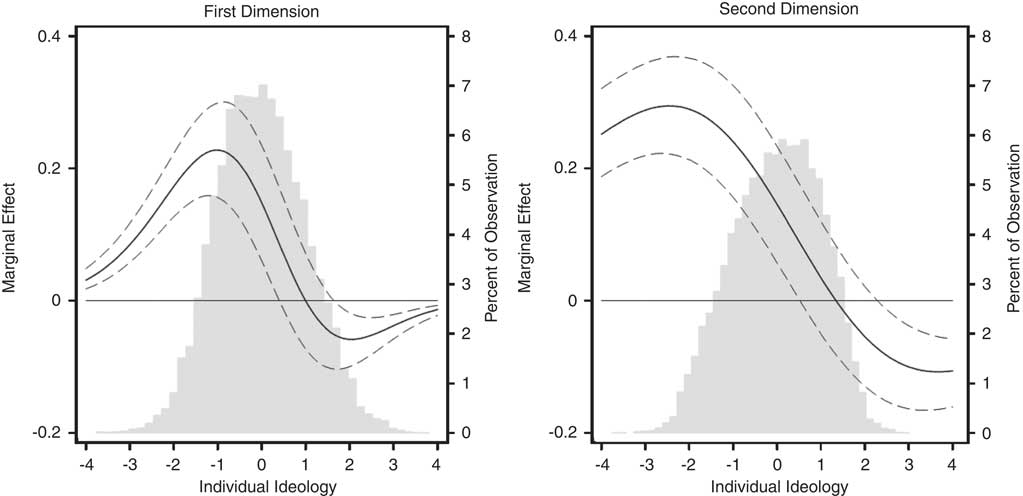
Fig. 3 Marginal effect of congressional polarization on vote choice
We observe similar dynamics for the social dimension. More liberal individuals are more likely to vote for a Democratic presidential candidate as elite-level polarization increases, and more conservative individuals are less likely to vote for a Democrat. Interestingly, the magnitudes of the estimated effects for the social dimension are considerably larger as compared to the economic dimension. The Y-axes in Figure 3 are held constant, helping to clarify the relative magnitude of the marginal effects. Unlike the economic dimension, we do not see a sharp curve to the predicted effect, indicating that increasing elite-polarization interacts in a more uniform manner with the social policy orientation dimension across liberal and conservative voters. That is, given the shape of the curve and the overlapping confidence intervals, moderate liberals and extreme liberals appear to have responded in similar ways to increasing elite-level polarization.
An important detail should be emphasized here. One question might be whether or not the relationships that we are capturing herein are spurious: are we getting these results because individuals are increasingly sorting themselves into ideologically homogeneous camps, just as political elites have sorted themselves? If this were the case, the correlations we find could simply be the result of two variables trending over time in a similar fashion. However, by construction the measures capturing an individual’s underlying policy orientations have a mean of 0 and a standard deviation of 1. Figure 4 shows a scatter plot of the first dimension of the individual policy orientation scores over the time frame covered by the data. The black line indicates the best linear fit. As this figure makes clear, there is no temporal trend in the individual ideology scores. Accordingly, our regressions are telling us that individuals with relatively similar latent policy orientations are behaving differently as congressional polarization increases. Rather, the expressed attitudes and behaviors of a +1 or a −1 on this individual policy orientation measure change in response to elite-level changes.
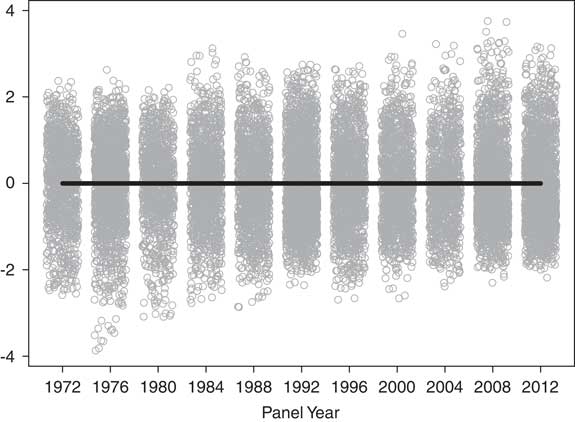
Fig. 4 Scatter-plot of first dimension ideology score with linear fit
Lastly, to further illustrate this point, Table 3 shows a correlation matrix for the congressional polarization measures and the individual policy scores. As Table 3 shows, there is no indication of a bivariate correlation between the individual policy scores and the measures of congressional polarization. We argue that in light of the lack of a trend in the individual measures, the results presented above provide a strong indication of a link between elite-level polarization and changes in mass political attitudes. This claim stems from a basic logical precept – a constant cannot explain a change. Therefore, an exogenous change, which we argue is the fundamental realignment of the parties on the elite level, is driving the increasing level of partisan conflict in the electorate.
Table 3 Correlation Matrix for Individual Ideology Measures, Congressional Polarization, and Mean NOMINATE Measure

Establishing Causality with Coincident Trends
One of the potential issues with our analysis stems from the fact that elite-level polarization increases relatively consistently over time. This raises the concern of whether we can attribute changes on the mass level to this increased level of polarization among elites. The potential problem here is that polarization trends positively over time, and is thus highly correlated with a simple linear time trend and literally any other positively trended variable (Gross Domestic Product, the stock market, oil prices, etc.).
While polarization indeed positively trends over time, there is a relatively simple methodological and theoretically relevant way to distinguish it from a simple linear trend. The change from one point in time to the next is necessarily constant for a linear time trend, but not for the polarization measure. Though the level of polarization generally increases over time and is necessarily highly correlated with a linear time trend, the variation in the change in polarization is not highly correlated with time. For example, there were particularly large increases in Congressional polarization between 1992 and 1996 and between 2008 and 2012. Therefore, the change in polarization from one presidential election year to the next is not so highly correlated with time (r ≈ –0.30 across our estimation sample). If mass attitudes are indeed responding to changes in elite-level polarization, then we should also expect to observe larger changes in mass-level behaviors and attitudes in years characterized by large increases in elite polarization.Footnote 46
The model in Table 4 substitutes the change in polarization from one presidential election year to the next (e.g., from 1972 to 1976) for the level polarization variable that we use in our primary models. We also include a linear time trend variable. We interact the change in polarization variable and the linear time trend variable with our individual-level policy orientation variables, as we do with the polarization level variable in our primary models. Including the linear time trend variable and its interactions with the individual-level policy orientation variables serves as a proxy for a hypothetical positively trended alternative mechanism. If individuals are actually responding to fluctuations in elite-level polarization, and not some other positively trended force, then we should expect the following models to yield results for the change in polarization variable that are similar to the results we find for the level of polarization in our primary models. Accordingly, the models in Table 4 contain two sets of interactions: the first is between the polarization change variable and each of the individual-level policy orientation variables; the second is between the time trend and each of the individual-level policy orientation variables.
Table 4 Models Regressing Party ID, Ideology, Affect Polarization and Vote Choice on Individual Level Orientations and Change in Congressional Polarization: Polarization Change Models with Time Interactions

Notes: Robust standard errors in parentheses: *p<0.10, **p<0.05, ***p<0.01.
The idea here is that even if we assume there is some other process, aside from elite polarization, that is also unfolding over time, we can control for that with the linear time trend, but we should still expect to see results on the polarization change variable as well if masses are responding to increasing elite polarization. We plot the marginal effects from these models in Figures 5 and 6 to illustrate the estimated effects better. Generally speaking, the marginal effect of the change in polarization continues to match our primary findings, but especially on first dimension individual orientation scores. The marginal effects for the second dimension tend to be significant across most values of the social orientation measure as well, although in some instances the strength of the effect across various orientation values differs from the primary models presented in Tables 2 and 3.
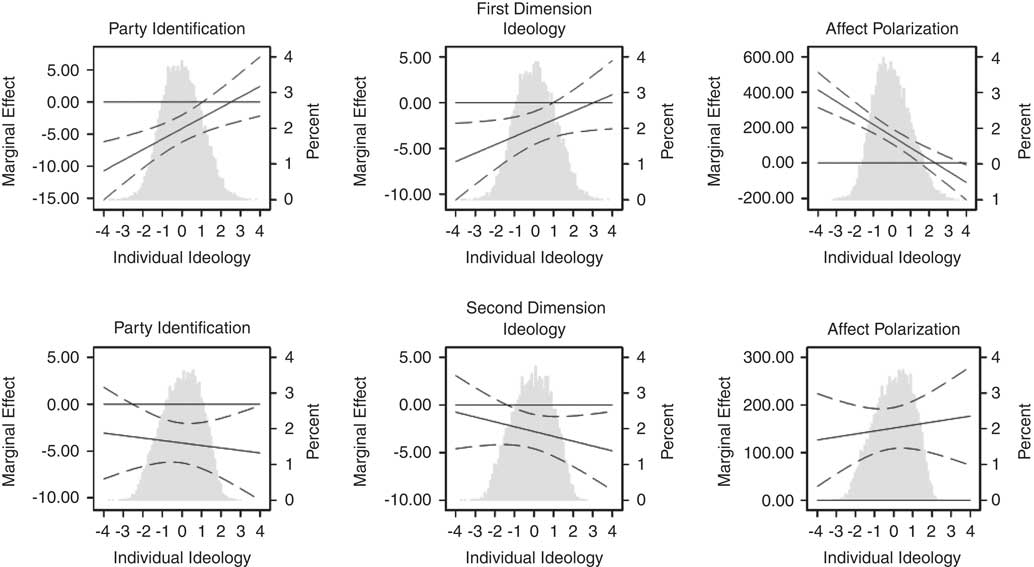
Fig. 5 Marginal effect of change in congressional polarization on party evaluations
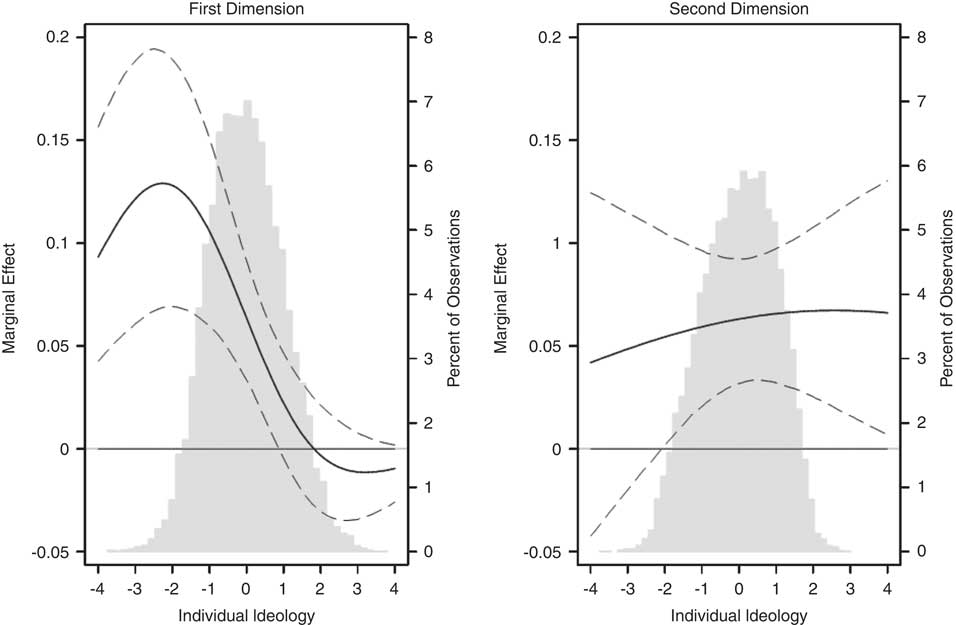
Fig. 6 Marginal effect of congressional polarization on vote choice
On the whole, we believe that these relatively simple tests provide considerable support for our argument and primary findings. While it is true that polarization clearly trends upward over time, changes in polarization do not. If, as our argument suggests, masses are responsive to increasing elite-level polarization, then we should see masses respond to larger changes in elite polarization more than smaller changes. These robustness tests indicate that, even when we attempt to control for some hypothetical alternative mechanism by using a simple linear time trend, changes in polarization are still generally having the effects that we expect them to have. Considering the added computational strain that the additional interaction terms put on the model, we believe this level of consistency is reasonably impressive.
Discussion
The results of our analysis demonstrate that the process of ideological sorting, as well as increasing behavioral and attitudinal polarization on the mass level has been driven by the increasing polarization of elites. This fact raises a question: What are political and social implications of polarization within the electorate? We contend that the implications are both numerous and important. The most notable of these implications relates to the findings from the social psychology literature, which has linked the sorting of the electorate to the increase in political vitriol and hostility toward out-groups. When multiple group identities overlap their combined influence on perceptions and behavior becomes more powerful than a simple sum of the parts. As a result, the sorting process has led to an electorate that is more ‘biased, active, and angry’.Footnote 47 The results of our analysis directly relate to these findings by providing a link between the behavior of elites, the sorting of the electorate, and the behavioral consequences of increasingly ideologically homogenous coalitions in the electorate. Political hostility is not simply a function of the amount of disagreement that exists over basic policy issues; it is a function of fewer overlapping group memberships and clearer distinctions between partisan in-groups and out-groups.
One facet of the sorting process that has not received as much attention in the existing literature is the increasing importance of the social dimension. Americans’ policy orientations are more complex than a uni-dimensional measure of ideology can account for. This is not a minor distinction. An individual’s position on the social dimension was once a much weaker predictor of political behaviors and attitudes than it is today. In addition, an individual’s position on the economic dimension, which has always been an important predictor of behavior, has become even stronger. Americans have sorted on not one but both ideological dimensions. The parties are not only more clearly divided on both the elite and mass level, but they are divided on a wider set of issues. The increasing importance of the social dimension has not supplanted the importance of the economic dimension; rather the predictive power of both dimensions is increasing. The results of our analysis support those of Layman and Carsey, who coined the phrase ‘conflict extension’ to describe the growing divide between the parties across multiple policy dimensions.Footnote 48
However, every analysis has its limits, and ours is certainly no exception. Our analysis attempts to explain the link between elite-level polarization and mass-level attitudes and behaviors, but we do not address why the elites themselves have become more polarized. One important extension to this analysis is to investigate the sources of increasing polarization among elites. Scholars have proposed a wide variety of explanations for this increase, including issue evolution, changes in campaign finance laws, increased partisan gerrymandering, increasingly partisan media, and the increasing authority of party leaders in the House. Because increasing polarization on the elite level is driving the rise of vitriolic politics on the mass level, determining the genesis of these elite-level changes is of considerable importance.
In sum, sorting is very likely to be associated with a variety of micro and macro political phenomena of considerable political importance. This article helps to establish the important link between polarization on the elite level and individual-level attitudes and behaviors.
Supplementary Material
To view supplementary material for this article, please visit http://dx.doi.org/10.1017/S0007123415000514


