


1. Introduction
The world had 1 billion fewer people living in poverty in 2013 compared to 1990 (measured in monetary terms) (World Bank, 2016). While poverty remains high, these aggregate numbers suggest that significant progress has been made in the past decades. Human capital formation, economic growth, trade, and institutional strengthening have been suggested as important drivers for this reduction in poverty headcounts (Ravallion, Reference Ravallion2001; Bhagwati and Srinivasan, Reference Bhagwati and Srinivasan2002; Harber, Reference Harber2002). Economists often have a strong focus on these human development and macroeconomic drivers of poverty reduction (see, e.g., Gennaioli et al., Reference Gennaioli, La Porta, Lopez-de-Silanes and Shleifer2013). Less emphasis has been placed on the role of the quality of renewable natural capital, such as healthy land ecosystems, which are the focus of this article. Notwithstanding, healthy land ecosystems – which we will refer to simply as ‘land’, following convention (see Nkonya et al., Reference Nkonya, Mirzabaev and Von Braun2016) – are foundational for supporting livelihoods (see, e.g., Angelsen et al., Reference Angelsen, Jagger, Babigumira, Belcher, Hogarth, Bauch and Wunder2014). According to Nkonya et al. (Reference Nkonya, Mirzabaev and Von Braun2016), land improvement is closely approximated by two measures: net primary productivity (NPP) and soil fertility improvements. Hence, we focus on these two indicators in this article.
Early empirical studies have identified land degradation and declining soil fertility as being related to poverty at an aggregate level (Barrett and Swallow, Reference Barrett and Swallow2006; Krishna et al., Reference Krishna, Lumonya, Markiewicz, Mugumya, Kafuko and Wegoye2006). More recently, Barrett and Bevis (Reference Barrett, Bevis and Sahn2015a) find that national GDP per capita is positively correlated with soil nutrient balances in 36 Sub-Saharan African countries for which data is available. Barbier and Hochard (Reference Barbier and Hochard2016) find that around a quarter of people living in low-income countries reside on severely degraded land and that a lower share of people on degraded land is associated with higher economic growth as well as lower poverty. Sanchez et al. (Reference Sanchez, Shepherd, Soule, Place, Buresh, Izac, Mokwunye, Kwesiga, Ndiritu, Woomer, Buresh, Sanchez and Calhoun1997) stress the importance of soil quality for food security and development, especially in African countries. In addition, Koren (Reference Koren2018) finds a strong relationship between crop yields and conflict, which in turn is known to influence income and poverty (Goodhand, Reference Goodhand2001).
Summarizing, the literature suggests a positive relationship between land quality and income. The theoretical channels behind this relationship are rather intuitive. One of the most important assets determining productivity for the rural poor is land (Barbier and Hochard, Reference Barbier and Hochard2016, Reference Barbier and Hochard2018). For instance, the water storage capability of soil is an important determinant of plant growth (Wong and Asseng, Reference Wong and Asseng2006). Louwagie et al. (Reference Louwagie, Gay and Burrell2009) find that shallow soils, stoniness or chemical issues such as salinity or acidity are negatively correlated with crop yields. In addition, the topographical conditions of the soil (elevation, steepness, etc.) affect soil erosion and accessibility by humans and machinery (e.g., Zuazo and Pleguezuelo, Reference Zuazo and Pleguezuelo2008). For an overview of the productivity function of soil see Mueller et al. (Reference Mueller, Schindler, Mirschel, Shepherd, Ball, Helming and Wiggering2010). A main conclusion of the literature is that locations with good soils are likely to have high agricultural potential and thus have absolute advantage in generating agricultural income. However, it is not only increasing agricultural income that decreases poverty rates. Aside from crop cultivation and livestock income, forest management also reaps significant benefits that might alleviate poverty. Moreover, the so-called ‘hidden harvest’ from the extraction of natural forests (i.e., forests that are not managed) and other non-forest wildlands as well as non-marketed extraction of natural resources can also play an important role in poverty reduction. For example, Angelsen et al. (Reference Angelsen, Jagger, Babigumira, Belcher, Hogarth, Bauch and Wunder2014) find that almost one-third of the total income of rural households is ‘environmental income,’ of which more than three-fourths stems from natural forests.
Barrett and Bevis (Reference Barrett, Bevis and Sahn2015a) discuss three mechanisms through which poor land may have negative implications for poverty reduction. First, poor and degraded soils have negative effects on agricultural and environmental income. Such links can be self-reinforcing: poor soil constrains capital accumulation and low capital accumulation inhibits investments in improving soils (Eswaran et al., Reference Eswaran, Almaraz, van den Berg and Reich1997; Barrett and Bevis, Reference Barrett and Bevis2015b). Second, poor and degraded soils are characterized by soil micronutrient deficiencies, which in turn can result in dietary mineral deficiencies affecting human health negatively (Barrett and Bevis, Reference Barrett and Bevis2015b). The negative effect of deteriorating individual health on the ability to generate income is a long-standing fact in economics going back to Luft (Reference Luft1975). Third, low quality soils are connected to higher agricultural risks through various channels. For instance, weather shocks such as droughts occur more often in soils with limited water-holding capacity (Garrity et al., Reference Garrity, Akinnifesi, Ajayi, Weldesemayat, Mowo, Kalinganire, Larwanou and Bayala2010). In addition, pests and weeds, which decimate cropland in Sub-Saharan Africa, are more common in low-nutrient and degraded soils (Ayongwa et al., Reference Ayongwa, Stomph, Belder, Leffelaar and Kuyper2011). There may be other mechanisms through which poor land affects poverty, such as through conflict. The link between conflict and land quality is much less understood however. Recent research has found significant effects between increasing spatial crop variability (within a country) and the probability of conflict (Berman et al., Reference Berman, Couttenier and Soubeyran2017; Ang and Gupta, Reference Ang and Gupta2018). Other research has shown that higher yields are associated with more conflict (see Koren, Reference Koren2018).
Even though the theoretical implications are unambiguous, estimating the effect of healthy land (whether that is above-ground, as measured by improving vegetation quality, or below-ground, as measured by improving soil fertility) on income and poverty is not a trivial issue for two reasons. First, these variables are characterized by an endogenous relationship. Natural resources can influence poverty, but poverty can also influence natural resources (Barbier, Reference Barbier2010), with the relationship being moderated by economic, social and environmental factors (Barbier and Hochard, Reference Barbier and Hochard2018). Due to potential simultaneity and intervening drivers, the causal effect of environmental quality on poverty reduction (and vice versa) has been difficult to identify. As a result, most of the literature simply reports correlations (Duraiappah, Reference Duraiappah1998; Suich et al., Reference Suich, Howe and Mace2015).Footnote 1 Second, due to massive data collection efforts, prior studies are location-specific, and do not inform on how the relationship differs by biome or geographic region.
The main contribution of this paper is to provide causal estimates of the impact of land improvements on poverty reduction.Footnote 2 Several additional contributions are presented: we use a global subnational dataset and monetary poverty rates that emerge from survey and census estimations rather than highly modelled measures (such as poverty measures derived from night lights or other satellite-derived information). This dataset is combined with measures of soil fertility and vegetation quality. This enables us to not only draw evidence from cross-sectional models, but also exploit variance over time by implementing a panel fixed effects model to minimize omitted variable bias. The presented findings are based on causal identification of the effects of land on poverty. Our study has a relatively high degree of external validity due to the global scope of the analysis. In addition, instead of only analyzing the effect of cultivation income, we measure the effect of all land, not just land that is under agricultural use and management. This implies that other sources of income such as ‘environmental income’ which is reaped in large part from natural forests (see Angelsen et al., Reference Angelsen, Jagger, Babigumira, Belcher, Hogarth, Bauch and Wunder2014) are also implicitly included in the analysis outlined below. With these methodological refinements, we obtain results that emphasize the importance of land for poverty reduction.
2. Empirical Strategy
2.1 Data
We employ the Hidden Dimensions Dataset (HDD), a unique geospatial dataset linking environment and natural resource measures to poverty and other human development indicators at the subnational level, furnished by the World Bank. The geographical unit is the administrative unit 1 level, commonly referred to as the ‘province’ level.
2.1.1 Environmental variables
We use two different environmental measures:
(a) Net Primary Productivity or NPP – our measure of above-ground land ecosystems, and
(b) Topsoil carbon content (soil fertility) – our measure of below-ground land ecosystems.
NPP is the rate at which an ecosystem accumulates biomass. It measures how much carbon dioxide plants take in during photosynthesis minus how much carbon dioxide is released during respiration. Hence, it is an indicator of how much of the absorbed carbon becomes part of leaves, roots, stalks or tree trunks. NPP data is captured via NASA's Terra and Aqua satellites. Generally, it has been found that NPP is a superior measure of biomass productivity and biodiversity (see, for instance, Phillips et al., Reference Phillips, Hansen and Flather2008) when compared to related indicators such as the Normalized Deviation Vegetation Index (NDVI). The average value per province is used for computations.Footnote 3
Soil fertility is approximated by utilizing topsoil carbon content data. Topsoil carbon content is an important measure of plant productivity, measuring the percentage of carbon contained in the top 30 cm of the soil. The carbon content of the soil is a result of, e.g., decomposing plant and animal residues. It is a major determinant of plant growth and agricultural productivity (see, for instance, Lal, Reference Lal2004). Hiederer and Kochy (Reference Hiederer and Kochy2012) use the Harmonized World Soil Database to compute global soil organic carbon estimates on a subnational level. The Joint Research Centre of the European Commission provides this georeferenced dataset including both topsoil and subsoil carbon measurements via the European Soil Data Centre upon request.
The correlation of NPP and soil fertility may vary substantially. If the nutrient source for vegetation originates largely from the soils (i.e., soil based biomass productivity), then NPP is a very strong proxy of soil quality. If mineral fertilizers are used extensively, NPP is probably not a good indicator of soil quality (see, e.g., Nkonya et al., Reference Nkonya, Mirzabaev and Von Braun2016). Hence, utilizing both measures in the empirical analysis is necessary to comprehensively analyze the concept of ‘land quality’.
2.1.2 Poverty and income variables
The measurement of poverty employed is the headcount ratio of people falling below US$1.90 per day. Even though this is a narrow definition of poverty, US$1.90 is the official international poverty line and allows us to draw from poverty maps that the World Bank produced for many countries over the last decades. This indicator captures what is commonly referred to as ‘extreme poverty’. From the World Bank poverty maps, a global map of subnational poverty measures is created.Footnote 4 Gross domestic product per capitaFootnote 5 is computed using GDP data from Gennaioli et al. (Reference Gennaioli, La Porta, Lopez-de-Silanes and Shleifer2013) and average annual population data from the Gridded Population of the World (GPW) dataset (CIESIN, 2016).
2.1.3 Instrumental variable (IV)
Mean average annual rainfall by province is used to instrument annual changes in vegetation quality and topsoil carbon. The data is sourced from the Climatic Research Unit in the National Center of Atmospheric Research (NCAR, 2017). The dataset contains geographically gridded multiple weather time series from 1901 onwards. The data is averaged by year and province for the computations. The source data is based on rain gauges. See Hulme (Reference Hulme1992, Reference Hulme, Desbois and Desalmand1994) and Hulme et al. (Reference Hulme, Osborn and Johns1998) for details on the spatial interpolation techniques employed to obtain a globally gridded dataset.
2.1.4 Control variables
To capture the effect of different terrains, a topographic ruggedness index (Nunn and Puga, Reference Nunn and Puga2012) is used. This index captures small-scale terrain irregularities based on elevation differences. Land use categories (cropland, forest land, grass land, urban land and other) are included in the regression. Each land use indicator is measured as a share of the total geographic area. The original data is provided by the Land Cover project of the Climate Change Initiative led by the European Space Agency. In addition, a categorical variable corresponding to 14 different categories of soil types is included. These soil categories are a crucial determinant of soil quality. While a province may have several soil types, we assign the most prevalent soil type to each province. This follows the soil classification system of the USDA system of soil taxonomy (see USDA, 1999). Finally, we include road density and population as standard control variables.
In contrast to similar works, we do not rely on population data that is modelled using land use or night light data (e.g., Amaral et al., Reference Amaral, Câmara, Monteiro, Quintanilha and Elvidge2005), which is commonly necessary for fine-grained spatial resolutions. Such datasets might raise severe endogeneity issues, as they could potentially be highly correlated with other satellite derived measures such as those measuring an environmental output. For instance, common measurement errors due to similarities of the satellites used to record the data could establish unwanted mechanical relationships in the dataset. However, only the NPP measure is derived via remote sensing and earth observation, while the rainfall data is derived from rain gauges and statistical spatial interpolation. The employed poverty measures are based on censuses and surveys. Hence, we rule out the possibility of endogeneity that is an artifact of data construction or correlated measurement errors.
A description of all variables, including data sources, can be found in table 1. For summary statistics, refer to table A1 in the online appendix. Summarizing, the dataset contains 3,303 observation for 1,078 provinces in 62 countries. Coverage varies between 1996 and 2014, with country specific details provided in table A2.
Table 1. Variable overview

2.2 Research design
As stated previously, land shares a simultaneous relationship with income and poverty. There is a so-called poverty-degradation vicous cycle: poverty leads to degraded soils, while degraded soils lead to poverty (Barbier, Reference Barbier2000; Eswaran et al., Reference Eswaran, Lal, Reich, Bridges, Hannam, Oldeman, Pening de Vries, Scherr and Sompatpanit2001; Lambin et al., Reference Lambin, Turner, Geist, Agbola, Angelsen, Bruce, Coomes, Dirzo, Fischer, Folke, George, Homewood, Imbernon, Leemans, Li, Moran, Mortimore, Ramakrishnan, Richards, Skånes, Steffen, Stone, Svedin, Veldkamp, Vogel and Xu2001). At the same time, it has also been found that reducing poverty rates can have positive or negative effects on degradation, depending on the initial levels of development (Crespo-Cuaresma and Heger, Reference Crespo-Cuaresma and Heger2019). Regardless of the direction of the bias, using standard ordinary least squares (OLS) estimation would thus lead to biased coefficient estimates.
To overcome the methodological challenges arising from the endogenous relationship of land, income and poverty, a simultaneous equation model with instrumental variables is implemented. For vegetation quality, a panel regression is specified as time series are available for both NPP and rainfall data. However, the data for topsoil carbon is time-invariant. Therefore, a cross-sectional regression using the most recent observations per province is estimated. Similarly, the dataset provides variation over time with respect to poverty, but regional GDPPC is measured at one point in time only, restricting us to cross-sectional specifications in these cases.
2.2.1 Panel specification of land quality and poverty
The panel regression to infer the effects of land quality on poverty is specified as:

where i denotes province, j the country, and t the year. The dependent variable POV measures the poverty headcount rate. The explanatory variables are collected in the matrix X. The specific set of explanatory variables varies across specifications. In the full specification, X contains NPP, the five land use categories, population, country fixed effects,Footnote 6 year fixed effects and country-time trends.
2.2.2 Cross-sectional specification of land quality, poverty and income
Model (1) identifies the effect of the environment exploiting variation over time. However, GDP per capita and topsoil carbon content data are time-invariant. Thus, the effects of soil fertility can only be assessed using spatial variation. The same holds true for the effects of vegetation quality on GDP.

where i denotes the province and j the country. Y is either a vector of GDP per capita or poverty headcount ratios. X contains a set of control variables that includes top soil carbon, land use shares, population, a ruggedness index, road density, and country and year fixed effectsFootnote 7 in the full specification. ${\epsilon _{i,j}}$ refers to the error term. Robust standard errors are used in all specifications. NPP, GDP per capita, top soil carbon, population, ruggedness, road density and precipitation enter the model after a log-transformation for interpretability of the estimates.
2.2.3 Instrumental variables approach
Instrumental variable estimation is employed to overcome the endogeneity between vegetation quality and soil fertility and poverty. Rainfall is used as a source of exogenous variation for NPP and topsoil carbon. Nevertheless, there has been a debate on the validity of rainfall as an external instrument. After careful review of the pertinent literature, we conclude that rainfall is a viable instrument for our research design as rainfall is a strong determinant of above- and below-ground biomass, meets the exclusion criterion, and is as-if randomly assigned. More details are discussed below.
Rainfall is one of the most crucial determinants of vegetation quality and biomass productivity (for evidence, see pertinent agronomic literature such as Vlam et al., Reference Vlam, Baker, Bunyavejchewin and Zuidema2014, and Schippers et al., Reference Schippers, Sterck, Vlam and Zuidema2015). Precipitation influences soil moisture and above-ground biomass by affecting seed germination, seedling growth, and plant phenology (see, e.g., Kang et al., Reference Kang, Li, Liu, Xu, Peng, Wang, Zhu and Guo2013; Liu et al., Reference Liu, Zhou, Ju, Wang, Wu, He and Zhu2014; Yan et al., Reference Yan, Wang, Lu, Yu, Zhu, Myneni, Liu and Shugart2014). Furthermore, precipitation is also the main input factor for soil fertility: the greater the biomass production resulting from more rainfall, the more residues are produced, which in turn leads to more potential food for soil biotas. Testament to the major importance of rainfall for soil fertility (and in particular for soil organic carbon) is the fact that precipitation is the main input factor in Revised Universal Soil Loss Equation models (see, e.g., Angulo-Martínez and Beguería, Reference Angulo-Martínez and Beguería2009; Hernando and Romana, Reference Hernando and Romana2015) and in the GIS-based Universal Soil Loss model (Angima et al., Reference Angima, Stott, O'neill, Ong and Weesies2003; Lufafa et al., Reference Lufafa, Tenywa, Isabirye, Majaliwa and Woomer2003; Fu et al., Reference Fu, Zhao, Chen, Zhang, Lü, Gulinck and Poesen2005).
We argue that if there is a fitting case for using rainfall as an IV, using it for isolating the exogenous variation in vegetation and soil quality is one of the most promising candidates. Rainfall is extremely closely linked to the treatment variables (vegetation growth and soil fertility) in our study.Footnote 8 In fact, rainfall is perhaps the most important determinant of plant growth, particularly so in areas with little irrigation.Footnote 9 The economies of low-income and middle-income areas are particularly dependent on the primary sector such as agriculture and forestry. Increased quantities of rainfall increase crop yields and the environmental income from surrounding ecosystems, a mechanism which ought to be especially strong in Sub-Saharan Africa, where only 4 per cent of area cultivated is equipped for irrigation as compared to, for instance, 28 per cent in North Africa (see You et al., Reference You, Ringler, Wood-Sichra, Robertson, Wood, Zhu, Nelson, Guo and Sun2011).
An influential article by Sarsons (Reference Sarsons2015) casts doubts on the validity of rainfall as an instrument for conflict. She showed that in irrigated areas, rainfall shocks are a weaker predictor for income changes, but nevertheless remain a significant predictor of conflict, indicating that there are channels other than income through which rainfall affects conflict.Footnote 10 Note that this criticism does not directly apply to our research design, as we use rainfall as an instrument for soil fertility and vegetation quality (and then investigate its effects on income). However, her larger point also remains a valid criticism of our identification strategy, as she suggests that income may be affected by rainfall through channels outside of agricultural, forestry and other environmental reasons.
One major concern with using rainfall as an IV for income (poverty) is that extreme rainfall events (such as flooding) can lead to the destruction of property and affect poverty outside of the channels of soil fertility and vegetation changes, therefore violating the exclusion restriction. For example, floods may affect transportation and the ability to organize. A similar concern applies to droughts, which might kill livestock due to heat stress. We overcome the flooding and drought identification threat by excluding outlier rainfall events in separate specifications below.Footnote 11 Furthermore, by including road density and ruggedness we control for the transportation identification threat.Footnote 12 A suggestive empirical indication that this exclusion restriction holds is that the OLS specifications below indicate that rainfall is not a statistically significant predictor of poverty rates or GDP per capita when controlling for environmental quality.
Other identification compromising channels that Sarsons (Reference Sarsons2015) describes are migration, where farmers move from rain-fed to dam-fed provinces, creating a conflict over scarce land. She also describes spillover effects as another channel that may violate the exclusion restriction. Her point is that violence may propagate from a violence rain-fed to an initially non-violent dam-fed province, explaining why rainfall also affects violence in dam-fed provinces. This criticism may also extend to using income as an outcome variable, as for example, conflict also affects income (see, e.g., Blattman and Miguel, Reference Blattman and Miguel2010).
To overcome this issue, we split our sample based on irrigation to separately analyze relatively well-irrigated and relatively badly-irrigated areas. Similarly, Sarsons (Reference Sarsons2015) discussed dam-fed provinces and rain-fed provinces separately. Note that Sarsons (Reference Sarsons2015) shows that conflict is affected by rainfall regardless of irrigation as evidence for a violated exclusion restriction. On the contrary, we find that irrigation actually explains a significant proportion of the environment–poverty elasticity. This points in the direction of an upholding exclusion restriction.
Finally, it is worth mentioning that rainfall is randomly assigned as weather is an exogenous event in each province. Even if climate change, which is clearly affected by development, alters rainfall patterns, it does so on a global scale, and it is hardly attributable to a given province's actions alone, therefore not violating the as-if random assignment assumption.
3. Results
We detail three main findings: First, vegetation quality and soil fertility have significant and sizeable poverty alleviating effects, particularly in rural areas and especially in Sub-Saharan Africa. Second, improving soil and vegetation quality is pro-poor: poverty rates in areas with high poverty headcounts are significantly more strongly affected by improvements in soil and vegetation than areas with a relatively low poverty incidence. Finally, the dependence of rural areas on rainfall-induced changes in vegetation quality and soil fertility is reduced by irrigation. We thus conclude that irrigation systems have significant impacts for making the poor resilient to the vagaries of weather and climate.
3.1 Panel fixed effects evidence
Figure 1 shows a strong correlation between vegetation quality and poverty. The graph shows the conditional relationship of NPP and poverty after controlling for other possible predictors of poverty. It seems obvious that increasing vegetation quality is associated with accelerated poverty reduction.

Figure 1. The relationship between changes in vegetation and poverty reduction.
However, from this descriptive analysis it does not automatically follow that vegetation quality causally influences poverty reduction for the average province in our sample. Table 2 shows that despite the OLS specification (1) being significant, the global IV specification (4) is not. However, vegetation quality seems to be much more important for more rural areas, as one would expect, as seen in specification (5) and (6).Footnote 13 The panel results show that an increase in vegetation quality (NPP) by 10 per cent in rural areas reduces poverty rates by around 0.7 percentage points. In Sub-Saharan Africa, the effects were even larger, such that a 10 per cent increase in NPP resulted in a 1.2 percentage point increase in poverty rates. The reasons for such significant and sizeable effects in Sub-Saharan Africa and rural areas likely has to do with livelihoods there being comparably more dependent on vegetation quality and soil fertility. For instance, Barrios et al. (Reference Barrios, Bertinelli and Strobl2010) have shown that unlike in other continents, economic growth is strongly dependent on rainfall in Africa. Moreover, Alene et al. (Reference Alene, Abdoulaye, Rusike, Labarta, Creamer, del Río, Ceballos and Becerra2018) find that soil fertility management had the largest effect on poverty reduction and economic growth in Africa. However, the estimates for rural Sub-Saharan Africa should be taken with a grain of salt as the comparably low sample size results in statistical limitations with respect to inferring the exact effect size. Introducing controls makes the analysis even less statistically powered, which is the reason why the rural Sub-Saharan African (SSA) specifications are in fact excluded from the specifications below.
Table 2. Second stage – the effect of NPP on poverty

Notes: Robust standard errors in parentheses.
*** p < 0.01.
In general, the first stage regressions show a very strong relationship between vegetation quality and poverty. Precipitation explains more than 80 per cent of the variation of NPP as shown in table A3 in the online appendix.
Table 3 shows a specification including a set of additional control variables. All estimated coefficients are in line with our priors. Note that all effects other than those of vegetation quality are not ‘exogenized’, thus they may not be interpreted as causal. That said, important lessons can be drawn from correlations as well. For example, road density, a proxy for infrastructural development, is an important and strong predictor of poverty reduction. This is a long-established and well-known finding in development economics (see, e.g., Jacoby, Reference Jacoby2000; Gibson and Rozelle, Reference Gibson and Rozelle2003; Jacoby and Minten, Reference Jacoby and Minten2009; Khandker et al., Reference Khandker, Bakht and Koolwal2009). For an overview of possible theoretical channels, see Brenneman and Kerf (Reference Brenneman and Kerf2002). Similar effects can be seen with respect to urbanization (people moving to cities), another variable that is consistently correlated with poverty reduction in the development economics literature (see, e.g., Christiaensen et al., Reference Christiaensen, De Weerdt and Todo2013; Arouri et al., Reference Arouri, Ben Youssef and Nguyen2017). Ruggedness is statistically positively related to poverty rates, suggesting that rougher terrains possibly make it harder to escape poverty. The direction of control variable coefficients is generally in line with the literature, which gives confidence in the quality of the data and empirical approach.
Table 3. Second stage – the effect of NPP on poverty including controls

Notes: Robust standard errors in parentheses.
*** p < 0.01, ** p < 0.05, * p < 0.1.
The main caveat of the presented analysis is that we are not able to control for province-level fixed effects due to data availability, as elaborated in footnote 6. Not being able to control for province-level fixed effects implies that we cannot rule out that the presented results are partially due to within-country province heterogeneity. While including several control variables allows us to rule out the impact of several important within-country factors such as land cover and land use, it does not allow us to rule out any possible effect that would come from time-invariant within-country heterogeneity.
3.2 Cross-sectional findings
Figure 2 depicts a negative relationship between poverty and soil quality. Poverty headcount rates are particularly high in rural regions with low soil quality.
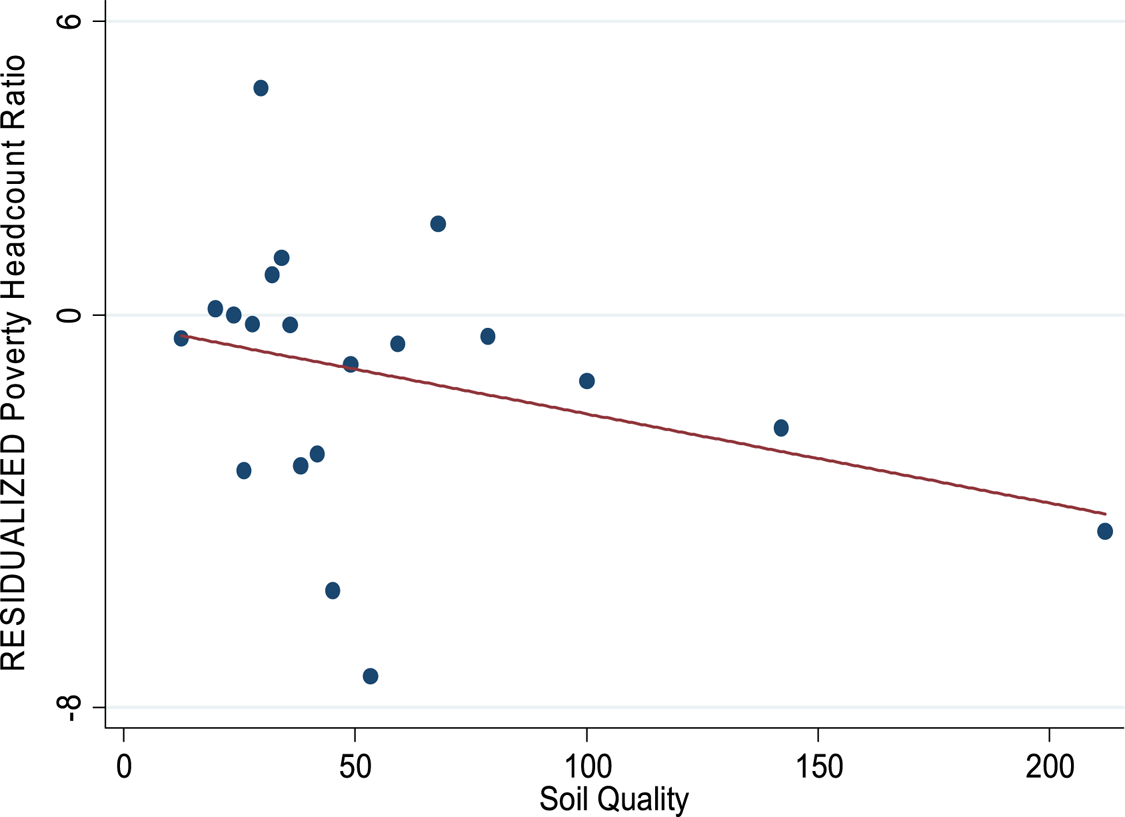
Figure 2. Poverty and soil quality in rural areas.
The negative relationship between soil fertility and poverty is significant in the specifications that isolate the exogenous effects of top soil on poverty (table 4). An increase in top soil carbon content of 10 per cent reduces the poverty headcount ratio by around two to three percentage points (columns 3 and 4) in the rural sample. The effects are especially large in rural Sub-Saharan Africa, where a 10 per cent increase in soil fertility results in a roughly four percentage points reduction in poverty rates in the baseline specification (column 5). As mentioned before, these specifications are restricted to cross-section information due to the unavailability of time-variant soil fertility and subnational GDP measures.
Table 4. Second stage – the effect of top soil carbon on poverty

Notes: Robust standard errors in parentheses.
*** p < 0.01.
The significant results we estimate for the effect of soil carbon on poverty are robust with respect to the specific welfare measure chosen. We repeat the above analysis using GDP per capita as the outcome variable instead of poverty headcount rates and find that similar patterns hold. An increase in topsoil carbon by 10 per cent results in an increased GDP per capita of 0.2 per cent in rural areas (see columns 3 and 4 of table 5). The first stage regressions estimating the effect of precipitation on top soil carbon are provided in table A4 in the online appendix.
Table 5. Second stage – the effect of top soil carbon on GDP per capita

Notes: Robust standard errors in parentheses.
*** p < 0.01, ** p < 0.05, * p < 0.1.
The significant effects of soil fertility on poverty and GDP per capita are, moreover, robust to the inclusion of the set of control variables already discussed in the panel specification for NPP. The full specifications including land use categories, road density and ruggedness are found in tables A5 and A6 in the online appendix. In addition, we included a measure of soil type as a control variable, which is particularly important as there are significant variations in soil types within countries. Soil types range from soils with relatively rich soil organic carbon (such as Histosols) to soils with practically no soil carbon (such as Entisols). Clearly it is important to control for the specific type of soil as this is one of the main immutable factors when it comes to soil organic carbon formation (for a taxonomy of soils and an exposition of their properties, see USDA, 1999).
3.3 Additional findings
As discussed earlier, irrigation systems in Sub-Saharan Africa are much less developed than elsewhere, making the region more vulnerable to the vagaries of rainfall (You et al., Reference You, Ringler, Wood-Sichra, Robertson, Wood, Zhu, Nelson, Guo and Sun2011). We therefore further investigate the role of irrigation and its effects on the environment–poverty elasticity, directly. Following the criticism brought forward in Sarsons (Reference Sarsons2015), we run split sample regressions based on irrigation prevalence in the provinces under analysis. The results are shown in table 6. The estimates suggest that the effects of vegetation quality on poverty are indeed driven by the less irrigated areas in the sample. This suggests that irrigation systems are effective in increasing rural farmers' resilience to weather shocks.Footnote 14
Table 6. The effect of NPP on poverty in areas with high and low levels of irrigation

Notes: Robust standard errors in parentheses.
The sample is split according to the average proportion of area equipped for irrigation to area according to version 5 of the Global Map of Irrigation Areas published by the Food and Agriculture Organization of the United Nations.
*** p < 0.01.
In an additional exercise, we analyze the degree of poverty alleviation along the income distribution using a split sample regression with areas below and above the observed median poverty rate. Tables 7 and 8 show that for both the NPP and the soil organic carbon specifications, the poverty rates in poorer places dropped much more as a reaction to improved vegetation quality and soil fertility. This is indicated by estimated coefficients that are on the order of two to nine times larger than the coefficient for less poor areas.
Table 7. Second stage – the effect of NPP on poverty in high / low poverty areas

Notes: Robust standard errors in parentheses.
*** p < 0.01.
Table 8. Second stage – the effect of top soil carbon on poverty in high/low poverty areas

Notes: Robust standard errors in parentheses.
*** p < 0.01, ** p < 0.05.
To account for the possibility that the results could be driven by one explicit measurement of vegetation quality, all specifications are estimated with a different satellite-based indicator, the Normalized Density Vegetation Index. In addition, some spatial econometrics exercises are carried out. We specify spatial autoregressive models to account for the possibility of spatial dependence of poverty and income. In addition, we run Moran's I tests on the residuals of the second stage regressions of selected IV specifications. The conclusions drawn remain unchanged.Footnote 15
4. Conclusion and discussion
In this article, we analyze the relationship of vegetation quality and soil fertility with income and poverty on a global scale. To overcome potential endogeneity issues, the exogenous variation of two environmental variables is isolated using rainfall data in an instrumental variable approach.
As expected, we find evidence that building roads and urbanization is associated with reductions in poverty rates, as previous literature has suggested. What has not been shown conclusively so far is whether in-situ improvements in environmental quality significantly reduce poverty. Several authors have concluded that it does not. Okwi et al. (Reference Okwi, Ndeng'e, Kristjanson, Arunga, Notenbaert, Omolo, Henninger, Benson, Kariuki and Owuor2007) concludes that if all of Kenya's soil was raised to its highest quality, only a one percentage point reduction in poverty rates would ensue. Wantchekon and Stanig (Reference Wantchekon and Stanig2015) go even farther and conclude that in Sub-Sharan Africa, good soil may be a hindrance to poverty reduction.
We find that vegetation quality and soil fertility are important drivers for poverty alleviation in rural areas and Sub-Saharan Africa. Soil fertility and vegetation quality not only have significant and sizeable effects on poverty rates but also on GDP per capita. These significant environment–poverty elasticities are especially relevant for low income households that draw a larger share of their income from natural resources and the environment (Wunder, Reference Wunder2015). Moreover, we found that the effects of vegetation quality and soil fertility on poverty are stronger for poorer places, suggesting that environmental improvements are pro-poor. Finally, the availability of irrigation systems plays a major role when explaining the environment–poverty nexus. The results in this article are strongly driven by less irrigated areas, suggesting that irrigation systems have large impacts in making poor areas less dependent on weather fluctuations.
Supplementary material
The supplementary material for this article can be found at https://doi.org/10.1017/S1355770X20000066


