NOMENCLATURE
- AR
-
aspect ratio
- cr
-
root chord of winglet
- CD
-
drag coefficient
- C Dcruise
-
high-speed cruise drag coefficient
- C Di
-
induced drag coefficient
- CL
-
lift coefficient
- e
-
span efficiency factor
- g
-
acceleration due to gravity
- Mr
-
wing root bending moment
- r
-
radius
- S
-
projected wing area
- Vavg
-
average cross-country speed
- Vcruise
-
cruise speed
- wclimb
-
climb rate
- wsink
-
sink rate
- w sink, circ
-
circling sink rate
- W
-
weight
Greek Symbols
- ρ
-
atmospheric density
- ε
-
twist angle
- λ
-
taper ratio
- Λ LE
-
leading-edge sweep
1.0 INTRODUCTION
Competition sailplanes provide a unique challenge in aircraft design. The sailplane must perform well during inter-thermal cruise and during slow-speed circling flight in thermals. The design of the sailplane must be a compromise between these two flight conditions. During low-speed circling flight at elevated load factors, sailplanes operate at high lift coefficients and induced drag is the dominant source of drag. It is here that winglets provide the most benefit. At high speeds, or comparatively low lift coefficients, viscous drag is dominant and the drag penalties of the winglets are increased.
This trade-off has traditionally made sailplane winglet design a laborious process that requires a skilled designer. In addition, a winglet design that works for one sailplane is not guaranteed to provide such a benefit on another. Each sailplane needs a bespoke winglet design. Streamlining the design process by using an optimisation algorithm with a performance model can eliminate much of the burden from the designer. Such an optimisation process is explored in this paper.
1.1 Cross-country theory
The objective in modern sailplane competitions is maximising the average cross-country speed. A brief overview of cross-country theory, specifically the average cross-country speed, is given here, with a more in-depth explanation provided by Thomas(Reference Thomas9). As shown in Fig. 1, cross-country soaring flights typically can be decomposed into a cruise and a thermaling segment. During the cruise segment from point A to B, the glider covers the distance, d, in gliding flight. In general, the cruise occurs at relatively high speeds and low lift coefficients. The required altitude, h, is replenished during climbing flight, while circling in a thermal. The climb performance depends on the thermal strength and distribution, as well as on the glider's low speed performance near stall. The average cross-country speed, Vavg , is given by the distance covered during cruise, d, and the total time that is required to cruise and climb. Subsequently, the average depends on straight flight performance as well as the climb rate that the glider can realise during circling flight in a thermal.

Figure 1. Basic segment of cross-country flight(Reference Thomas9).
The achievable climb rate, wclimb , is given by the difference of the thermal strength and the sink rate of the glider during circling flight, as shown in Fig. 2. In this example, the vertical air mass velocity of the thermal, wthermal , decreases in magnitude in a parabolic manner with increasing distance, r, from the thermal centre. Further shown is the envelope of minimum sink rates of a given glider, wsink , for different circling-flight radii. For each circling-flight radius, sink rates can be estimated using the straight-flight performance:
 $$\begin{equation}
\centering w_{sink, circl} = \frac{C_D}{C_L^{3/2}}\sqrt{\frac{2W}{\rho S}}\bigg [1-\bigg ({\frac{2W}{\rho SrgC_L}\bigg )}\bigg ]^{-3/4},
\end{equation}$$
$$\begin{equation}
\centering w_{sink, circl} = \frac{C_D}{C_L^{3/2}}\sqrt{\frac{2W}{\rho S}}\bigg [1-\bigg ({\frac{2W}{\rho SrgC_L}\bigg )}\bigg ]^{-3/4},
\end{equation}$$
where the lift and drag coefficients, CL and CD , are based on the straight flight performance, W is the weight, S the wing area, and ρ is the air density. For given radius, r, the sink rate of Equation (1) has a minimum value for a particular lift coefficient. The difference of the envelope of these minimum sink rates and the vertical air mass velocity of the thermal results in a maximum achievable climb rate for a particular thermal. In the case of Fig. 2, the maximum achievable climb rate is approximately 3m/s at a circling-flight radius of about 47m.

Figure 2. Determining wclimb .
Based on the achievable climb rate, the average cross-country speed can be found graphically using the fight-speed polar, as shown in Fig. 3. The line drawn from the maximum climb rate, wclimb , on the vertical speed axis to the flight polar at cruise speed, Vcruise , yields the average cross-country speed, Vavg , at the intersection with the horizontal axis. This relationship can also be expressed mathematically:
 $$\begin{equation}
\centering V_{avg} = V_{cruise}\frac{w_{climb}}{w_{climb}+w_{sink}}
\end{equation}$$
$$\begin{equation}
\centering V_{avg} = V_{cruise}\frac{w_{climb}}{w_{climb}+w_{sink}}
\end{equation}$$
It should be noted that the maximum average cross-country speed, V max, avg , is determined using the tangent from the maximum achievable climb rate, w climb, max , to the speed polar at the optimum cruise speed, V cruise, opt , as shown in Fig. 3.
Figure 3. Graphical solution of Vavg and Vcruise .
The gliding segment of cross-country flight is performed at a higher speed, and thereby at a lower lift coefficient. In this phase, parasitic drag dominates and the addition of winglets can easily be detrimental to the performance. The thermaling segment, however, is performed at lower speeds, which leads to a lift coefficient typically near maximum(Reference Thomas9). It is in this phase of flight where induced drag generally accounts for more than half of the total drag, and the addition of winglets can provide benefits. Through reducing induced drag, winglets reduce the circling sink rate, which improves the attainable climb rate in thermals. Depending on the high-speed penalty of winglets, the improved climb rate can ultimately result in a higher cross-country speed.
Figure 4 provides an example of the low-speed advantages and higher-speed disadvantages of winglets when applied to the ASW-19 sailplane. The point at which the winglets begin to penalise performance with increasing velocity is known as the crossover point, seen at approximately 115km/h. It is worthwhile to choose a crossover speed that is sufficiently high, to limit any performance penalty when flying faster than the optimal speed, w cruise, opt , as for example, pilots frequently do during competitions for tactical reason.

Figure 4. Speed polars of ASW-19 with and without winglets(Reference Masak5).
The past 20 years has seen large advances in sailplane winglet design, as it is now known that winglets can provide a net benefit, even with the parasitic drag penalty at cruise conditions. Nowadays, most modern sailplanes come equipped with winglets. Maughmer(Reference Maughmer7) provides an excellent in-depth review regarding the traditional sailplane winglet design process, which is typically cumbersome and heavily relies on trial and error.
As an alternative to the traditional trial-and-error approach, an optimisation algorithm-based method combined with a rapid performance model promises a low-cost design approach, enabling the analysis of a large number of winglets and their effect on average cross-country speed. This process was used to design winglets for the Standard Cirrus such that the average cross-country speed was maximised over several thermal core-strengths. The high-speed cruise drag coefficient and the wing root bending moment were also minimised with the optimisation, to ensure the crossover point was sufficiently high and the addition of the winglets was structurally feasible. The end results of the optimisation algorithm-based approach were compared to traditionally designed winglets for the same sailplane, which were designed to maximise the average cross-country speed over a range of airspeeds. The purpose was to create an automated design process that produces results comparable to traditional designs.
Kody et al(Reference Kody, Bramesfeld and Schmitz4) performed winglet optimisation for the Janus B high-performance sailplane, which has no commercially available winglet designs. The optimisation was performed in several stages. First, a single-objective optimisation was performed to reduce the total drag on the Janus B sailplane at high-speed cruise with the addition of winglets. Second, a multi-objective optimisation focused on a cruise drag and thermal drag reduction. It was found that, in order for the optimisation process to come up with structurally feasible solutions, the addition of a wing-bending analysis had to be incorporated as an objective.
2.0 OPTIMISATION PROCESS AND NUMERICAL METHODS
The optimiser chosen for the process was the Multi-Objective Evolutionary Algorithm (MOEA) included in the MATLAB Global Optimization Toolbox. As an evolutionary algorithm, it works toward an optimal solution by creating populations and determining the best, or elite, individuals in that population. These individuals become the parents for the next generation, and the process continues(6). With each generation, the population moves closer and closer to an optimal solution. The algorithm is multi-objective, so rather than a simple single optimal solution, there is a range of optimal solutions. This is due to each solution weighing the various objectives differently. These solutions cannot be optimised further without adversely affecting at least one other objective(Reference Kody, Bramesfeld and Schmitz4). This set of optimal solutions is known as a Pareto front.
The MOEA used in the winglet optimisation process is a controlled elitist genetic algorithm, favouring elite individuals in a population yet also understanding the need for a diversity(6). To maintain a diverse population, and thereby a diverse Pareto front, the algorithm will select sub-optimal individuals to carry forward to the next generation, based on their potential to increase the diversity of the population(6). The algorithm also selects individuals with a larger distance between them to mate(Reference Deb2).
2.1 FreeWake
The optimisation process is centred around the performance model, FreeWake, a potential-flow solver(Reference Bramesfeld and Maughmer1), which was extended with viscous corrections to account for profile drag and stall(Reference Kody and Bramesfeld3). The higher-order potential flow method models the bound circulation as a second-order spline in the span-wise direction and the wake vorticity as a continuous vortex sheet. The model is used to determine the span-wise lift distribution and the induced drag. With the induced drag of the wing known, two-dimensional aerofoil data is used to determine profile drag of the wing and tail, as well as to determine if a section of the wing has stalled. If a section has stalled, the lift coefficient of that section is set to a fraction of the two-dimensional maximum lift coefficient. The drag from the empennage is estimated in a similar manner to the wing drag. Fuselage drag is accounted for by using the wetted area of the fuselage, as well as an estimated transition point, to determine the skin friction drag. Interference drag is accounted for by adding 10% to the total drag of the aircraft.
Though it is possible to use a relaxed wake model with FreeWake, a fixed wake model was chosen as it is computationally faster. The difference between the induced drag values for relaxed and fixed wake models for the results presented in this paper were in the order of a hundredth of a percent.
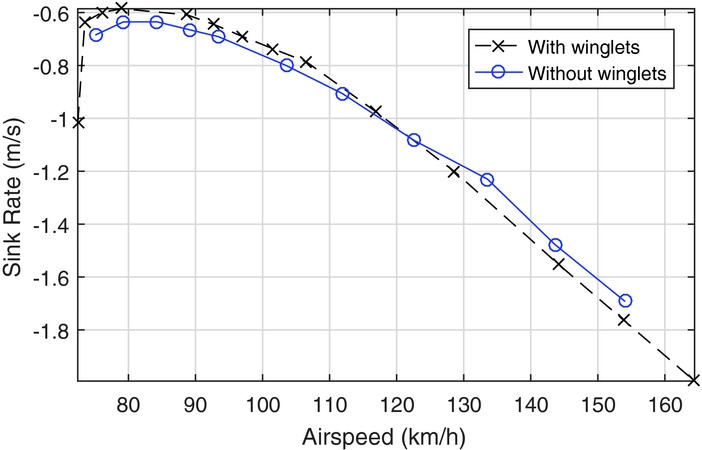
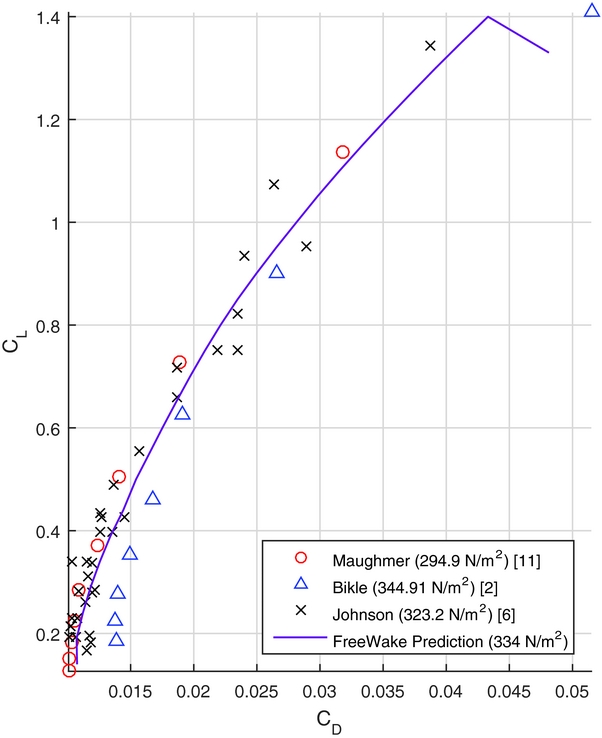
Figures 5 and 6 provide a comparison of the FreeWake predictions with other theoretical and experimental methods. The data are for the Standard Cirrus without winglets. For example, the Maughmer(Reference Maughmer8) data are based on prediction results that were used for the design of the original winglet design. The experimental data were derived measuring steady-state descent rates. The speed-polar data were corrected for equivalent wing loadings. Overall the data agree quite well. Although difficult to assess, FreeWake predicts similar stall conditions as the flight tests indicate. Any differences at high speed are most likely due to experimental challenges in this flight regime.

Figure 5. CL vs CD .
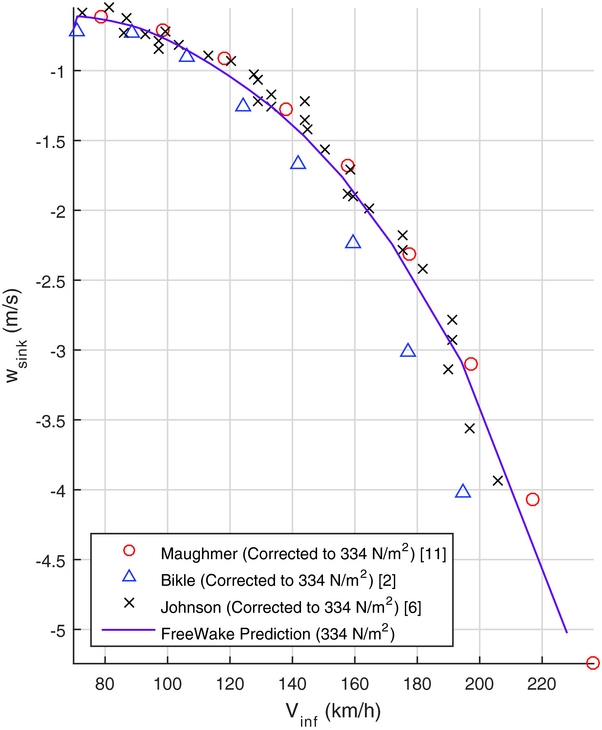
Figure 6. Sink rate vs airspeed.
2.2 Demonstration of optimisation process
The proper functioning of the optimisation process was established using a simple comparison to the analytical solution of the elliptically loaded wing. A planar wing with a straight leading edge, fixed 8m span and 1m root chord was optimised to maximise the span efficiency factor, given by:
 $$\begin{equation}
\centering e = \frac{C_L^2}{\pi ARC_{D_{i}}}
\end{equation}$$
$$\begin{equation}
\centering e = \frac{C_L^2}{\pi ARC_{D_{i}}}
\end{equation}$$
Equation (3) is solved using the predicted C Di and CL from FreeWake. The classical analytical solution of this yields an elliptical chord distribution. The result from the numerical optimisation process is shown in Figs 7 and 8. It can be seen that the optimisation process arrived at an elliptical circulation distribution through an approximate elliptical chord distribution, as four panels were used to define the half-span. FreeWake uses a second-order spline to represent the bound circulation in the span-wise direction. Despite small differences near the wing tip, the computational results agree well with the analytical solution.
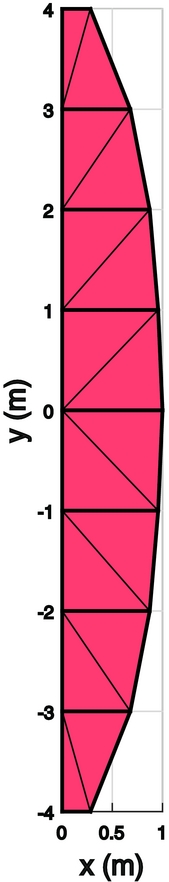
Figure 7. Wing geometry.
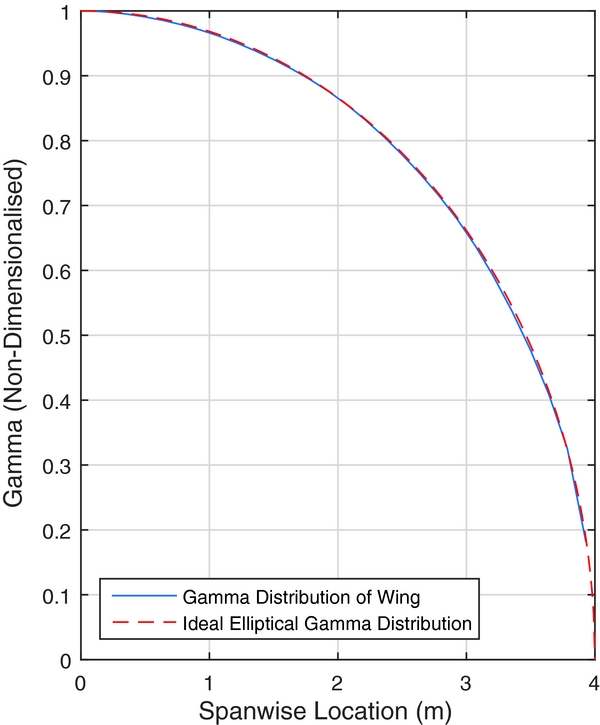
Figure 8. Non-dimensionalised circulation distribution.
2.2.1 Winglet optimisation methodology
A typical winglet is shown in Fig. 9. For the winglet optimisation process, three panels were chosen to model the geometry. This allowed for one transition panel from the wing to winglet, and two panels for the program to explore main winglet geometry. The design variables for the optimisation process were simply the geometry of the winglet. Each panel in FreeWake was defined by a pair of (x, y, z) coordinates tracing the leading edge, which determined the sweep, cant and height of each panel. In addition, each panel could have been given a twist and taper. A summary of the design variables are outlined in Table 1, and an example of winglet geometry from the optimisation process is shown in Fig. 10, with the various panels labelled. The Standard Cirrus parameters used in FreeWake are listed in Table 2.

Figure 9. Winglet geometry(Reference Maughmer7).
Figure 10. Winglet geometry in the optimisation process.
Table 1 Design variables for optimisation
Table 2 Standard Cirrus parameters
Certain constraints were set regarding the design variables. First, the Standard Cirrus competes in the standard class, which is a competition class that is limited to a 15m wingspan and no trailing-edge flaps. Therefore, the overall wingspan of the wing with the newly designed winglet cannot exceed 15m. Secondly, a maximum winglet height of 0.6 m was set. As winglet area increases, the parasitic drag penalty becomes too large and lowers the crossover point to lower velocities. Constraining height to a reasonable range allows for a quicker optimisation. Each winglet panel was only allowed to have a taper ratio of one or less. The leading edge was only allowed to sweep rearwards and cant outwards. To make the optimisation less computationally intense, the trailing edge of the winglet was fixed to be vertical.
The optimisation process was multi-objective. The objectives included maximising cross-country speeds at varying thermal strengths, namely 2, 5 and 8m/s thermal core strengths. The optimiser also worked to minimise the total drag coefficient at a high speed cruise of 100Kn, in order to move the crossover point to a high-enough velocity that the winglets were not a detriment across the entire flight envelope. This is in accordance with the methodology of Maughmer(Reference Maughmer7) and Kody et al(Reference Kody, Bramesfeld and Schmitz4). Lastly, the optimiser minimised the additional bending moment at the wing root. This was done to ensure the final chosen designs can be fitted to the Standard Cirrus wing without having to add to the structure of the existing wing due to the additional flight loads.
3.0 RESULTS
From the resultant Pareto front, several winglet geometries were chosen for further investigations. Table 3 provides a summary of the winglet geometries. Three designs were chosen, each corresponding to the optimal solution for a core thermal strength. That is, winglet designs 1 through 3 in Figs 12 through 14 provided the maximum cross-country speeds corresponding to thermal strengths of 2, 5 and 8m/s, respectively. Figure 11 shows the traditionally designed winglet, by Maughmer(Reference Maughmer7). Overall, the new designs are slightly shorter than the Maughmer design, which is a consequence of the height constraint. Winglets 2 and 3 have very similar planforms but varied twist distributions.

Figure 11. Traditionally designed winglet(Reference Maughmer7).

Figure 12. Winglet design 1.

Figure 13. Winglet design 2.
Figure 14. Winglet design 3.
Table 3 Winglet panel geometries
Table 4 provides results for the high-speed cruise drag coefficient and the wing root bending moment Mr . It can be seen that, while the root bending moment does increase by approximately 0.5% with the addition of winglets, this slight increase indicates that the existing structure is probably sufficient for the additional load due to the winglet. This is likely due to the restricted height of the winglets, established as a constraint in the optimisation.
Table 4 Winglet performance metrics

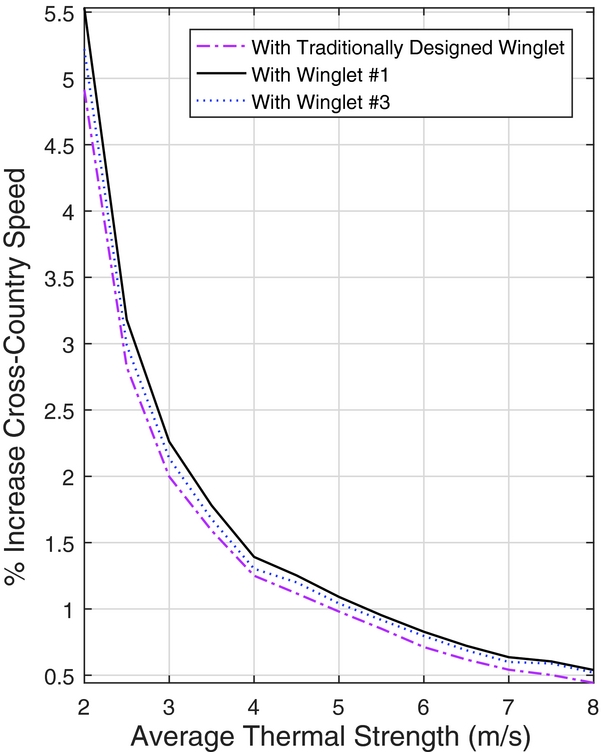
The percent change in the average cross-country speeds is shown in Fig. 15, with respect to a Standard Cirrus with no winglets. Winglet designs 1 and 2 provide the maximum benefit in the lower-strength thermals, providing very similar results across the range of thermal strengths. Winglet 3 provides the best benefit at higher thermal strengths by a small margin, however the benefit is outweighed by Winglets 1 and 2 superior performance over a broader range. Figure 15 also attributes a higher cross-country speed across the range of thermal strengths for all of the optimised winglets when compared to the traditional design.
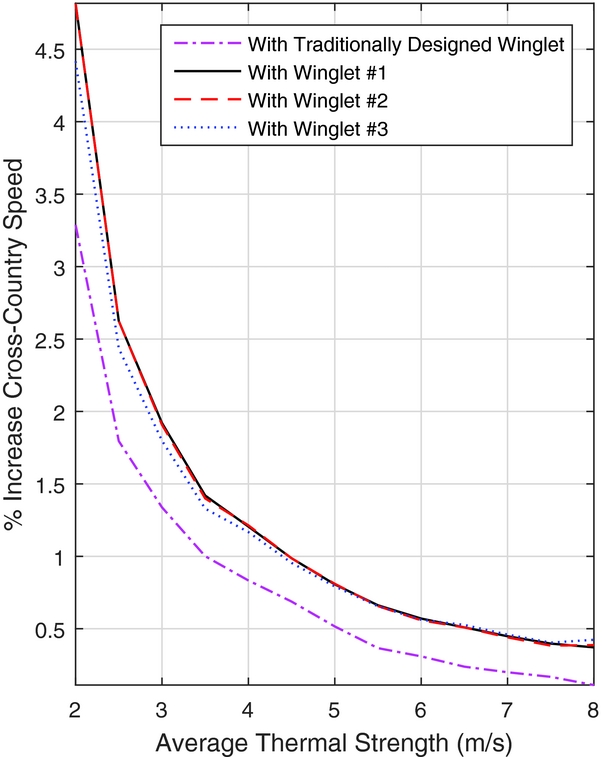
Figure 15. Change in Vavg with respect to no-winglet case.
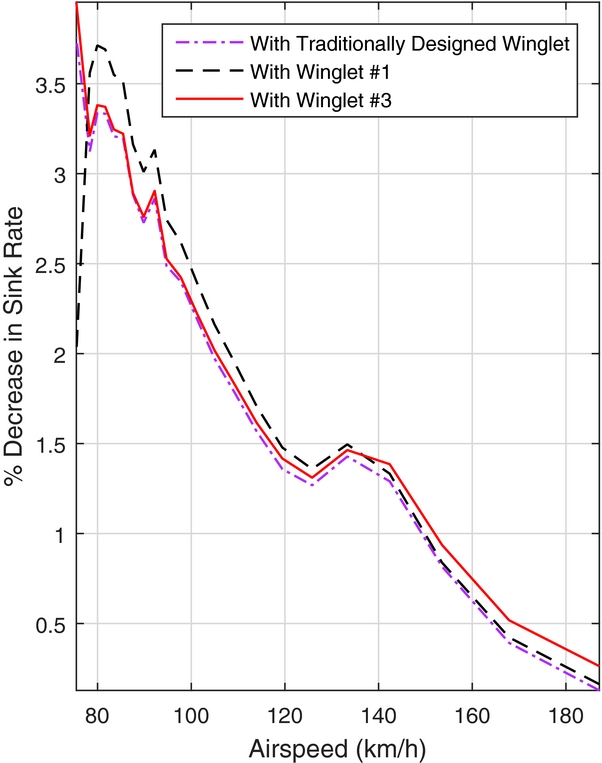
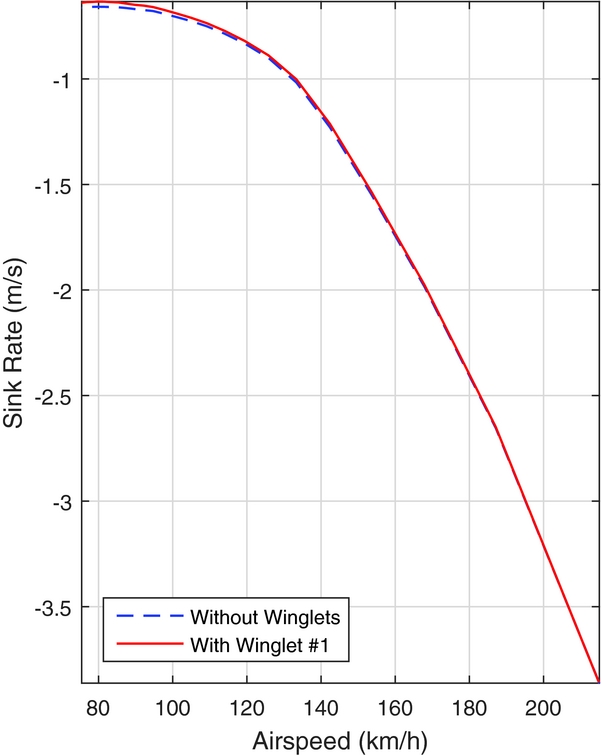
In Fig. 16, the percent change in sink rate, with respect to the sailplane without winglets, can be seen for the traditionally designed winglet, as well as Winglets 1 and 3 from the optimisation. As the percent change in sink rate never exceeds zero across the speed range, no crossover point exists in the flight envelope of the Standard Cirrus for Winglets 1 and 3, as well as the traditionally designed winglet; they provide a benefit over the entire speed range. This is further illustrated in Fig. 17, in which the sink rate of Winglet 1 approaches the sink rate of the Standard Cirrus without winglets as the speed increases, yet there is no crossover until approximately 214km/h, which is beyond the never-exceed speed of the Standard Cirrus of 202km/h.

Figure 16. Decrease in wsink with respect to no-winglet case.

Figure 17. Sink rate vs airspeed with and without Winglet 2.
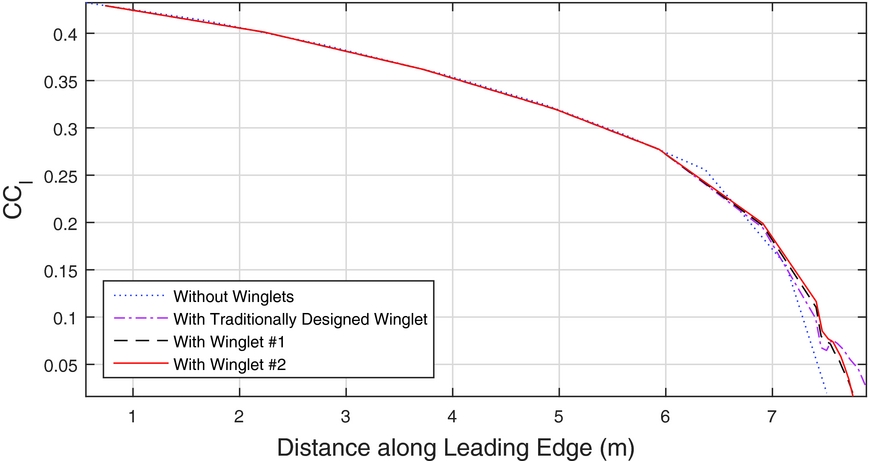
As well as illustrating the lack of a crossover point for the traditionally designed winglet and Winglets 1 and 3, Fig. 16 also illustrates the differences between the three designs. While the percent change in sink rate performance of Winglets 1 and 3 are very similar at the lower airspeeds, Winglet 1 does have a slight advantage at the higher airspeeds. Both Winglets 1 and 3 have a larger impact on reducing the sink rate than the traditionally designed winglet in the lower half of the airspeed range. Figure 18 shows the span-wise lift distributions. Compared to the base wing without winglets, the winglets add significantly more lift toward the wing tip, which explains the higher root-bending moment. The higher tip loading results in more effective ailerons, but the improvement in handling qualities is a benefit of winglets, which is difficult to assess.

Figure 18. Span-wise section-lift distribution at α = 5°.
The traditionally designed winglets took into account the impact of trim drag on the performance of the sailplane, which is affected by the wing loading and static margin. As the effect of the trim drag was neglected throughout the optimisation, it is important to understand the impact this may have on the results. The effect of trim drag is determined by changing the horizontal stabiliser deflection until the aerodynamic moments of the potential flow solution are in equilibrium about the centre of gravity.
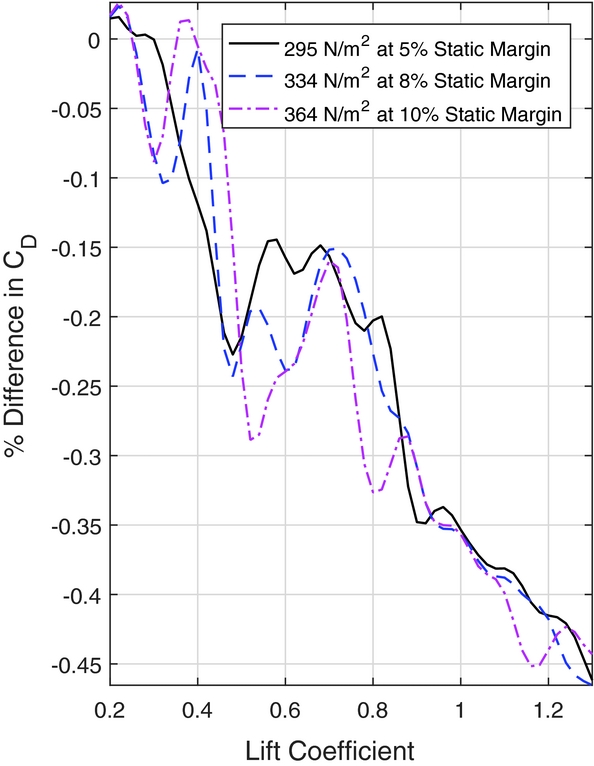
To illustrate the effects of wing loading and static margin on the designs, Fig. 19 shows the percent difference in drag coefficient with respect to the traditionally designed winglet, plotted against lift coefficient. These results include the trim drag approximation. The differences in the drag coefficients are in the order of a tenth of a percent, implying both designs have very similar performance.

Figure 19. Change in CD with respect to traditionally designed winglet vs CL .
To understand the impact of the trim drag on the cross-country speeds, Fig. 20 shows the percent change in cross-country speed with respect to the no-winglet case, including the trim drag approximation. When comparing these results to those of Fig. 15, there is a small gain of approximately 0.5% in the weak thermals for Winglets 1 and 2. The differences between the results of the optimisation and the traditionally designed winglet, however, are reduced. This implies that ignoring trim drag in the design process is not entirely inconsequential, even though the results of the optimisation still closely match the performance of the traditionally designed winglets.

Figure 20. Change in Vavg with respect to no-winglet case, with trim drag considerations.
Due to their performance across the entire flight envelope of the Standard Cirrus, all three designs resulting from the optimisation are worthwhile for further investigations. In comparison to the base aircraft without winglets, the reported performance benefits are of similar magnitude as for the traditional design. This is certainly a testament of the high level of experience of the designer of the traditionally designed winglets. Nevertheless, the winglet geometries resulting for the optimisation process provide good starting points to further improve them, including to improve manufacturing and aesthetics.
The next step in furthering this design process will be to loosen some of the geometric constraints which led to the resulting winglet geometries in the above design study. An example of such a constraint which may be loosened is the fixed-straight trailing edge. In doing this, the design space will be expanded, and may lead to other potentially beneficial blended winglet designs. In addition to this alteration, aerofoil selection will be introduced as a design variable.
This design process is currently being applied to more unconventional wing-tip devices, such as split-winglets and tip sails, in an effort to expand the understanding behind how these devices work, as well as to determine their suitability for applications with sailplanes and small to medium-sized unmanned aerial systems.
4.0 CONCLUSIONS
An optimisation process was used to aid in the design of winglets for a Standard Cirrus sailplane. The purpose was to use an automated design process that produces winglet geometries with performances comparable to traditional designs. The primary objective of the optimisation process was to increase the maximum cross-country speed of the sailplane for various thermal strengths. Results from the optimisation were compared to a traditionally designed winglet for the same sailplane, which was developed with the same objective. The designs from the optimisation process were analysed and several were chosen for further evaluation.
Two such designs were seen to have no crossover point in the flight envelope of the Standard Cirrus and provided a 1.5% increase in cross-country speed over the traditionally designed winglet at low thermal strength. At higher thermal strengths, the chosen winglets provided a 0.4% increase in cross-country speed compared to the traditionally designed winglet. When approximating the effects of trim drag on the designs, these improvements were seen to fall to 0.6% and 0.1%, respectively. All of the designs provided slight increases in the wing root bending moment compared to a Standard Cirrus with no winglets; this increase was approximately 0.5%.
The increases in cross-country speed attained here are significant; during the 2014 World Gliding Championship in Finland, the four top finalists were separated by less than 3%. In addition to this increase in performance, winglets also can provide better handling qualities by, for example, increasing aileron effectiveness.
The optimisation process proved to be a rapid, valuable tool when designing winglets for sailplanes. It has the potential to alleviate the burden that traditionally designed winglet design places on the designer, and instead allow them to modify the optimised results to account for other aspects, such as manufacturability and aesthetics.
ACKNOWLEDGEMENTS
The authors gratefully acknowledge Mark Maughmer for sharing the geometry data of the winglets that he originally designed for the Standard Cirrus. Furthermore, this work was made possible with funding by the Kenneth M. Molson Foundation and Ryerson University.