


1. Introduction
Crystalline textures within mineral-filled fractures (here, veins) can be used to interpret the relative timing of fracture opening and sealing (Bons et al. Reference Bons, Elburg and Gomez-Rivas2012). For example, blocky crystals and isopachous cement linings signify void-filling precipitation and so evidently postdate fracture opening (e.g. Spruženiece et al. Reference Spruženiece, Spath, Urai, Ukar, Selzer and Nestler2021). In contrast, fibrous veins are thought to form where cementation coincides with opening and is able to fully seal fractures as they widen (Urai et al. Reference Urai, Williams and van Roermund1991; Lander & Laubach, Reference Lander and Laubach2015).
In the case of simultaneous fracture opening and sealing, it is usually unclear whether the two processes are causally linked or simply coincident. If coincident, then it can be inferred that the potential rate of crystal growth is equal to or faster than the fracture-opening rate. In contrast, for a causal connection between opening rate and crystal growth rate to be matched, two completely opposing mechanisms have been suggested. One link is that fracture opening causes a change in fluid pressure that results in supersaturation and mineral precipitation from the pore fluid (Rusk & Reed, Reference Rusk and Reed2002; Tarling et al. Reference Tarling, Smith, Rooney, Vitic and Gordon2021). The other is that the force of crystallization – that is, the chemical potential driving the precipitation of cements – is actually what drives open the fracture by opposing the confining stress (Wiltschko & Morse, Reference Wiltschko and Morse2001; Meng et al. Reference Meng, Hooker and Cartwright2018a ). This latter possibility was proposed for fibrous veins in New York state by Taber (Reference Taber1918) as an explanation for the growth of veins in the absence of significant void space. In contrast, veins in the same rocks that contain blocky crystal grains were interpreted to form via fracture opening and cementation. Fibrous texture was also successfully reproduced in the laboratory by precipitating minerals from supersaturated fluids, further supporting the force of crystallization hypothesis for fibrous veins (Means & Li, Reference Means and Li2001).
Shale-hosted veins may therefore grow by solution–precipitation of soluble rock components, particularly calcite, as a mechanism to minimize strain energy, a process requiring no fluid transport. Such veins would qualify as pressure fringes, in the sense described by Bons et al. (Reference Bons, Elburg and Gomez-Rivas2012), that grew antitaxially around an initial calcite-filled crack, with perhaps no effect on fluid flow (Hooker et al. Reference Hooker, Cartwright, Stephenson, Silver, Dickson and Hsieh2017; Gasparrini et al. Reference Gasparrini, Lacombe, Rohais, Belkacemi and Euzen2021). Because veins can also form and grow via natural hydraulic fracturing under conditions of highly elevated subsurface fluid pressures (Cosgrove, Reference Cosgrove and Ameen1995; Philipp, Reference Philipp2012; Fall et al. Reference Fall, Eichhubl, Bodnar, Laubach and Davis2015; Hooker et al. Reference Hooker, Ruhl, Dickson, Hansen, Idiz, Hesselbo and Cartwright2020), veins may represent the vestiges of fluid-flow pathways that enhanced permeability and fluid expulsion in the geologic past (Ghosh et al. Reference Ghosh, Hooker, Bontempi and Slatt2018; Mazzarini et al. Reference Mazzarini, Musumecia, Violac, Garofaloc and Mattilad2019; Fan et al. Reference Fan, Li, Zhao, Qin, Fan, Wu and Zhang2020). This alternative view has major implications for the role of fractures in subsurface fluid migration.
Furthermore, the nature and degree of bonding between vein-fill crystal fibres and the host rock during fracturing are not clear, and so neither is the permeability nor the shear strength of such interfaces, in situ. The presence of veins can potentially affect the style of later deformational events, whether in nature (Meng et al. Reference Meng, Hooker and Cartwright2018 b) or in laboratory or numerical experiments (Gale & Holder, Reference Gale and Holder2010; Wu & Olson, Reference Wu and Olson2016). The presence of cements within growing fractures can likewise affect fracture reactivation susceptibility and internal cement texture (Virgo et al. Reference Virgo, Abe and Urai2014), hydrofracture permeability and bulk rock properties (Vass et al. Reference Vass, Koehn, Toussaint, Ghani and Piazolo2014), and fracture size and spacing (Hooker & Katz, Reference Hooker and Katz2015; Laubach et al. Reference Laubach, Lander, Criscenti, Anovitz, Urai, Pollyea, Hooker, Narr, Evans, Kerisit, Olson, Dewers, Fisher, Bodnar, Evans, Dove, Bonnell, Marder and Pyrak-Nolte2019).
Veins are the most common deformational structures in subsurface mudrocks (Gale et al. Reference Gale, Laubach, Olson, Eichhubl and Fall2014; Hooker et al. Reference Hooker, Abu-Mahfouz, Meng and Cartwright2019). In the interest of improving our ability to use cement textures to interpret the dynamics between crustal deformation, fluid pressures and diagenetic and catagenetic processes, we present the following study of calcite veins hosted in the organic-rich Marcellus Formation (Devonian) in Pennsylvania, USA. Detailed scanning electron microscope (SEM)-based petrographic investigation of an array of layer-perpendicular fibrous and blocky veins reveals alternating periods of continual and punctuated opening, implying that pressure fringes and hydraulic cracking and sealing form a spectrum of deformation mechanisms, on which the present fractures occupy an intermediate position.
2. Geologic setting
The veins analysed in this study were extracted from a core drilled through the Upper member of the Devonian Marcellus Formation in the Appalachian plateau, in Tioga County, Pennsylvania, USA (Fig. 1). During the Alleghanian orogeny the rocks of the Appalachian plateau were deformed into a series of folds detached over Silurian-age salt deposits (Mount, Reference Mount2014). Natural fracture surveys have yielded fracture sets striking generally parallel and perpendicular to km-scale folds (e.g. Lash & Engelder, Reference Lash and Engelder2009). However, considerable variation from this trend is present (Evans et al. Reference Evans, DeLisle, Leo and Lafonte2014), and NE-striking fractures have been attributed to a regional stress field that predates the folding (Engelder & Whitaker, Reference Engelder and Whitaker2006).

Fig. 1. (a) Core location. Outline of Pennsylvania, USA, showing Alleghany Structural Front (ASF), which divides the tightly folded Valley and Ridge province to the southeast from the gently folded Appalachian Plateau to the northwest. Anticline fold axes mapped, after Wilkins et al. (Reference Wilkins, Mount, Mahon, Perry and Koenig2014). Bold outline shows Tioga County, with approximate core location marked. (b) Vertical slice through Marcellus Fm. slant core analysed. Stratigraphic level of sample surface in (c) indicated by dashed line, though thin-sections were taken from the other core half. Up arrow indicates stratigraphic upsection; beds are approximately horizontal; core slants roughly 45°. (c) Layer-parallel section showing seven calcite veins described in this study. Vein VII is actually a cluster of small, nearly microscopic veins. Note veins VI and VII strike at an angle of roughly 20° to the rest.
Cross-cutting relationships, mineral assemblages, fluid inclusions, and carbon and oxygen isotopic compositions suggest that the development of cement-bearing opening-mode fractures throughout the Appalachian plateau, and the Valley and Ridge province to the south, was most prevalent before and during peak burial (Evans, Reference Evans1995; Evans et al. Reference Evans, Bebout and Brown2012, Reference Evans, DeLisle, Leo and Lafonte2014; Wilkins et al. Reference Wilkins, Mount, Mahon, Perry and Koenig2014; Hooker et al. Reference Hooker, Cartwright, Stephenson, Silver, Dickson and Hsieh2017). This timing, as well as hydrocarbon inclusions within synkinematic mineral cements (Evans et al. Reference Evans, DeLisle, Leo and Lafonte2014), supports the formation of these fractures as hydraulic fractures, i.e. fractures whose opening was driven or assisted by elevated fluid pressures related to catagenesis.
Regional thermal history patterns indicate exhumation of 4 km or more (East et al. Reference East, Swezey, Repetski and Hayba2012; Evans et al. Reference Evans, DeLisle, Leo and Lafonte2014) since maximum burial during the Alleghanian orogeny, during the late Palaeozoic. Uncemented fractures may have formed during the same time periods but escaped sealing (Engelder et al. Reference Engelder, Haith and Younes2001) or may have formed more recently, during cooling and decompression (Engelder & Behr, Reference Engelder and Behr2020).
3. Methods
We sampled a series of veins for petrographic and isotopic analyses. Thin-sections were cut parallel to bedding, in order to sample bedding-perpendicular veins. Veins were analysed using an optical microscope and an FEI Quanta 650 field-emission gun equipped with backscattered electron (BSE), electron backscatter diffraction (EBSD), cathodoluminescence (CL) and energy-dispersive X-ray spectroscopy (EDS) detectors. BSE allows for high-resolution imaging where pixel brightness is proportional to atomic number. EBSD maps crystallographic axes of the sample based on diffraction of the incident electron beam. EDS allows element mapping as electron bombardment of the sample produces X-rays having element-specific energy. CL aids in visual reconstruction of fracture growth and sealing histories (e.g. Laubach et al. Reference Laubach, Reed, Olson, Lander and Bonnell2004).
Samples were polished using colloidal silica. CL and EDS measurements were collected using a 20 kV beam; EBSD measurements, using 30 kV, and a 3–5 μm step size. EDS spectra were collected at 10 mm working distance. Spot size and aperture were varied to optimize response for each detector.
Powders of vein fill for isotopic analyses were collected by breaking the sample along veins and grinding vein cement using a steel file. Samples for isotopic analysis were taken from each vein, including subsamples from blocky and fibrous regions in two veins, by progressively filing from the vein wall toward the vein interior. We minimized contamination of our samples with host-rock carbonates by visually monitoring for shale fragments while pulverizing vein cements.
Samples, in the mass range 0.2–0.6 mg, were analysed isotopically for δ13C and δ18O at the Department of Earth Sciences, University of Oxford, using a VG Isogas Prism II mass spectrometer with an on-line VG Isocarb common acid bath preparation system. Within the Isocarb instrument, the powdered sample is reacted with purified phosphoric acid at 90 °C. Calibration to the Vienna Pee Dee Belemnite (V-PDB) standard via NBS-19 is made daily using the Oxford in-house (NOCZ) Carrara Marble standard. The relative 13C/12C values are reported in the conventional δ13C (‰) notation, relative to the V-PDB, by assigning a value of +1.95 ‰ exactly to NBS-19. The relative 18O/16O values are reported in the conventional δ18O (‰) notation, relative to V-PDB, on a normalized scale such that the δ18O of NBS-19 is −2.2 ‰. Reproducibility of NOCZ during these analytical runs was 0.06 ‰ for δ13C and 0.13 ‰ for δ18O (1σ, n = 13). Accuracy was checked with measurements of the international standard IAEA-CO-1, with average δ13C = 2.58 ± 0.04 (1σ, n = 2) and δ18O = −2.34 ± 0.1 ‰ (1σ, n = 2) within the combined uncertainty of IAEA published values of δ13C = 2.48 ± 0.03 ‰ (1σ, n = 10) and δ18O = −2.44 ± 0.07 ‰ (1σ, n = 10).
4. Results
4.a. Sample description
The present study focuses on a series of veins preserved within a single shale layer (Fig. 1). The drill core from which the veins were sampled was drilled at c. 45° to bedding, enabling a fracture survey covering a bed-parallel distance of 11 cm. The veins cut a series of shale beds comprising massive beds having local nodular cement and laminated fossiliferous beds. The layer selected for microscopic analysis has a uniform dark-brown colour and no macroscopically distinguishing features (Fig. 1). All veins dip near vertical, yet two strike populations are present, forming an angle of c. 20°. True strike for the dominant set (veins I through V; Fig. 1) is close to N–S; the subordinate set strikes west of north. Microscopic veins in the subordinate set (i.e. parallel to veins VI and VII; Fig. 1) abut and deflect against those of the dominant set, as we will show below. Accordingly, we call the dominant set Set 1 and the subordinate set Set 2, based on the interpretation that the deflection signifies a later timing for Set 2; however, below we also show microtextural and isotopic evidence that the opening of the two vein sets partially overlapped in time.
4.b. Petrography
Textural and point-count (n = 300) analyses of the host rock, from a representative area in our series of layer-parallel thin-sections, indicate a dominantly illitic matrix (84 % by area), with pores partially filled by amorphous organic matter (4 %) and silt-sized grains of calcite (5 %), dolomite (2 %), quartz and feldspar (2 %), pyrite (2 %), barite (1 %) and trace titanite.
Six macroscopic veins, having dominantly calcite mineral fill, are visible in the horizontal plane selected for microscopic analysis (Fig. 1). A seventh structure is faintly visible, which microscopic analysis shows to be a cluster of thin veins. SEM-based observations reveal that the fill of veins varies from fibrous (i.e. crystals having near-constant width and lengths much greater than their widths) to blocky (i.e. roughly equidimensional crystals).
Vein I (Fig. 2) contains mostly fibrous fill. Here and throughout, fibres extend outward at high angle to vein walls. The fibres are interrupted by three to four continuous bands that run parallel to fracture walls. As detailed below, these bands are common to most veins and contain microscopically blocky crystals as well as host-rock inclusions in greater abundance than that throughout the fibrous zones. Bands within the vein interiors bear the defining characteristics of a median zone (Bons et al. Reference Bons, Elburg and Gomez-Rivas2012) in that they contain microscopically blocky crystals and are surrounded on either side by fibrous zones. Vein II (Figs 3, 4) contains fibrous fill on one half of the vein and blocky fill on the other. Within the blocky half, crystals are slightly elongated perpendicular to the vein walls. Veins I (Fig. 2), III (Fig. 5), IV (Fig. 6), and V (Fig. 7) are dominantly fibrous, whereas veins VI (Fig. 8) and VII are dominantly blocky.

Fig. 2. Vein I. (a) SEM-CL image. Generally fibrous fill has moderate CL brightness and contains bands of CL-dark cement running parallel to vein walls. Large host-rock inclusion present near centre of image. (b) SEM-CL image of same vein, imaged several mm away. Note consistency of spacing and thickness of CL-dark bands along vein.

Fig. 3. Vein II. (a) SEM-CL image showing fibrous fill (upper right) and blocky/stretched fill region (lower left). (b) EBSD image showing same region imaged in (a). Colours correspond to calcite crystallographic orientations. (c) Interpretation of (a). Fibrous fill shown in red; block (void-filling) cement shown in blue. Crystal boundaries in blocky zone highlighted in white. See text for discussion. (d) Equal-area, upper-hemisphere projections of crystallographic axes from sub-populations of crystals in (b). Magenta, dark-blue and light-blue boxed diagrams correspond to highlighted areas in (b). Stereonets within each box show, from left to right, poles to {0001}, {11–20}, {10–10}. Note dispersion of fibrous crystal axes along girdles parallel to vein. Light-blue-outlined crystals are those that widen from the centre of the vein toward the outer wall; {0001} for this population lies at high angle to vein wall.

Fig. 4. Misorientation profiles of individual crystals from vein II (Fig. 3). Bottom left corner of each graph is a (0,0) origin, omitted for clarity. Starting point is the end of the crystal nearest the median zone; ending point is the end of the crystal nearest the vein wall. Note fibre misorientation progressively accumulates from end to end, achieving a total misorientation of usually 1–6° over a distance of ∼300 μm. In contrast, stretched-crystal misorientation is smaller in magnitude and is non-systematic in direction along the crystal.

Fig. 5. Vein III. (a) Backscattered electron image showing fractured elliptical fossil included within vein. Vein width was measured along yellow lines. (b) SEM-CL image of the same area shown in (a). Note vein wall maintains roughly parallel attitude to included fossil. CL-dark bands are generally planar along vein, but commonly deflect as they cross the vein. Fibrous cement fills the region outward of the fossil, having curved vein walls; bands deflect but do not maintain parallelism with the vein wall. (c) Measurements of the widths of the vein along solid yellow lines in (a). Dashed-line lengths cut through fossil material where total distance between vein walls is greater; measurements reflect solid-line lengths, i.e. the length between fracture walls filled by vein-filling cement. Note vein–cement distance is roughly constant along vein, measured through the fossil or away from it. (d). SEM-CL image of the same vein, several mm away from the fossil. Note consistency of CL-dark band size and spacing. (e) EBSD map of calcite axes in the vicinity of the fossil. (f) Crystallographic axes measured from regions outlined in (e). Stereonets arranged as in Figure 3.

Fig. 6. Vein IV. (a) SEM-CL image. Note blocky median zone with banded fibrous fill at flanks and thin blocky zone along lower-left margin. Black host rock inclusion near centre coincides with outward protrusion of vein wall, translated roughly along crystal fibres. (b) EBSD map of region imaged in (a). (c) Upper-hemisphere stereonets showing crystallographic axes of crystals in (b), arranged as in Figures 3 and 5.

Fig. 7. Vein V. (a). SEM-CL image showing fibrous fill and median line. (b) EBSD map of area imaged in (a). (c) Lower-hemisphere stereonets (left: {10–14}, right: {0001}) of crystallographic axes in (b). Note lack of organization of axes orientations.
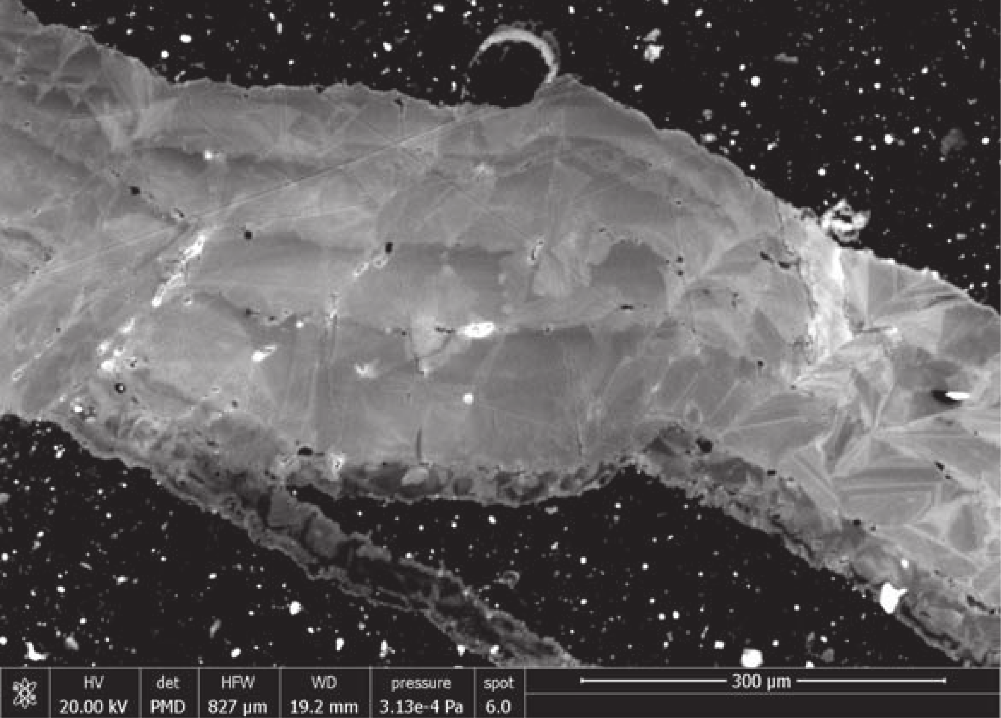
Fig. 8. Vein VI. SEM-CL image of calcite vein fill. Note about six opening increments demarcated by contrasting CL response and small black host-rock inclusions. Image preserves anticlockwise discursion of throughgoing fracture orientation.
A microscopic vein deflects against vein III (Fig. 5). Away from vein III, this microscopic vein strikes parallel to vein VI. The CL signal of the microscopic vein indicates a blocky central region rimmed with a very thin (∼10 mm wide) fibrous layer (lower-left margin, Fig. 5). Though short, these fibres appear to extend perpendicular to the vein VI direction, thus oblique to the vein III orientation, including the vein III fibres.
Vein IV has a median zone marked by blocky crystals, apparent in CL. As well, a thin blocky zone is present on one side of an otherwise fibrous fill (lower-left vein margin in Fig. 6).
4.c. Crystallography
EBSD analysis of the two petrographically distinct sections of vein II reveals two correspondingly distinct crystallographic patterns (Fig. 3). Within the fibrous section, IIf, poles to {0001} lie preferentially within a girdle centred along the fracture plane and extending to roughly 25° to either side. Moreover, in individual fibres inside this girdle, {0001} poles are dispersed, up to roughly 10°, within a plane parallel to the fracture plane. Poles to {10–14} show the same dispersion pattern within the girdle but are also present in equal abundance outside the girdle, where they show less dispersion. EBSD misorientation profiles, taken along individual fibre crystals from their tip nearest the fracture centre to their tip nearest the fracture wall (Fig. 4), indicate gradual rotation of the crystallographic axes, by typically 1–10°, or rarely more, over the length of the crystals.
The blocky-crystal section of the same vein, IIb, shows a moderate crystallographic preferred orientation (CPO), with {0001} poles aligned perpendicular to fracture walls (Fig. 3). This CPO becomes more prominent after filtering the results to include only crystals that both extend to the fracture wall and progressively widen as they approach the fracture wall (Fig. 3). Such a pattern is consistent with competitive growth, whereby an essentially random scatter of c-axes at the centre of the vein develops CPO as grains having c-axes oriented at high angle to the vein wall grow faster and overgrow their less fortuitously aligned neighbours.
Vein III has fibrous fill throughout (Fig. 5). The vein cuts a host-rock clast containing a roughly elliptical fossil, 450 × 150 μm in thin-section. The fossil interior is filled with barite (Fig. 5), reflecting post-depositional infilling and possible replacement of original carbonate. Both fracture walls curve outward where this fossil is included, conforming roughly to the shape of the inclusion. As we describe in detail below, vein cement partially cross-cuts and partially overgrows the margins of this fossil at the shale interface. The geometries of the generations of cement preserved here are critical to our interpretation of punctuated versus continual vein growth.
Crystallographic axes were examined where fibrous vein III cuts the fossil (Fig. 5). Away from the fossil, poles to {0001} show little organization, in contrast to the crystals in vein IIf. Crystallographic axes do not show the planar dispersion observed within vein IIf. For fibres that border the fossil, poles to {0001} are strongly aligned upon a great circle lying oblique to the vein.
Vein IV has four distinct crystallographic-textural zones: from top right to bottom left in Fig. 6 there is a fine-width fibrous zone, a blocky median zone, a coarse-width fibrous zone, and a blocky but layered zone along the fracture wall. The fine-width fibrous zone shows no CPO; however, intracrystalline crystallographic axes tend to show dispersion similar to that in IIf. The crystallographic dispersion in each fibre lies in a plane whose pole is oblique to the vein. A host-rock inclusion at the base of the fine-width fibrous zone corresponds to a protrusion of the (upper-right) vein wall, in a similar way to the boundary of vein III (Fig. 5). The median zone contains CL-bright grains within a CL-dark field and has faint CPO with {0001} poles at high angle to the fracture plane. Fibres within the coarse-width fibrous zone show slight coarsening of fibre width away from the median zone (Fig. 6). Crystals within the blocky zone along the fracture wall are optically continuous with the widest fibres in the adjacent zone (Fig. 6). This lowermost zone comprises about five layers of cement, similar in appearance to the blocky section of vein II (Fig. 3c).
Each optically identified fibre in fibrous vein V has a distinct crystallographic orientation with little intra-fibre variation (Fig. 7). EBSD analysis of this vein shows a homogeneous distribution of {0001} poles and thus no CPO. There is no planar dispersion of crystallographic axes apparent, like that observed in veins II and IV.
4.d. Cathodoluminescence
Fibres within veins have medium CL response with faint, micron-scale striping, parallel to fibres (Figs. 2, 3, 5, 6). Secondary electron imaging of a 3D sample of vein II (Fig. 9) shows interlocking at the interfaces between neighbouring fibres, producing angular ridges that run parallel to the fibres and have widths similar to those of CL stripes. Fibrous regions in veins I through IV are interrupted by bands running parallel to the fracture wall and perpendicular to fibres. All such bands contain CL-dark calcite; thicker bands contain patches of calcite having CL response similar to that of the intervening fibres, as well as scattered host-rock inclusions (Fig. 2). Comparing EBSD and CL maps of the same region (Fig. 3) shows that crystal fibres generally cross these CL-dark bands. However, fibres commonly change width across bands, and there are some fibres that terminate (or originate) at bands (Fig. 3).

Fig. 9. Secondary electron image of fibres, vein II. Flat faces are roughly parallel to vein wall; arrows indicate two surfaces of an angular ridge running parallel to the fibre direction and producing interlocking between neighbouring fibrous crystals.
Each band has a roughly constant width. Across a vein, bands tend to become successively thinner in one direction. Where a blocky zone in the central part of a vein is present (e.g. Fig. 6), bands generally become thinner away from this median zone and toward the fracture wall; however, we do not observe symmetrical banding around a median zone.
The bands are not linear (planar) throughout the veins but, rather, locally deviate. Deviations have symmetrical, elliptical to triangular profiles and the deviation is generally in the direction of band thinning. Deviations are not randomly distributed along each band; rather, deviations present in a given band are also present in neighbouring bands, in positions translated along fibres (Fig. 5). Where the fibres reach the fracture wall, the shape of the fracture wall generally conforms to the deviation as well.
Bands are rich in host-rock inclusions, relative to the intervening fibrous sections (Figs. 2, 3). Band deviations are commonly but not exclusively located outward of host-rock inclusions (Fig. 5).
Blocky-crystal vein fill displays a wider range of CL response than that in the fibrous regions (Figs 3, 6). The blocky zone of vein II (Fig. 3) encompasses continuous boundaries running parallel to the fracture wall, with similar rugosity to that of the wall, and marked by host-rock inclusions. These boundaries juxtapose variably luminescent patches of cement on either side. Along each boundary, the calcite toward the fracture wall is almost invariably brighter than that toward the fracture centre. Moving away from a boundary toward the fracture wall, CL-bright calcite gives way to darker calcite across angular contacts resembling euhedral crystalline zones (Fig. 3). These zones are then truncated by the next fracture-wall-parallel boundary, with subsequent CL-bright calcite (Fig. 3). The spacing of these boundaries increases toward the fracture wall.
Comparison with EBSD images shows that the brightest CL zones in the blocky region of vein II coincide with long crystals that widen toward the fracture wall, i.e. those with the greatest CPO of {0001} poles lying perpendicular to the vein wall (Fig. 3).
Where vein III intersects the fossil (Fig. 5), the fracture walls run roughly parallel to the fossil, such that the total vein thickness, subtracting the fossil, is close to uniform. We measured the thickness of vein cement, parallel to the fibres, at ten positions along vein III, including five positions in which our line of measurement intersects the fossil or other host-rock inclusions (Fig. 5). The cumulative width of vein cement is more variable at positions intersecting the fossil, but within a standard deviation, the vein thickness is constant.
CL-dark bands can be seen to cut the barite-filled fossil. The ‘stratigraphy’ of the bands, i.e. their width and position across the vein, is remarkably consistent away from the fossil on either side (Fig. 5). Close to the fossil, the bands are variably curved, with curved segments running parallel to the fossil and the corresponding bend in the fracture wall. After some limited distance the bands curve back to their fracture-parallel orientation and cut the fossil.
A thin layer of fibres is visible in CL along one wall of vein III, at the lower-left edge of the vein as shown in Figure 5b. These fibres lie roughly perpendicular to the microfracture that strikes parallel to Set 2 but deflects to run along the wall of vein III (in Set 1). These fibres do not change appreciably in orientation and are inconspicuous in EBSD maps (Fig. 5e). Thus most of these fibres are crystallographically continuous with the microfracture cement and vein fibres on which they appear to template. The fibres of the microfracture cement lie roughly perpendicular to the microfracture away from vein III, and oblique to the microfracture and vein where the latter two run parallel.
Within vein IV, subtle variations in CL between fibres show that changes in crystal-fibre thickness locally appear to occur in discrete steps that commonly coincide with CL bands (Fig. 6). One imaged fibre appears to be truncated at a CL band (Fig. 6).
Within the individual fibres of vein V the CL is homogeneous. There is variation across fibres that shows no consistency by direction (Fig. 7). CL of vein VI shows faint euhedral zoning truncated at fracture-wall-parallel surfaces (Fig. 8). Such surfaces also entrain micron-scale inclusion of host rock.
4.e. Isotopes
Stable oxygen and carbon isotopic compositions of vein calcite are plotted in Fig. 10. Oxygen compositions (δ18O, VPDB) range from −10.5 to −11.0 ‰VPDB. The only exception to this range is one of the five samples from vein IIb, which has −10.1 ‰VPDB δ18O. Carbon δ13C ranges from 1.1 to 2.1 ‰VPDB. Calcite from fibrous and blocky veins shows no systematic variation in oxygen composition. There is a small tendency of fibrous calcite to have more depleted 13C, except that vein IIf has enriched carbon like that of the blocky samples. The two lightest-carbon veins are also the two thinnest veins (veins I and V).

Fig. 10. Carbon and oxygen isotopic compositions of sampled calcite vein cements. B: blocky; F: fibrous. Dark symbols include fibrous samples; white-fill symbols include blocky vein fill. 2-sigma error plotted.
5. Discussion
5.a. Fracture opening and sealing
The orientations and isotopic signatures of veins in this study match those of calcite-filled fractures in previous studies that showed that such brittle meso- and microstructures formed as opening-mode fractures in response to tectonic strains (Engelder, Reference Engelder2004; Wilkins et al. Reference Wilkins, Mount, Mahon, Perry and Koenig2014), likely assisted by catagenetic fluid overpressures (Engelder & Whitaker, Reference Engelder and Whitaker2006; Evans et al. Reference Evans, DeLisle, Leo and Lafonte2014). Hooker et al. (Reference Hooker, Cartwright, Stephenson, Silver, Dickson and Hsieh2017) attributed oxygen and carbon compositions similar to those of host-rock carbonate minerals as evidence for local solution–reprecipitation of host carbonates into veins under elevated burial temperatures and little fluid advection. The present vein isotopic signatures lie within the range observed in that study and studies of mudrock-hosted veins worldwide (Hooker et al. Reference Hooker, Abu-Mahfouz, Meng and Cartwright2019).
Apart from a single sample from vein IIb (i.e. the blocky portion of vein II), there is no significant difference in the observed δ18O among the veins (Fig. 10). In contrast, there is significant variation in δ13C. Interestingly, the δ13C is mostly consistent within each vein, rather than varying by blocky versus fibrous segments within each vein. Thus veins II and VI have a relatively heavy carbon signature, veins III and IV have an intermediate carbon signature and veins I and V have a light carbon signature. There is therefore no consistent isotopic variation by vein set. Blocky cements generally have heavier carbon compositions, especially considering that the heaviest-carbon sample from vein IV (+1.68 ‰ VPDB; Fig. 10) was taken from the blocky wall of that vein (lower-left wall in Fig. 6). But vein IIf cements also have heavy carbon compositions.
Hooker et al. (Reference Hooker, Cartwright, Stephenson, Silver, Dickson and Hsieh2017) interpreted variation in δ13C as grain-size-dependent exchange between mineral carbonate and organic carbon in the host rock. That study included isotopic data from host-rock carbonate grains, with δ13C ranging from −4.9 to −1.7 ‰VPDB (n = 7), with an additional nodular cement sample having δ13C = −14.2. Host-rock δ18O, from the same samples, ranges from −10.2 to −7.8 ‰VPDB (Hooker et al. Reference Hooker, Cartwright, Stephenson, Silver, Dickson and Hsieh2017). Exchange with isotopically light organic carbon was interpreted to decrease δ13C at the outer surfaces of carbonate mineral grains, and so larger and earlier-formed veins were more likely to retain a heavy δ13C composition, free of organic carbon. The thin aperture and light carbon composition of veins I and V are consistent with this interpretation.
Contamination of our vein cements with host-rock carbonate, during sampling, could partially explain the observed lighter compositions. However, the sampled host rock contains little carbonate, and what carbonate is there has a difference of −6 ‰ or less from the vein compositions. Mass balance suggests that for contamination to amount to the 2σ analytical uncertainty of 0.12 ‰, approximately a 0.4:1 host-rock:vein-cement ratio would have to have been collected, which would easily have been recognized during sampling. We can therefore exclude sample contamination as the cause of the observed differences in δ13C.
As stated above, we interpret veins VI and VII to have formed later, based on their anticlockwise rotation with respect to the other veins. Likewise, the thin fracture, parallel to veins VI and VII, which appears to have partially reactivated vein III (Fig. 5), should therefore postdate vein III. It is unclear why vein VI should have a heavy δ13C if it formed late, but we do note relatively heavy δ13C compositions in the blocky regions of veins II and IV as well. It could be that the opening of these now-blocky veins was associated with some degree of fluid mixing, and thus the introduction of isotopically heavy fluid. Such mixing would be consistent with a significant, though ephemeral, open (porous) fracture aperture, which would be expected from a blocky cement fill and not from a fibrous fill.
However, the observed variations in δ13C are not large enough to conclusively demonstrate fluid mixing. Apart from the covariation in carbon compositions between veins and host rocks, noted by Hooker et al. (Reference Hooker, Cartwright, Stephenson, Silver, Dickson and Hsieh2017) and used to interpret a near-closed fluid system, recent work by Yan et al. (Reference Yan, Dreybrodt, Bao, Peng, Wei, Ma, Mo, Sun and Liu2021) shows that hydrodynamic effects in travertine pools can result in fractionation of up to 3 % among co-precipitating carbonate deposits. Furthermore, there is no significant variation in δ18O throughout the sampled veins, which might have implied some significant temperature or fluid-composition difference throughout vein-sealing conditions.
5.b. Interpretation of blocky fill
The preferential inclusion of host rock, and fracture-wall-parallel trajectory of internal boundaries within blocky fills suggest incremental opening and sealing of the veins. The outward side of these incremental crack-opening surfaces, that is, the side facing away from the fracture centre and toward the fracture wall, is generally overlain by CL-bright cement (Fig. 3). This bright cement is in turn overlain by CL-dark cement at a euhedral interface. The dark cement extends to the next incremental-opening boundary.
As summarized by Richter et al. (Reference Richter, Götte, Götze and Neuser2003), the cathodoluminescence of carbonate minerals owes to structural (‘intrinsic’) lattice defects as well as trace-element incorporation (‘extrinsic’) lattice defects. No areal variation of trace elements is visible in the present samples using EDS mapping on our SEM, so we are unable to assess the particular causes of CL emission in our samples. However, the volumetric (and areal) concentration of both types of lattice defect can be expected to increase with increasing precipitation rate (Gabitov et al. Reference Gabitov, Sadekov and Leinweber2014; Füger et al. Reference Füger, Konrad, Leis, Dietzel and Mavromatis2019), and therefore so too should CL response. Accordingly, we interpret the euhedral boundary between bright and dark cement, with the latter overlying the former, to reflect a drop in the precipitation rate once anhedral calcite becomes euhedrally terminated.
Therefore we interpret that where the fill is blocky, opening increments were followed by fast, anhedral cement precipitation (CL-bright cement) upon the newly exposed, atomically rough vein-fill crystals. Opening increments were commonly wide enough that crystals developed euhedral terminations (CL-dark cement) during subsequent sealing. The sealing step marked the infilling of all fracture pore space, to the extent that the outer cement layer roughly conformed to the fracture wall. Thus the surface of the outer cement layer became roughened, as predicted by Nollet et al. (Reference Nollet, Urai, Bons and Hilgers2005). Upon the following opening increment, consisting of a re-breaking of the vein-fill / host-rock interface, this outer cement layer was again overlain by fast, anhedral cement precipitation.
5.c. Interpretation of CL-dark bands
CL-dark bands appear to mark discrete jumps in the fracture-opening rate, relative to the slow opening rate that persisted while the fibrous cement was precipitating at the vein / host-rock interface (Fig. 11). This interpretation is based on (i) the offset of the fossil and cutting of fibres in vein III, (ii) the preferential inclusion of host-rock material along bands, (iii) the change in width of many otherwise constant-width fibres across the bands, and (iv) the dark CL response of the band cement, indicating euhedral precipitation.

Fig. 11. (a) Growth of fibrous vein fill. Host rock is brown with white spots representing carbonate fragments. Shades of red represent crystallographically distinct fibres; thin black lines within fibres represent fine-scale CL striping. Grey arrow between steps 1 and 2 illustrates the amount of vein widening and simultaneous fibrous infill, which occurs without rupturing or porosity creation at the vein wall (see text). At step 3, the vein opens rapidly, indicated by the black arrow. Here, void-filling precipitation forms euhedrally terminated crystals over the fibres and newly exposed carbonate fragments – the latter in blue. At step 4, the void space is filled by slow-growing euhedral, blocky cement, in purple. Step 5 shows the resumption of fracture opening matched by fibrous infill. Note the shape of the upper fracture wall changes from step 4 to step 5; in this case, upward-pointing deviations (yellow arrows in step 5) in the wall are interpreted to form where host-rock fragments are included; see text for discussion. (b) Growth of blocky vein fill. From step 1 to step 2, the fracture opens a finite distance, indicated by black arrow, and fills with fast-growing anhedral cement (CL-bright, pale-colour vein fill) until those crystals form euhedral terminations. At that point (step 2 to step 3), slow-growing euhedral cement (CL-dark, dark-colour vein fill) fills the remaining space. Step 4 is an analogous repetition of step 2. Note lines marked by yellow arrows in step 3 have a rugosity similar (identical, as illustrated) to that of the fracture wall and juxtapose CL-dark vein cement below against CL-bright vein cement above. The roughness of the fracture wall evidently imparts a roughness to the crystal faces, such that further opening is filled by anhedral cement. Also note that crystals having thicker accumulations of CL-bright, fast-growing anhedral cement tend to overgrow their neighbours, reflecting a fast-growth direction at high angle to the fracture wall.
The CL evidence indicates that the bands formed at the vein/wall interface, as opposed to cutting extant fibres. This interpretation is based on the deflections of bands forming over host-rock inclusions that are inboard of the band, and running parallel to the outboard fracture wall. If the deflections formed by shearing parallel to fibres, then we would expect to see a more consistent offset along the fibres. If each band cut through extant fibres, then we would not expect them to have deflections parallel to those of other bands. Thus the bands represent discrete jumps that occurred at the vein/wall interface, and occurred amid precipitation of fibrous cement (Fig. 11).
5.d. Interpretation of fibrous fill
The widely held view that fibrous fill signifies cement precipitation keeping pace with fracture opening (Urai et al. Reference Urai, Williams and van Roermund1991; Hilgers et al. Reference Hilgers, Koehn, Bons and Urai2001; Bons et al. Reference Bons, Elburg and Gomez-Rivas2012) is supported here by the CL-dark bands, interpreted as discrete fracture-opening increments along the cement/wall interface. The question remains whether the fibrous fill in between the bands filled in myriad tiny opening increments, or whether the fibres grew continuously, as is implied by pressure fringes that expand fossils or other rigid grains within a relatively compliant matrix, without propagating in the manner of a growing fracture (Bons et al. Reference Bons, Elburg and Gomez-Rivas2012). In the former case, fibrous vein opening can be described as crack–seal, in which the cracks formed precisely upon the contact between the mineral fill and the host rock, presumably because of a mechanical weakness there. The latter case implies a deformation mechanism other than exclusively brittle fracturing, but that nonetheless did not preclude the opening-mode fracture process that formed the bands.
The classic models of space-filling fibrous vein development, wherein a slowly opening fracture prevents overgrowing, predict an absence of CPO (Hilgers et al. Reference Hilgers, Koehn, Bons and Urai2001), because crystals of any orientation can keep up with the retreating vein wall (Urai et al. Reference Urai, Williams and van Roermund1991). It has been shown that fibrous texture in veins need not always display this pattern. For documented examples, we can look to a family of expansive crystalline aggregates that expand bedding in fine-grained sequences. Among these aggregates are layer-parallel fibrous veins, historically termed ‘beef’ based on their resemblance to bovine muscle tissue (Cobbold et al. Reference Cobbold, Zanella, Rodrigues and Løseth2013 and references therein), and cone-in-cone structure, which comprises fibrous calcite arranged in conic arrays separated by host-rock inclusions (Tarr, Reference Tarr and Twinhofel1932; Woodland, Reference Woodland1964; Cobbold et al. Reference Cobbold, Zanella, Rodrigues and Løseth2013; Hooker & Cartwright, Reference Wang, Chen, Song, Steele-MacInnis, Liu, Wang, Zhang, Zhao, Liu, Zhang and Zhou2018). Various other textures have been documented, including domal to ellipsoidal mineral aggregates formed by intercalation of host material (Ukar et al. Reference Ukar, Lopez, Gale, Laubach and Manceda2017) and low-angle-to-bedding fibrous veins that grow by en échelon stepping across shale laminae (Hooker et al. Reference Hooker, Ruhl, Dickson, Hansen, Idiz, Hesselbo and Cartwright2020).
Among these various structures lie interesting contrasts to the present veins. In particular, cone-in-cone bears ostensible equivalence to the present fibrous veins in terms of their fibrous calcite composition, rock-expanding formation process, and occurrence in fine-grained rocks. Nevertheless, fibrous cone-in-cone structures commonly display strong CPO, in the form of fibre-parallel c-axes (Woodland, Reference Woodland1964; Meng et al. Reference Meng, Hooker and Cartwright2018 a). The latter study inferred that cone-in-cone indeed does not form by crystals filling space left by a retreating fracture wall but by force of crystallization, whereby the crystals press the wall away. Vein V (Fig. 7) shows no CPO, and vein IV shows only faint dispersion within fibrous crystals. These patterns are in general accordance with the space-filling model. Fibres within vein II (Fig. 3) and vein III (Fig. 5) show CPO oblique to fracture walls. The controls on these CPO patterns are unclear and likely have some dependence on substrate, based on the strong CPO among fibres rooted upon the fossil in vein III (Fig. 5).
CL images resolve opening increments having widths on the order of 1–10 μm, providing an upper limit on the width of hypothetical opening increments that would have been present during fibrous growth. However, the fibrous fill preserves the shape of the fossil along the outer wall of vein III; if that fill comprised myriad cracks, we might expect to see the cracks cut into the fossil, as the CL-dark bands do. Instead, we observe that the shale/fossil interface represents the growth surface, and the displacement upon that surface is roughly uniform during fibrous growth, despite that surface’s non-planarity.
The model whereby fibrous veins grow as myriad tiny crack events at the vein walls implies that fibres would nucleate as seed crystals that are exposed to a fluid-filled void once a fracture widens. This view could potentially explain most of our observations, especially given that the blocky crystals in the median zone of vein IV are in optical continuity with overgrowing fibres (Fig. 6). However, those overgrowing fibres have a finer-scale structure than that of the blocky substrate crystals, evident in faint CL striping (Fig. 6a) and in secondary electron images (Fig. 9). The latter show that fibres interlock with their neighbours, producing compromise boundaries having euhedral facets much narrower than the widths of the crystallographically distinct fibres. These facets would seem to form by the local arrangement of lattices in ways that minimize surface energy between neighbouring crystals. Such a process could involve the introduction of lattice defects, hence resulting in CL intensity striping as well as local dispersion of crystallographic axis orientations (Figs 3, 6). Such lattice imperfections imply that growth of fibres at the vein wall is not simply equivalent to space-filling crystal growth that happens over small distances. Instead, crystals grow despite having insufficient space to form their ideal lattice shape, as would be expected where chemical energy gradients, rather than fluid overpressures, drive vein widening.
Consistent with this view is the fact that vein V fibres have homogeneous CL and an absence of systematic crystallographic misorientation (Fig. 7) relative to veins II, III and IV. Vein V better fits the conception of fibrous fill as void-filling cementation in which the opening rate is slow enough to prevent competitive growth (Hilgers et al. Reference Hilgers, Koehn, Bons and Urai2001). It is unclear what conditions within vein V were different to have caused this contrast, but it is apparent that a variety of vein-widening processes were active, simultaneously or alternatingly, during the growth of the two vein sets here.
5.e. Implications for fracture-fluid dynamics
The present array of veins formed by a combination of continual growth, during which mineral infill was supplied at the vein / host-rock interface, and punctuated growth, where the interface was ruptured and void-filling cement precipitated. The nature of the vein/wall interface during fibrous growth remains obscure, but the CL evidence shown here in the vicinity of host-rock inclusions (Fig. 5) is consistent with fibrous vein widening not proceeding via crack–seal but instead via continual precipitation of mineral cements at the interface.
Previous work has attributed fibrous veins to a two-stage process, of initial opening-mode fracture, which makes sufficient space for a blocky-crystal-filled median line or zone, followed by continual widening and fibre growth without fracturing (Bons et al. Reference Bons, Elburg and Gomez-Rivas2012). In the absence of repeated fracturing, it has been suggested that vein minerals were delivered via diffusion through a static water volume, rather than by fluid flow (Wiltschko & Morse, Reference Wiltschko and Morse2001). The present work supports the view that fibrous cements grow without repeated fracturing, but also shows that the onset of fibrous growth does not preclude recurrent fracture-opening increments. Carbon isotopic evidence (Fig. 10) indicates such cracking increments could have enabled fluid pressure fluctuations and even flow, although this idea remains speculative for the present veins. Previous isotopic studies of vein cements in fine-grained sequences have suggested that vein minerals are the product of local diffusion and small-scale mineral redistribution (Hooker et al. Reference Hooker, Cartwright, Stephenson, Silver, Dickson and Hsieh2017; Meng et al. Reference Meng, Hooker and Cartwright2018c ), perhaps because of low host-rock permeability, and, commonly, a local source of fluid overpressure, such as maturation of organic matter in the host rock (Hooker et al. Reference Hooker, Cartwright, Stephenson, Silver, Dickson and Hsieh2017; Meng et al. Reference Meng, Hooker and Cartwright2017; Wang et al. Reference Wang, Chen, Song, Steele-MacInnis, Liu, Wang, Zhang, Zhao, Liu, Zhang and Zhou2018; Hooker et al. Reference Hooker, Ruhl, Dickson, Hansen, Idiz, Hesselbo and Cartwright2020). However, notable exceptions have been discovered, showing evidence of long-range transport via fluid advection (Elburg et al. Reference Elburg, Bons, Foden, Passchier, de Meer, Drury, de Bresser and Pennock2002; Worden et al. Reference Worden, Benshatwan, Potts and Elgarmadi2015), particularly where veins are part of larger-scale faults and associated fracture networks that linked previously isolated fluid compartments (Barker et al. Reference Barker, Cox, Eggins and Gagan2006; Evans et al. Reference Evans, Bebout and Brown2012; Debenham et al. Reference Debenham, Holford and King2020).
We have no evidence of calcite dissolution during vein growth, only that the calcite precipitation rate was limited by the opening rate of the vein (fibrous texture) or by the kinetics of crystal growth (blocky texture). Thus we interpret that the fluid was in a state of supersaturation with respect to calcite throughout vein growth. In other settings (e.g. Rusk & Reed, Reference Rusk and Reed2002; Uysal et al. Reference Uysal, Feng, Zhao, Bolhar, Işik, Baublys, Yago and Golding2011; Tarling et al. Reference Tarling, Smith, Rooney, Vitic and Gordon2021), mineral precipitation into fractures may be linked to fracture opening through feedback loops whereby fracturing depressurizes the fluid or outgasses volatiles, leading to supersaturation. But in contrast, in the present veins, the role of chemical energy appears to have been as a persistent driver of vein widening, complemented to varying degrees by tectonic loads and fluid overpressures.
Refracturing of veins is apparent in thin-section, both in terms of CL-dark bands within the fibrous zones of individual veins, and in deflection of later, oblique veins along earlier veins (Fig. 5). Refracturing consistently occurs at the vein / host-rock interface, where fibrous growth takes place. These observations are consistent with laboratory experiments (Gale & Holder, Reference Gale and Holder2010; Lee et al. Reference Lee, Olson, Holder, Gale and Myers2015) and numerical models (Wu & Olson, Reference Wu and Olson2016; Chen et al. Reference Chen, Yang and Wang2018; Tabatabaei et al. Reference Tabatabaei, Dahi Taleghani and Hooker2021) and support the notion that natural fractures remain planes of physical weakness long after sealing by cement.
6. Conclusions
Calcite-filled fractures in the Marcellus Formation initiated as hydraulic fractures. After initiation, the fractures were filled with calcite, and further widening was accomplished by temporally alternating stages of continuous and punctuated growth. During continuous growth, veins widened as pressure fringes, involving plastic strain and precipitation of fibrous cement. During punctuated growth, brittle cracking events at the plane of weakness represented by the cement / host-rock interface opened ephemeral pore space, which may have enabled fluid flow. The common orientation between the initial opening increment and subsequent ones implies that the brittle opening increments formed in response to the same driving-stress conditions, including remote stresses and fluid pressures. Veins were also mechanically reactivated, forming late-stage, rotated opening increments upon pre-existing veins. These observations suggest that natural calcite veins can widen by multiple mechanisms that can be simultaneously active, and that these veins in the Marcellus shale represent an intermediate between pressure fringes and sealed hydraulic fractures.
Acknowledgements
This study was funded by Shell International Exploration and Production B.V. We thank Lars Hansen for guidance in EBSD imaging. We are grateful to Nicolas Beaudoin, Olivier Lacombe and an anonymous reviewer for valuable comments that improved this paper.


