Introduction
The southern part of Kamchatka Peninsula is famous for a large number of geothermal fields (Fig. 1) (Rychagov et al., Reference Rychagov, Nuzhdaev and Stepanov2014). The latter have been studied extensively due to the high potential for geothermal energy. The area around Kambalny volcano is well-known for geothermal activity with the emissions of CO2, H2S and CH4 gases. The surface of the Severo-Kambalny geothermal field (as well as other geothermal fields in Southern Kamchatka) is usually covered by efflorescences that originate under conditions of: (1) elevated temperature up to ~100°C; and/or (2) acid leaching of primary rocks with the release of elements for the subsequent formation of various exhalative minerals. Mineral assemblages of the Severo-Kambalny geothermal field are represented mostly by water-soluble minerals, usually hydrated sulfates that only appear and remain stable in periods of dry weather. In 2014, uncommon for the region, relatively dry weather conditions occurred for several summer weeks and allowed discoveries of ammoniovoltaite.
Fig. 1. Geographical (upper) and geological (lower) maps of the south-western part of Kamchaka Peninsula (Rychagov et al., Reference Rychagov, Nuzhdaev and Stepanov2014). Key: (1) 1ava-pyroclastic sediments of Neogene age; (2) volcanogenic-sedimentary rocks (tuffites) of Pauzhetka suite; (3) ignimbrites; (4) lava complexes of Koshelev volcanic massif; (5) volcanic rocks (lavas, pyroclastic flows and extrusions) of Kambalny ridge; (6) pumice dacite; (7) subvolcanic and extrusive bodies of basalt and andesite; (8) extrusive subvolcanic bodies of contrasting composition; (9) hydrothermally altered rocks: A – secondary quarzites, W – argillites; (10) geothermal fields: 1 – Perviye goryachuye istochniki, 2 – Pauzhetsky, 3 – Severo-Kambalny (marked by red spot), 4 – Central`no-Kambalny, 5 – Yuzhno-Kambalny, 6 – Verhne-Koshelevsky, 7 – Nizhne-Koshelevsky.
Ammoniovoltaite and associated minerals described in this paper were found prior to the recent eruption of Kambalny volcano in March 2017. The Severo-Kambalny geothermal field is located ~15 km away from the active crater. Neither changes in dimensions nor in geochemical parameters (temperature, pH and Eh) were observed for the Severo-Kambalny field during the summer expeditions in 2014 and 2016 by the Geothermal Laboratory of Institute of Volcanology and Seismology, Russian Academy of Sciences.
Here we describe the new species ammoniovoltaite, ideally (NH4)2Fe2+5Fe3+3Al(SO4)12(H2O)18. The name highlights the composition of the mineral, i.e. ammonium analogue of voltaite. The mineral and its name have been approved by the International Mineralogical Association Commission on New Minerals, Nomenclature and Classification (IMA2017-022, Zhitova et al. Reference Zhitova, Siidra, Shilovskikh, Belakovsky, Nuzhdaev and Ismagilova2017). The type specimen is deposited in the collections of the Fersman Mineralogical Museum of the Russian Academy of Sciences, Moscow, Russia, with the registration number 5030/1 (part of the holotype).
Occurrence
Ammoniovoltaite was found in the central part of the Severo-Kambalny geothermal field (51.42854°N, 156.87341°E), Kambalny volcanic ridge, Kamchatka Peninsula, Russia (Fig. 1). Geothermal fields related to Kambalny volcano are divided into three groups: Severo (=North)-, Yuzhno (=South)-, Central`no (=Central)-Kambalny without a unique name for each thermal anomaly. The Severo-Kambalny group consists of several rather weak and small thermal anomalies and a much larger active field, therefore the name Severo-Kambalny usually refers to the field. The Severo-Kambalny geothermal field (Fig. 2) is located at 900–950 m above sea level and has approximate dimensions of 200 m × 250 m.
Fig. 2. General view (a) and remnants of lava flows covered by white alunogen (b, ~1 m by 2 m field of view) in the Severo-Kambalny geothermal field (Southern Kamchatka, Russia).
Primary lava flows of andesite–basalt, andesite and dacite were converted to variegated clays (Rychagov et al., Reference Rychagov, Sergeeva and Chernov2017) as a result of hydrothermal activity at the Severo-Kambalny geothermal field. Remnants of lava flows are very scarce (Fig. 2). The field is characterized by a number of gas/steam vents (up to 50 cm in diameter) and mudpots (up to 60 cm in diameter). The maximum temperatures of gas/steam vents and mudpots are 99°C and 103°C, respectively. The circulating hydrothermal solution is mainly acidic with pH ranging from 1.9 to 6.7.
The significant ammonium concentration at the geothermal fields in this area was first noted by Nekhoroschev (Reference Nekhoroschev1959) and confirmed later by analyses that reported (NH4)+ in mudpots in the range 10.5–750 mg/l (Ogorodova et al., Reference Ogorodova, Naboko, Fedotov and Vinogradov1971). A high ammonium concentration in hydrothermal solution was also reported for geothermal fields associated with the neighbouring Koshelev volcano (Fig. 1) (Kalacheva et al., Reference Kalacheva, Rychagov, Nuzhdaev and Koroleva2016).
Ammoniovoltaite covers walls in cracks around gas/steam vents in strongly hydrothermally altered remnants of andesite–basalt lava flows (Fig. 2). The temperature of gases at the sampling location was ~100°C. In general, Kambalny geothermal fields are characterized by a high content of pyrite (Rychagov et al., Reference Rychagov, Sokolov and Chernov2010) and the oxidation of primary sulfides causes the formation of secondary sulfates. The mineral is found in close association with alunogen, tschermigite and pyrite (Fig. 3).
Fig. 3. Images of black ammoniovoltaite (amv) in association with white alunogen (alu) under an optical microscope.
General appearance and physical properties
Ammoniovoltaite occurs in aggregates or microscopic euhedral, usually distorted, crystals growing on alunogen plates (Figs 3, 4). The mineral exhibits the following forms: octahedral, cubo-octahedral and cubic (Fig. 4). Ammoniovoltaite is black with greenish grey colour in thin fragments, opaque to translucent and has a vitreous lustre (Fig. 3). The mineral is brittle. The Mohs hardness is ~3–3.5, estimated by: (1) analogy with other group members; and (2) crushing of the mineral grains between slides. Neither cleavage nor parting is observed and the fracture is conchoidal. The mineral is water-soluble and decomposes with formation of acid solution and solid residual.
Fig. 4. Back-scatter electron images of ammoniovoltaite (amv) in association with lammellar aggregates of alunogen (alu).
Macroscopically the mineral is black, even in the smallest visible grains. In plain-polarized light, it is pale greenish-grey and nonpleochroic. Grains and their fragments have an equant shape and no cleavage was observed. The mineral is isotropic. The refractive index is n = 1.602(2) (589 nm).
Infrared spectroscopy
Infrared (IR) spectra were obtained using the KBr pellet method (200 mg of KBr and 2 mg of ammoniovoltaite) and a Bruker Vertex 70 FTIR spectrometer at room temperature.
The IR spectra are shown in Fig. 5. The main absorption bands and their tentative assignments are represented in Table 1 and are in good agreement with the data for ammoniomagnesiovoltaite (NH4)2Mg5Fe3+3Al(SO4)12(H2O)18 (Szakáll et al., Reference Szakáll, Sajó, Fehér and Bigi2012, Chukanov, Reference Chukanov2014) and synthetic (NH4)2Fe2+5Fe3+3Al(SO4)12(H2O)18 (denoted below as NH4-Fe synthetic voltaite as reported in Majzlan et al., Reference Majzlan, Schlicht, Wierzbicka-Wieczorek, Giester, Pöllmann, Brömme, Doyle, Buth and Koch2013). The spectra contain a broad and intensive band ~3400 cm–1 with a shoulder at 3300–2400 cm–1 previously attributed to stretching vibrations of OH (Szakáll et al., Reference Szakáll, Sajó, Fehér and Bigi2012, Chukanov et al., Reference Chukanov, Aksenov, Rastsvetaeva, Möhn, Rusakov, Pekov, Scholz, Eremina, Belakovskiy and Lorenz2016) and NH4 (Majzlan et al., Reference Majzlan, Schlicht, Wierzbicka-Wieczorek, Giester, Pöllmann, Brömme, Doyle, Buth and Koch2013). The split bands at 1691 and 1641 cm–1 were assigned to H–O–H bending vibrations in water molecules. The band at 1433 cm–1 is a distinctive feature of ammonium in voltaites (Szakáll et al., Reference Szakáll, Sajó, Fehér and Bigi2012; Majzlan et al., Reference Majzlan, Schlicht, Wierzbicka-Wieczorek, Giester, Pöllmann, Brömme, Doyle, Buth and Koch2013). Three split bands observed in the region 1200–1000 cm–1 (1124, 1053 and 1003 cm–1) are due to asymmetric and symmetric stretching vibrations of sulfate (Szakáll et al., Reference Szakáll, Sajó, Fehér and Bigi2012). The bands at 893 and 727 cm–1 are attributed to Fe···O–H bending vibrations combined with overtones of Fe···O stretching vibrations. The bands in the region 660–590 cm–1 are assigned to SO4 bending vibrations. The band at 438 cm–1 is due to Fe3+···O bending vibrations and/or ν 2(E) bending vibrations of SO42– (Chukanov et al., Reference Chukanov, Aksenov, Rastsvetaeva, Möhn, Rusakov, Pekov, Scholz, Eremina, Belakovskiy and Lorenz2016).
Fig. 5. IR spectrum of ammoniovoltaite.
Table 1. Wavenumbers (cm–1) of absorption bands in the IR spectra of ammoniovoltaite in comparison to its synthetic analogue and ammoniomagnesiovoltaite.
‘n.a.’ – Observed but wavenumber is not provided.
*As a result of reversible proton transfer SO42– + H2O ↔ HSO4– + OH– (the low intensity of this band indicates that the dynamic chemical equilibrium is strongly shifted to the left).
Mössbauer spectroscopy
Mössbauer spectra were collected at room temperature using a 57Co(Rh) source. The spectrometer was calibrated using the spectra of α-Fe at room temperature. Powdered absorbers were pressed in plastic disks and fixed on an aluminium holder. The density of the natural iron in the absorber was <5 mg/cm2. The spectra were analysed using a Voigt-based quadrupole-splitting distribution (QSD) analysis. The Lorentzian linewidth (Γ) of the symmetrical elemental doublet of the QSD was allowed to vary during the spectra fitting to account for absorber-thickness effects (MossFit software).
The Mössbauer spectra for ammoniovoltaite are shown in Fig. 6 and selected hyperfine parameters are given in Table 2. The spectra of ammoniovoltaite show absorption peaks due to both Fe2+ (the dominant species) and Fe3+. It was fit to a QSD model having two generalized sites, one for Fe2+ (with one Gaussian component) and one for Fe3+ (with one Gaussian component) (Table 2). The comparative data for ammoniovoltaite and its synthetic analogue, NH4-Fe voltaite, (Majzlan et al., Reference Majzlan, Schlicht, Wierzbicka-Wieczorek, Giester, Pöllmann, Brömme, Doyle, Buth and Koch2013) are given in Table 2 from which it can be inferred that Fe2+:Fetot is 0.56 and 0.63 for ammoniovoltaite and its synthetic analogue, respectively. The observed difference originates from occupancy of the octahedral M 2+ site that is populated exclusively by Fe in the synthetic compound (Majzlan et al., Reference Majzlan, Schlicht, Wierzbicka-Wieczorek, Giester, Pöllmann, Brömme, Doyle, Buth and Koch2013), whereas in ammoniovoltaite Mg occupies ~23% of M 2+ (see below) affecting Fe2+:Fetot.
Fig. 6. Mössbauer spectra of ammoniovoltaite.
Table 2. Mössbauer parameters for ammoniovoltaite and its synthetic analogue.
δ – isomer shift, ΔE Q – quadrupole splitting, Г – line width.
Chemical composition
Crystals of ammoniovoltaite were mounted in an epoxy block and polished. The sample was coated with a 10 nm carbon layer for further electron microscopy work. Preliminary quantitative chemical analyses were performed by a scanning electron microscope Hitachi S3400N equipped with an Oxford X-Max 20 energy-dispersive spectrometer. Working conditions were 20 kV accelerating voltage and 1.5 nA beam current. Spectra were obtained at spot mode for 30 s each and revealed that the mineral contains abundant Fe, S, Al, Mg and N and minor Zn, K and Ca. The study of element distributions revealed zoning of ammoniovoltaite crystals mainly in the Fe/Mg ratio (21.08–27.18 wt.% FeO and 0.69–3.72 wt.% MgO) and minor variations in the content of K and Ca (0–0.27 wt.% K2O and 0–0.24 wt.% CaO) (Fig. 7).
Fig. 7. (a, b) Back-scatter electron images of ammoniovoltaite crystals. Dark grey indicates Mg-rich zones and light grey correspond sto Fe-rich compositions (FeO 21.08–27.18 wt.%; MgO 0.69–3.72 wt.%). (c, d) False-colour element-distribution maps. Note the green colour in (с) designates regions enriched with K (0–0.27 wt.% K2O).
Further quantitative element analyses were performed using a scanning electron microscope Hitachi S3400N equipped with an INCA Wave 500 wavelength-dispersive spectrometer (WDS). Operating conditions were as follows: acceleration voltage 20 kV, probe current 10 nA and peak and background acquisition were 30 s and 15 s, respectively. Ammoniovoltaite is unstable under a spot electron beam. Therefore, a defocused beam (5 µm × 5 µm spot size) was used for the analyses. Raw intensity data were corrected using a matrix correction by the ‘XPP’ method (modified φ(ρZ), Pouchou and Pichoir, Reference Pouchou, Pichoir, Heinrich and Newbury1991). For WDS standardization the following reference compounds were used: FeS2 for iron, MgO for magnesium, Zn for zinc, Al2O3 for aluminium, CaSO4 for calcium, KCl for potassium and CaSO4 for sulfur. The chemical composition averaged for six analyses is given in Table 3. It was impossible to separate pure material in the amount sufficient for direct quantitative determination of N and H by gas chromatography. Therefore the amount of N was measured in energy-dispersive spectroscopy (EDS) mode by scanning electron microscopy using BN as the standard. The measurement gave a somewhat overestimated value for N (Table 3). Therefore it was reduced in the chemical formula based on charge-balancing or (NH4) + Ca + K = 2 atoms per formula unit (apfu) (supported by single-crystal structure refinement). The amount of H2O was calculated based on the crystal-structure data. The empirical chemical formula calculated on the basis of S = 12 apfu is [(NH4)1.88K0.08Ca0.04]Σ2.00(Fe2+3.74Mg1.17Fe3+0.05Zn0.01)Σ4.97(Fe3+2.89Al0.09)Σ2.98Al1.00(SO4)12.00(H2O)18.00. The simplified formula is (NH4)2Fe2+5Fe3+3Al(SO4)12(H2O)18. The Gladstone-Dale compatibility index 1–(KP/KC) = –0.015 (superior, for (NH4)2O – 2.96 wt.% [measured]) (Mandarino, Reference Mandarino2007).
Table 3. Chemical composition (in wt.%) of ammoniovoltaite.
aCalculated for the simplified formula (NH4)2Fe2+5Fe3+3Al(SO4)12·18H2O.
bDistinguished by Mössbauer spectroscopy.
cMeasured in EDS mode.
dCalculated from the crystal structure.
Powder X-ray diffraction
Preliminary powder X-ray diffraction (XRD) patterns were obtained by means of a Bruker D2 Phaser diffractometer in Bragg-Brentano geometry operated at 30 kV/10 mA, LYNXEYE detector (CuKα, step scan = 0.02°, counting time = 1 s and 2θ range of 5–55°) and revealed the presence of a voltaite-group mineral, alunogen and tschermigite. Due to the coexistence with tschermigite, ammonium substitution in the voltaite-group mineral was considered to be very probable. The black colour of the mineral indicated that it is not ammoniomagnesiovoltaite which is yellow.
Several crystals of ammoniovoltaite were crushed and mounted in Paraton oil in a loop. The sample was studied by Gandolfi-like motion using a Rigaku RAXIS RAPID II diffractometer (Debye-Scherrer geometry, d = 127.4 mm) equipped with a rotating anode X-ray source (CoKα) and a curved image plate detector. The data were integrated using the software package Osc2Tab/SQRay (Britvin et al., Reference Britvin, Dolivo-Dobrovolsky and Krzhizhanovskaya2017). Topas 4.2 (Bruker-AXS 2009) was used for the refinement of the unit-cell parameters of ammoniovoltaite by the Rietveld method and for indexing of powder XRD data. The structural model in the Fd ![]() $\bar{3}$с space group of the synthetic analogue of ammoniovoltaite (Majzlan et al., Reference Majzlan, Schlicht, Wierzbicka-Wieczorek, Giester, Pöllmann, Brömme, Doyle, Buth and Koch2013) was used initially. Unit-cell parameters refined from the powder XRD data are a = 27.352(1) Å and V = 20462(3) Å3. Indexed powder XRD data are provided in Table 4.
$\bar{3}$с space group of the synthetic analogue of ammoniovoltaite (Majzlan et al., Reference Majzlan, Schlicht, Wierzbicka-Wieczorek, Giester, Pöllmann, Brömme, Doyle, Buth and Koch2013) was used initially. Unit-cell parameters refined from the powder XRD data are a = 27.352(1) Å and V = 20462(3) Å3. Indexed powder XRD data are provided in Table 4.
Table 4. Observed and calculated powder XRD data for ammoniovoltaite.
Single-crystal XRD
Single-crystal XRD data for structure determination were collected at 100 K and room temperature (RT) for two different crystals with MoKα radiation by means of a Bruker APEX II DUO diffractometer operated at 50 kV/40 mA and equipped with a CCD area detector. The data were collected and processed using the Bruker software APEX2 (Bruker-AXS, 2014); details on data collection are in Table 5. A semi-empirical absorption-correction based upon the intensities of equivalent reflections was applied (SADABS, Sheldrick, Reference Sheldrick2015). The diffraction data were indexed in space group Fd ![]() $\bar{3}$с with a = 27.250(1) Å at 100 K and a = 27.322(1) Å at RT (Table 5). The atomic coordinates, isotropic displacement parameters and site occupancies are given in Table 6, anisotropic displacement parameters are provided in Table 7. Selected bond distances are listed in Table 8. The crystallographic information files have been deposited with the Principal Editor of Mineralogical Magazine and are available as Supplementary material (see below).
$\bar{3}$с with a = 27.250(1) Å at 100 K and a = 27.322(1) Å at RT (Table 5). The atomic coordinates, isotropic displacement parameters and site occupancies are given in Table 6, anisotropic displacement parameters are provided in Table 7. Selected bond distances are listed in Table 8. The crystallographic information files have been deposited with the Principal Editor of Mineralogical Magazine and are available as Supplementary material (see below).
Table 5. Crystallographic data, data collection information and refinement parameters for ammoniovoltaite.
Table 6. Atom coordinates, site occupancies and equivalent isotropic displacement parameters (Å2) for ammoniovoltaite.
1In agreement with the formula obtained by microprobe and Mössbauer data, [(NH4)1.88K0.08Ca0.04]Σ2.00(Fe2+3.74Mg1.17Fe3+0.05Zn0.01)Σ4.97(Fe3+2.89Al0.09)Σ2.98Al1.00(SO4)12.00(H2O)18.00; 2Site scattering in electrons per formula unit; 3 Calculated site scattering in electrons per formula unit.
Table 7. Anisotropic displacement parameters (Å2) of atoms in the structure of ammoniovoltaite.
Table 8. Selected bond lengths (Å) in the structure of ammoniovoltaite.
The structure refinements were performed using SHELXL software (Sheldrick, Reference Sheldrick2015). The initial atomic coordinates for the structure refinements were taken from the structure reports of voltaite published by Mereiter (Reference Mereiter1972) and Majzlan et al. (Reference Majzlan, Schlicht, Wierzbicka-Wieczorek, Giester, Pöllmann, Brömme, Doyle, Buth and Koch2013) except for the O6w and O7w sites and hydrogen atoms of the O5w oxygen atom belonging to water molecules. All non-hydrogen atoms were refined anisotropically. Although several peaks are observed around the A site (A = N0.96K0.02Ca0.02), hydrogen atoms of the ammonium group were removed from the refinement as they are strongly disordered. Site occupancies of the mixed- and partially occupied sites A, M1 and M2 were refined (Table 6). Hydrogen atoms for the O5w water molecule were located from the difference-Fourier map, the O–H bonds were softly restrained at the distance 0.96(4) Å.
The bond-valence sums in valence units (vu) are 3.00 for M1, 2.26 for M2, 3.21 for Al and 5.98 for S sites calculated using bond-valence parameters from Gangé and Hawthorne (Reference Gangé and Hawthorne2015). The bond-valence sums were calculated on the basis of the following assumed site occupancies: M1 = Fe3+, М2 = Fe2+0.62Mg0.20Fe3+0.17Zn0.01, S = S and Al = Al. A bond-valence sum for the A site was not calculated as hydrogen atoms of ammonium groups were not localized.
Description of the crystal structure
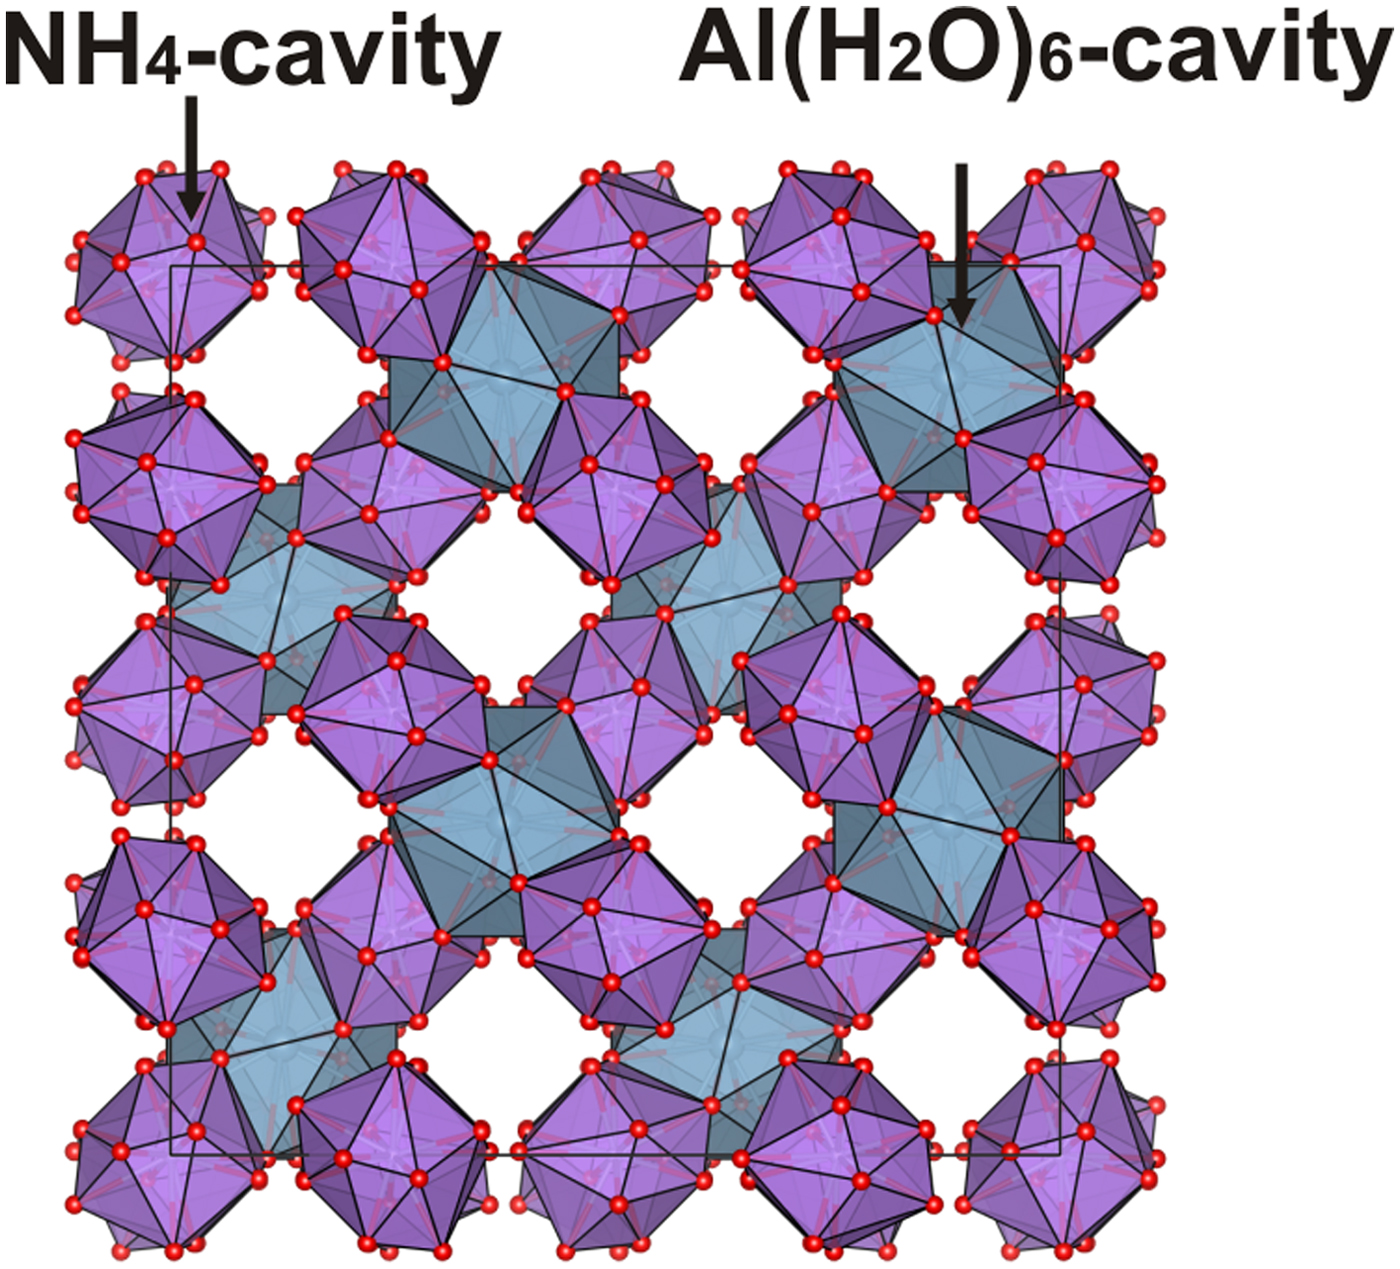
The crystal structure of ammoniovoltaite is isotypical with that of voltaite and other cubic members of the group and their synthetic analogues (Table 9). The crystal structure of ammoniovoltaite consists of kröhnkite-like chains running along the diagonal between two crystallographic axes. These chains are built by alternating M2X 6 (X 6 = O2–4, (H2O)2 and M1O6 octahedra linked via SO4 tetrahedra (Fig. 8a). The M2 site is occupied mainly by divalent cations, whereas the M1 site is preferable for trivalent cations. The three-dimensional arrangement of kröhnkite-like chains produces the framework (Hawthorne et al., Reference Hawthorne, Krivovichev, Burns, Alpers, Jambor and Nordstrom2000) shown in Fig. 8b. The framework contains two types of interstitial cavities: (1) those formed by M2X 6 octahedra and SO4 tetrahedra and occupied by (NH4)+ molecules; and (2) those formed by M1O6 octahedra and SO4 tetrahedra and occupied by large [Al(H2O)6]3+ complexes (Fig. 8). The following distances (values are given for data collected at 100 K) are observed for the first cavity-hosting ammonium ions: A–O3 = 3.317 Å and A–O4 = 2.900 Å. Therefore the coordination environments of the A site may be represented as a 12-vertex polyhedron with <A–O> = 3.108 Å and polyhedral volume (![]() $V_{{\rm Al}{\rm O}_{{\rm 12}}}$) 72.2 Å3. The cavity occupied by Al(H2O)6 complexes is formed by twelve O4 atoms with Al–O4 = 4.017 Å and
$V_{{\rm Al}{\rm O}_{{\rm 12}}}$) 72.2 Å3. The cavity occupied by Al(H2O)6 complexes is formed by twelve O4 atoms with Al–O4 = 4.017 Å and ![]() $V_{{\rm Al}{\rm O}_{{\rm 12}}}$ = 157.3 Å3 (Fig. 9). The NH4 hosting cavities are arranged around Al(H2O)6-cavites in a tetrahedral manner.
$V_{{\rm Al}{\rm O}_{{\rm 12}}}$ = 157.3 Å3 (Fig. 9). The NH4 hosting cavities are arranged around Al(H2O)6-cavites in a tetrahedral manner.
Fig. 8. (a) General projection of the crystal structure of ammoniovoltaite. Kröhnkite-type chains are highlighted and Al(H2O)6 groups are omitted (designated by blue circles) for clarity. (b) Three-dimensional framework of ammoniovoltaite.
Fig. 9. Three-dimensional arrangement of NH4- (purple) and Al(H2O)6 (grey) hosting cavities in the crystal structure of ammoniovoltaite.
Table 9. Comparative data for ammoniovoltaite, its synthetic analogue and voltaite-group minerals.
*Synthetic analogue of ammoniovoltatite (NH4-Fe).
aRT value, a = 27.250(1) at 100 K; bat 120 K; ccalculated using the cif (ICSD 188360).
n.a. – not analysed or not available.
From the data provided by Majzlan et al. (Reference Majzlan, Schlicht, Wierzbicka-Wieczorek, Giester, Pöllmann, Brömme, Doyle, Buth and Koch2013) it can be concluded that for K-dominant synthetic voltaites, the <A–O> ranges within 3.02–3.08 Å with the highest value attributed to K-Fe species, whereas for NH4-dominant voltaites the <A–O> is slightly longer being 3.11 and 3.10 Å for NH4-Fe and NH4-Mn forms, respectively. In ammoniovoltaite <A–O> is 3.11 at 100 K and 3.12 at RT that suggests that the <A–O> distance may be a useful sign of occupancy of the A site in voltaites.
The observed <S6+–O> distances (Table 8) are 1.472 Å (at 100 K) and 1.470 Å (at RT) and fall within the range reported for synthetic voltaites: 1.470–1.475 Å (Majzlan et al., Reference Majzlan, Schlicht, Wierzbicka-Wieczorek, Giester, Pöllmann, Brömme, Doyle, Buth and Koch2013). The range of <Al–O> distances for synthetic voltaites is 1.83–1.87 Å (Majzlan et al., Reference Majzlan, Schlicht, Wierzbicka-Wieczorek, Giester, Pöllmann, Brömme, Doyle, Buth and Koch2013) and our values [1.880 Å (at 100 K) and 1.874 (at RT), Table 8] are very similar. The <M2–X > distance shows broad variations in synthetic voltaites (2.03–2.17 Å) depending on the radii of the dominant divalent cation (Majzlan et al., Reference Majzlan, Schlicht, Wierzbicka-Wieczorek, Giester, Pöllmann, Brömme, Doyle, Buth and Koch2013). However, the values of < M2–X > obtained in our study coincides with the value reported for NH4-Fe voltaite (Majzlan et al., Reference Majzlan, Schlicht, Wierzbicka-Wieczorek, Giester, Pöllmann, Brömme, Doyle, Buth and Koch2013) despite the fact that the occupancy of M2 site is different for the two (Fe in the synthetic and Fe, Mg in the natural sample). No direct correlation is observed between <M1–O> and occupancy of the M1 site as reported in the series M1 = Fe3+ studied by Majzlan et al. (Reference Majzlan, Schlicht, Wierzbicka-Wieczorek, Giester, Pöllmann, Brömme, Doyle, Buth and Koch2013), but <M1–O> varies in the range 1.97–2.08 Å. The NH4-Fe sample is reported with <M1–O> = 1.97 Å, while our value is slightly larger, 2.00 Å (Table 8).
Discussion
Ammoniovoltaite is a new member of the voltaite group (Table 9), and is the NH4-analogue of voltaite and the Fe2+-dominant analogue of ammoniomagnesiovoltaite. It is also the first ammonium-dominant voltaite-group mineral with a determined crystal structure. The synthetic analogue of ammoniovoltaite was previously obtained and studied by Sajó (Reference Sajó2012) and Majzlan et al. (Reference Majzlan, Schlicht, Wierzbicka-Wieczorek, Giester, Pöllmann, Brömme, Doyle, Buth and Koch2013). Previous comprehensive studies of synthetic voltaites (Beveridge and Day, Reference Beveridge and Day1979; Gossner and Bäuerlein, Reference Gossner and Bäuerlein1930, Reference Gossner and Bauerlein1933; Gossner and Fell, Reference Gossner and Fell1932; Gossner and Besslein, Reference Gossner and Besslein1934; Majzlan et al., Reference Majzlan, Schlicht, Wierzbicka-Wieczorek, Giester, Pöllmann, Brömme, Doyle, Buth and Koch2013) showed evidence for incorporation into the voltaite-type structure of a number of different divalent M 2+ cations (M 2+ = Fe, Mg, Zn, Cd, Co and Mn) in comparison to the natural members (M 2+ = Fe, Mg and Zn). The A site is populated in natural species either by NH4+ or K+ with minor contents of other alkali and alkali-earth metals such as Na and Ca, whereas synthetic samples were also obtained with Tl+ and Rb+ (Gossner and Fell, Reference Gossner and Fell1932; Gossner and Besslein, Reference Gossner and Besslein1934).
The ammonium ion is characteristic of specific geological conditions. Ammoniovoltaite was discovered at a geothermal field characterized by a high ammonium concentration. Another (NH4)+ member of the voltaite group, ammoniomagnesiovoltaite, was found in a burning coal dump (Szakáll et al., Reference Szakáll, Sajó, Fehér and Bigi2012). The question of ammonium sources and distribution of ammonium minerals are worth a more detailed discussion. The current IMA list contains 67 ammonium minerals (mostly sulfates) out of 5224 approved mineral species. The majority of these minerals originates from: (1) volcanic activity (~29%) (Table 10); (2) guano decomposition (~25%) [e.g. möhnite (Chukanov et al., Reference Chukanov, Aksenov, Rastsvetaeva, Pekov, Belakovskiy and Britvin2015), niahite (Bridge and Robinson, Reference Bridge and Robinson1983) and struvite (Maclvor, Reference Maclvor1887; Yang et al., Reference Yang, Martinelli, Tasso, Sprocati, Pinzari, Liu, Downs and Sun2014)]; and (3) black lignitic shales, burning coal seams or natural fires in oil-bearing shale (19%) [e.g. ammoniomagnesiovoltaite (Szakáll et al., Reference Szakáll, Sajó, Fehér and Bigi2012), carlsonite and huizingite-(Al) (Kampf et al., Reference Kampf, Richards, Nash, Murowchick and Rakovan2016)].
Table 10. List of volcanogenic ammonium minerals.
Regarding volcanically active geological environments, ammonium minerals are reported at: (1) fumaroles of active volcano cones; (2) gas/steam vents and/or efflorescence areas at geothermal fields and (3) the surface of fresh lava flows.
Active volcano cones
The locality with the largest reported number of ammonium minerals to date is La Fossa crater, Vulcano, Aeolian Islands, Sicily, Italy (Campostrini et al., Reference Campostrini, Demartin, Gramaccioli and Russo2011), which is an active volcano cone and type locality of seven ammonium sulfates and five ammonium halides (Table 10). Ammonium minerals at La Fossa crater are reported as sublimates around fumaroles formed at temperatures of ~170–350°C (e.g. argesite, lucabindiite and pyracmonite). Another example of an active volcano cone where ammonium mineralization has been reported is Mt Vesuvius, Naples Province, Campania, Italy.
Lava flows
Sal ammoniac (NH4Cl) is a relatively abundant natural phase occurring at the surface of the fresh lava flows (e.g. Tolbachik eruptions; Fedotov and Markhinin, Reference Fedotov and Markhinin1983).
Geothermal fields
Until recently, most of the ammonium minerals first discovered at geothermal fields were reported from the Larderello–Travalle geothermal province (Table 10) and first described before 1911 (the time when the first geothermal power plant was built). Ammonium mineralization is also reported from the Geysers geothermal system, California, USA (Dunning and Cooper, Reference Dunning and Cooper1993) and a number of other localities in California, USA (Krohn et al., Reference Krohn, Kendall, Evans and Fries1993) (Table 10).
For geothermal fields located in Southern Kamchatka (Fig. 1) two potential sources of nitrogen are discussed: (1) deep magmatic or/and (2) biogenic from underlying sedimentary rocks containing organic material. The isotope study performed on ammonium minerals including geothermal fields at Kambalny volcanic ridge (Volynets et al., Reference Volynets, Zadorozhnyy and Florenskiy1967) provided a broad range of δ N15 (= 15N:14N) that did not allow the source of N to be established for certain. The nitrogen source for Southern Kamchatka geothermal fields associated with Kambalny and Koshelev volcanos remains unclear at present and requires additional isotope studies.
Acknowledgements
We are grateful to Uwe Kolitsch, Nikita V. Chukanov and Peter Leverett for very helpful comments on the manuscript. This study was supported by the Russian Foundation of Basic Research, 16-05-00007 (field works and part of the study) and Russian Science Foundation, 16-17-10085 (structural studies). We thank Dr. Alexey Goncharov (Dept. Geochemistry, SPbSU) for collecting and interpretation of Mössbauer spectra. The technical support by the SPbSU X-Ray Diffraction and Geomodel Research Resource Centers is gratefully acknowledged.
Supplementary material
To view supplementary material for this article, please visit https://doi.org/10.1180/minmag.2017.081.083