


INTRODUCTION
Contemporary and traditional classifications of higher vertebrates are based in large part on assessments of similarities in adult structures of living and fossil forms. Interpretation of differences in size and shape of homologous structures in different taxa as resulting from differences in rates and timing of growth and development is almost axiomatic (Alberch, Reference Alberch1980). Obviously, the different growth patterns in the skulls of animals significantly influence their morphogenesis and production of the final form (Richtsmeier et al., Reference Richtsmeier, Corner, Grausz, Cheverud and Danahey1993). These are usually determined not only by an individual's genome, but by an array of environmental factors that functionally influence the growth of certain regions (e.g. Herring, Reference Herring1993). Developmental processes produce morphological variation and constraints, and consequently affect evolutionary processes. Because they determine the growth curves, they influence the extent to which values of the same trait at different ages can vary independently (Cheverud, Reference Cheverud1983). Growth processes not only produce variation in morphometric traits, but they can also eliminate it by compensatory growth, such that all individuals converge toward a ‘target’ size as adults (Klingenberg, Reference Klingenberg1996). Compensatory modifications in rate and duration may sometimes occur, so that growth rates slow, while the duration of that interval lengthens, and the rate of development (relative to growth) is unchanged. To detect this kind of compensatory change, chronological age information is required (Zelditch et al., Reference Zelditch, Fink, Swiderski and Zelditch2001).
Otherwise, the degree of maturity of the skull shape appears to be a remarkably good predictor of maturity. We may be able to use it to infer life-history strategies (Zelditch et al., Reference Zelditch, Lundrigan, Sheets and Theodore2003). Additionally, growth and sexual dimorphism are often correlated (i.e. a high sexual dimorphism is often correlated with greater size, Brunner, Reference Brunner2004), and the first principal component of sexual dimorphism is known for many pinniped species. Despite this, sometimes determining the sex of a skeleton or skull is not easy in immature specimens (Molina-Schiller, Reference Molina-Schiller2000; Molina-Schiller & Pinedo, Reference Molina-Schiller and Pinedo2004a).
Sexual size dimorphism is produced proximately by differences in patterns of growth between the sexes; thus, selection acting on the growth of males and females will result in changes in sexual size dimorphism of adults (Leutenegger & Masterson, Reference Leutenegger and Masterson1989). An ontogenetic approach to sexual dimorphism is essential because: (1) it is the entire pattern of sex-differentiated growth, not merely the adult end points, that is adaptive and the target of selection; and (2) a given adult may be produced by very different developmental processes (e.g. ontogenetic scaling and/or acceleration), indicating selection for quite different factors (Leutenegger & Masterson, Reference Leutenegger and Masterson1989). In addition, growth studies offer one method of investigating the developmental pathway of an organism and the ways in which that pathway might be altered (Fiorello & German, Reference Fiorello and German1997).
Growth has been modelled in several ways, but, in order to be a useful tool for comparing data on growth and development among taxa, the model selected should describe growth precisely, as well as being flexible (Creighton & Strauss, Reference Creighton and Strauss1986).
In the study of growth, three asymptotic models are used most often: (1) the von Bertalanffy, (2) the Gompertz and the (3) Richards growth models. The first one has been widely used to describe asymptotic growth in fishes (Misra, Reference Misra1986), but has also been applied to a variety of long-lived mammals (e.g. Ursus maritimus, Kingsley, Reference Kingsley1979; Phocoena phocoena, Stuart & Morejohn, Reference Stuart and Morejohn1980; Phoca groenlandica, Innes et al., Reference Innes, Steward and Lavigne1981; Otaria flavescens, Rosas, Reference Rosas1989; Arctocephalus australis, Molina-Schiller & Pinedo, Reference Molina-Schiller and Pinedo2004b; Odobenus rosmarus rosmarus, Knutsen & Born, Reference Knutsen and Born1991; Tursiops truncatus, Barreto, Reference Barreto2000 and Cephallorhynchus commersonii, del Castillo et al., Reference del Castillo, Segura, Flores and Cappozzo2016). The Gompertz growth model has been used to describe growth in Delphinapterus leucas (Stewart, Reference Stewart1994), Phoca groenlandica (Innes et al., Reference Innes, Steward and Lavigne1981), and Pontoporia blainvillei (Ramos et al., Reference Ramos, Di Beneditto, Siciliano, Santos, Zerbini, Bertozzi, Vicente, Zampirolli, Alvarenga and Lima2002). The Richards growth model has been used for Odobenus rosmarus rosmarus (Garlich-Miller & Stewart, Reference Garlich-Miller and Stewart1998).
Callorhinus ursinus is the extant otariid closest to the ancestor of the family Otariidae, and O. byronia seems to be the most derived (Berta & Churchill, Reference Berta and Churchill2012). Morphometric studies on these species were done by Brunner (Reference Brunner2000), Brunner et al. (Reference Brunner, Bryden and Shaughnessy2003), Brunner (Reference Brunner2004), Molina-Schiller & Pinedo (Reference Molina-Schiller and Pinedo2004a, Reference Molina-Schiller and Pinedob), and Oliveira et al. (Reference Oliveira, Hingst-Zaher and Morgante2005). However, few studies have compared the developmental and growth rates in skulls of otariids (Brunner et al., Reference Brunner, Bryden and Shaughnessy2003; Tarnawski et al., Reference Tarnawski, Cassini and Flores2013).
We examined the skulls of Arctocephalus australis, Callorhinus ursinus and Otaria byronia with the objectives of (1) estimating the development and growth rates and comparing these parameters among the species; (2) describing the development for each linear measure, for each species and sex; (3) determining which variables are best correlated with age; (4) determining age of physical maturity. These analyses will be important to understand the relationships between development and evolution.
MATERIALS AND METHODS
Samples
We examined skulls of three otariid species: 149 Arctocephalus australis (65 females and 84 males); 54 Callorhinus ursinus (28 females and 26 males), and 292 Otaria byronia (133 females and 159 males) (Appendix 1, Table 1). The skull specimens were obtained from institutions and museums in Argentina, Brazil, Uruguay and the USA.
Table 1. Number of specimens used in traditional methods and in geometric methods.

n, sample number; SD, standard deviation; Min., minimal length of the skull (cm); Max., maximum length of skull (cm).
We performed analysis using both linear and geometric approaches to compare the results between them.
Age determination
Ages were estimated from the upper canine teeth. The teeth were cut in half, etched in 5% formic acid, and rubbed with graphite powder (Pierce & Kajimura, Reference Pierce, Kajimura, Perrin and Myrick1980; Schiavini et al., Reference Schiavini, Lima and Batallés1992; Rosas et al., Reference Rosas, Haimovici and Pinedo1993; Molina-Schiller, Reference Molina-Schiller2000). The Growth Layer Groups (GLGs) in the dentine and cementum of the teeth were counted. We interpreted each GLG as equivalent to one year's growth (Perrin & Myrick, Reference Perrin and Myrick1980; Schiavini et al., Reference Schiavini, Lima and Batallés1992). For samples size for each species and GLG (years) see Figure 1.

Fig. 1. Histograms of age structure of the samples for each analysed species.
Analysis of metric characters using linear measurements
Twenty-one cranial measurements were utilized (Figure 2) follow Hue (Reference Hue1907), Committee On Marine Mammals (1967), Burns et al. (Reference Burns, Fay, Fedoseev, Fay and Fedoseev1984), Fedoseev (Reference Fedoseev, Fay and Fedoseev1984), Wiig & Lie (Reference Wiig and Lie1984), Ximénez et al. (Reference Ximénez, Lima, Ponce de León, Batallés and Malek1984), Kerley & Robinson (Reference Kerley and Robinson1987), Wyss (Reference Wyss1987) and Drehmer & Ferigolo (Reference Drehmer and Ferigolo1997). The data for each sex were examined independently, to test for sexual dimorphism (Mansfield, Reference Mansfield1958).

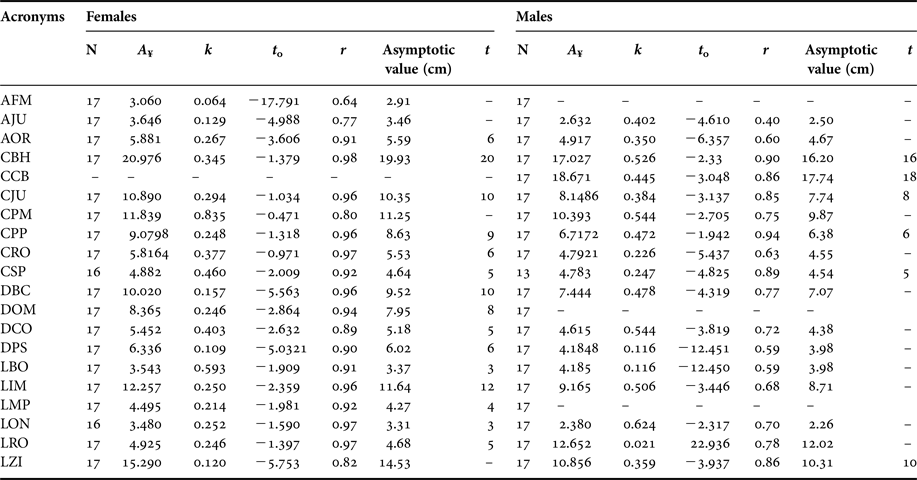
Fig. 2. Skull measurement of otariids used in the traditional morphometrics analysis in the dorsal, ventral, lateral, and occipital view of the skull: maximum height of the foramen magnum (AFM), maximum height of the jugal (AJU), maximum width of the orbit (AOR), basilar length of Hensel (CBH), condylobasal length (CCB), length of the jugal (CJU), distance between the palate and the foramen magnum (CPM), palate length (CPP), rostrum length (CRO), post-canine series length (CSP), distance between the tympanic bulla and the sagittal crest (DBC), distance between the optical foramen and the foramen magnum (DOM), maximum distance between the condyles (DCO), maximum distance between the supraorbital processes (DPS), basioccipital width (LBO), maximum width of braincase (LCC), minimum width at the inter-orbital constriction (LCO), maximum width between the mastoid processes (LIM), maximum width of palate (LMP), maximum width of nasal orifice (LON), maximum width of rostrum (LRO), maximum width of the zygomatic arch (LZI).
The Gompertz equation (McLaren, Reference McLaren1993) was used to describe cranial development for each linear variable according to sex, and to determine which variables were better correlated with age. This model presents better fit in comparison with the Von Bertalanffy or Richard's models (convergence on the growth curves). However, the model does not fit some variables, and the respective parameters were not calculated because of the redundancy shown.
The Gompertz equation is:
 $$S_t = A_\infty \times e^{ - e^{ - k(t - t_0{\rm )}}},$$
where: S t, is the value of the measurement at age t; A ¥ is the asymptotic length (e.g. the average length that the species reaches if it grows indefinitely); t is a unit of time in years (estimated from growth-layer groups present in each tooth); k is the growth-rate constant; t 0 is the hypothetical age at which the species has length equal to zero); and e is the natural logarithm base. The growth models were adjusted to the data by minimizing the sum of squared residuals using the quasi-Newton interaction method (non-linear module) of the program Statistics 5.0. for Windows. Growth curves were calculated separately for males and females.
The age of attainment of physical maturity (t) in the skull was estimated from the 95% asymptotic length attained for each variable in relation to the growth curve. Only variables with a high correlation (r ≥ 0.85) in the Gompertz curve were selected for growth analysis. When the estimates for attainment of skull physical maturity differed among the linear skull measures, the median was obtained (age of all variables selected), and that age was considered the age of attainment of physical maturity.
To test for sexual dimorphism, male and female growth-curve asymptotes were compared using Student's t test for unequal sample sizes and unequal variances (Glantz, Reference Glantz1992) and the Hotelling T 2 multivariate test with the program Statistica for Windows 5.0 (StatSoft Inc., Tulsa, OK). Sex-related differences in growth rates were described by polling the differences in predicted length between male and female models as a function of age (ΔPredicted length = Predicted length of the males − Predicted length of the females).
Rates and timing of development and growth using geometric morphometric techniques
To examine the ontogeny of shape, we used additional landmark-based geometric morphometrics. Landmarks were measured on the ventral face of the skull (Figure 3), the view with more anatomical details for detecting shape changes. All the images were taken according to Zelditch et al. (Reference Zelditch, Swiderski, Sheets and Fink2004). Skulls were photographed with the bony palate oriented parallel to the photographic plane. Landmark configurations were superimposed using the generalized least-squares superimposition, and the statistical analyses were performed on partial warp scores, including the scores of the uniform component (Bookstein, Reference Bookstein1989, Reference Bookstein1991).

Fig. 3. Landmarks for ventral view of the skull of otariids were defined as follows: (1) anteriormost point of premaxilla tuberosity; (2) antero-lateral extremity of third incisive alveolus; (3) anteriormost point of incisive foramen; (4) lateral extremity of canine alveolus; (5) anteromedial point of first post-canine alveolus; (6) anteriormost point of the maxilla-palatine suture, (7) point that labels the direction change of the maxilla-palatine suture; (8) posteriormost point of the root at the lateral limit at bone palate of zygomatic process of the maxilla; (9) posteriormost point of sixth post-canine alveolus; (10) posteriormost point of palatine extension of maxilla (‘pterygoid’ process of the maxilla); (11) posteriormost point of interpalatine suture; (12) point that labels the direction change of the posterior border of the palatine; (13) posteriormost extremity of the oval foramen; (14) lateral extremity of the jugal-esquamosal suture; (15) medial extremity of the contact between the glenoid fossa and the ectotympanic; (16) anteriormost extremity of the anterior aperture of carotid canal; (17) antero-lateral corner of mastoid process; (18) posteriormost point of the condiloid foramen; (19) posteriormost point of occipital condyle; (20) anteriormost point of foramen magnum.
To estimate rates of maturity, it is important that samples be large enough to allow reliable estimates of the mean shape for each age (more than six specimens for each year). To estimate rates of development, we measured the rate at which the shape gradually differentiates away from that of the stage at age zero.
We measured the degree of shape differentiation by the morphometric distance between each individual and the average of the youngest age class, using the Procrustes distance (Bookstein, Reference Bookstein, Marcus, Corti, Loy, Nayulor and Slice1996). Growth rates were estimated by the rate of increase in centroid size. We used this metric to compare the skulls of A. australis, C. ursinus and O. byronia.
To estimate the rate and timing parameters, eight standard growth models were fitted to the Procrustes distances and centroid sizes: (a) the flexible Chapman–Richards model (Gaillard et al., Reference Gaillard, Pontier, Allaine, Lison, Herve and Heizmann1997); (b) the monomolecular model (Gaillard et al., Reference Gaillard, Pontier, Allaine, Lison, Herve and Heizmann1997); (c) the von Bertalanffy model (Zullinger et al., Reference Zullinger, Ricklefs, Redford and Mace1984); (d) the Gompertz model (Zullinger et al., Reference Zullinger, Ricklefs, Redford and Mace1984); (e) the German Gompertz model (Fiorello & German, Reference Fiorello and German1997); (f) the logistic model (Gaillard et al., Reference Gaillard, Pontier, Allaine, Lison, Herve and Heizmann1997); (g) a quadratic function; and (h) a linear function (for each equation see Zelditch et al., Reference Zelditch, Lundrigan, Sheets and Theodore2003). Models were fitted to the data using the Nelder–Mead simplex with a least-squares error criterion (Press et al., Reference Press, Teukolsky, Etterling and Flannery1992). This procedure, similar to a maximum-likelihood model, assumes that residuals are normally distributed and independent. To check whether the data met that assumption, we examined the residuals for evidence of autocorrelation.
Models showing statistically significant autocorrelations of residuals were rejected for further consideration. The others were evaluated in terms of percentage of variance explained (to test by bootstrap if the observed fit of the models to the data really exceeded that expected by chance), and then we evaluated them for relative goodness of fit (employing the Akaike information criterion, AIC, an estimate of the Kullback–Leibler information distance between the data and the model; see Akaike, Reference Akaike1974). The AIC score balances the likelihood of the parameters given the data and the number of parameters in the model (complexity). The AIC weight (calculated from the AIC scores) gives an estimate of the relative probability that a given model is correct, providing a criterion for model choice.
Using the best-fitting model, we calculated the parameters for development and growth, placing confidence intervals on the parameters by bootstrap. The relative degree of maturity (in both size and shape) was then estimated from the parameters of the best-fitting model (by predicting the values for each age and estimating the proportion of adult maturity or adult size attained at a certain age). To determine relative degree of shape and size at maturity for a given age and to determine the time of development and growth in each species and sex group, we measured the length of the vector in Procrustes Distance over a range of ages (here, one year), and compared that for each species and sex group.
The calculation of the variance explained by the model, the significance of the autocorrelations, the parameter estimation and calculation of confidence intervals, the model evaluation itself, and the estimation of maturity in size/shape were done by means of GrowChoice – IMP series (Sheets, Reference Sheets2000).
The differences between rates of change in males and females of the same species or between species (comparisons within the same sex) were tested by a non-analytic test (resampling F-test based in shape coordinates). The bootstrapping-based tests calculate an F-score using the Procrustes Superimposition. Next, we determined the probability that the observed F-value could have been generated by chance. To perform the bootstrapping procedure, the two groups were pooled. After that, two groups of equal sample size to the original data sets were drawn with replacement from the common pool. The distribution of bootstrapped F-values over 100 bootstrap data sets was used to determine the probability that the observed F-value could have arisen by chance.
RESULTS
Analysis of metric characters using traditional (linear) measurements
ARCTOCEPHALUS AUSTRALIS
The correlation coefficient (r) obtained from the Gompertz model indicated that three characters (13.6%) in females and 10 characters (45.5%) in males showed a larger correlation with age (r ≥ 0.85) (Table 2). In females the variables most highly correlated with age were the rostrum length (r = 0.88), followed by maximum width between the mastoid processes (r = 0.85), whereas between the males the variables were the length of the jugal and the maximum width of the zygomatic arch (r = 0.91), and maximum width between the mastoid processes (r = 0.90). The variables least correlated with age were, in females, the maximum width of the braincase (r = 0.29), and maximum distance between the supraorbital processes (r = 0.41), whereas those in males were the maximum height of the foramen magnum (r = 0.31), and distance between the optical foramen and the foramen magnum (r = 0.53) (Table 2). The metric characters showed different patterns in growth coefficient for males and females, and the females seemed to be more accelerated (Table 2). In females, the maximum width of the braincase showed the faster growth (k = 0.939), followed by maximum distance between the supraorbital processes (k = 3.95), and the maximum height of the jugal (k = 0.328). A slower growth was observed in the distance between the palate and the foramen magnum (k = 0.105) and maximum width of the nasal orifice (k = 0.120) (Table 2).
Table 2. Parameters of the Gompertz equation for females and males of Arctocephalus australis.

A ¥, asymptotic length (cm); k, growth-rate constant; t 0, hypothetical age at which the species has length equal to zero; r, correlation coefficient in relation to age; t, age in years.
In males, the maximum distance between the condyles grew fastest (k = 0.163), followed by palate length (k = 0.145). The maximum height of the jugal had a slower growth (k = 0.007), followed by the distance between the tympanic bulla and the sagittal crest (k = 0.077) (Table 2).
Differences between sexes were observed in the stabilization of the asymptotic growth of the characters selected with r ≥ 0.85. In females, the stabilization of asymptotic growth at 95% of distance between the palate and foramen magnum stabilized at 8 years of age. However, rostrum length stabilized at 9 years of age, and maximum width between the mastoid process at 3 years of age (Table 2). Considering that the median age of all variables selected was 8 years of age, we considered that females attain physical maturity of the skull at about 8 years of age.
In males, the stabilization of asymptotic growth at 95% of maximum height of the jugal was at 4 years of age. The stabilization of the asymptotic growth started at 7 years of age in three variables (maximum distance between the supraorbital process, maximum width of the nasal orifice, and maximum width of the rostrum). However, length of the jugal, and the distance between the tympanic bulla and the sagittal crest stabilized at 12 years. The stabilization of maximum width between the mastoid processes was at 14 years, while the maximum width of the zygomatic arch stabilized at 16 years. The basilar length of Hensel stabilized at 23 years of age. The mean or median age of all variables selected was 11 years of age. Therefore, we considered that males attain physical maturity of the skull at about 11 years of age.
Student's t-test showed a significant difference (P < 0.001) between sexes (APC and LPC for physically mature skulls and DBC, DPS, LCO, LMP, LRO and LZI for physically immature skulls). In addition, the results of the Hotelling T 2 multivariate test indicated the presence of sexual dimorphism (P < 0.05) for physically immature and physically mature skulls. In physically immature skulls, seven variables were dimorphic: distance between the tympanic bulla and the sagittal crest, maximum distances between the supraorbital processes, maximum distance between the condyles, minimum width at the inter-orbital constriction, maximum width of the palate, maximum width of the rostrum, and maximum width of the zygomatic arch. In physically mature skulls, 16 variables were sexually dimorphic: basilar length of Hensel, condylobasal length, length of jugal, distance between the palate and the foramen magnum, palate length, rostrum length, distance between the tympanic bulla and the sagittal crest, maximum distance between the condyles, maximum distance between the supraorbital processes, basioccipital width, maximum width of palate, maximum width of rostrum and maximum width of the zygomatic arch.
CALLORHINUS URSINUS
The correlation coefficient (r) showed that 15 characters (63.63%) in females and six characters (27.27%) in males had a larger correlation coefficient with age (r ≥ 0.85) (Table 3). In females, the basilar length of Hensel was the variable most highly correlated with age (r = 0.98), followed by rostrum length, maximum width of nasal orifice and maximum width of rostrum(r = 0.97), whereas those in males were palate length (r = 0.94), followed by basilar length of Hensel (r = 0.90). In females, the lowest correlation with age was observed for maximum height of the foramen magnum (r = 0.64), whereas that in males was for maximum height of the jugal (r = 0.40) (Table 3).
Table 3. Parameters of the Gompertz equation for females and males of Callorhinus ursinus.
A ¥, asymptotic length (cm); k, growth-rate constant; t 0, hypothetical age at which the species has length equal to zero; r, correlation coefficient in relation to age.
The growth constant (k) was higher for females than for males. In females, the distance between the palate and the foramen magnum showed the fastest growth (k = 0.835), followed by basioccipital width (k = 0.593). A slower growth was observed in the maximum width of the zygomatic arch (k = 0.120), followed by maximum height of the jugal (k = 0.129) (Table 3).
In males, the maximum width of the nasal orifice grew fastest (k = 0.62), followed by distance between the palate and the foramen magnum and maximum distance between the condyles (k = 0.544) (Table 3). A slower growth was observed in the maximum rostrum width (k = 0.021) followed by maximum distance between the supraorbital processes and basioccipital width (k = 0.116) (Table 3).
Differences were observed in the stabilization of asymptotic growth at 95% of the variables selected (r ≥ 0.85). In females, stabilization of asymptotic growth at 95% of basioccipital width and maximum width of nasal orifice was at 3 years of age. However, the maximum width of the palate stabilized at 4 years of age. In three characters, i.e. post-canine series length, maximum distance between the condyles, and maximum width of rostrum, stabilization began at 5 years of age. Stabilization of the maximum width of orbit, rostrum length and maximum distances between the supraorbital processes was at 6 years of age. The distance between the optical foramen and the foramen magnum stabilized at 8 years of age. The palate length stabilized at 9 years of age. Two characters, the distance between the tympanic bulla and sagittal crest, and the length of the jugal, stabilized at 10 years of age. Finally, the maximum width between the mastoid processes stabilized at 12 years of age, and the basilar length of Hensel stabilized at 20 years of age (Table 3). The median age of all variables selected was 6 years. Therefore, we considered that females attain physical maturity of skull at about 6 years of age.
In males, stabilization of the asymptotic growth at 95% of post-canine series length was at 5 years of age. Stabilization of the palate length was at 6 years of age; the length of the jugal stabilized at 8 years of age. The maximum width of the zygomatic arch stabilized at 10 years of age. The basilar length of Hensel and the condylobasal length stabilized at 16 and 18 years of age, respectively (Table 3). The median age of all variables selected was 9 years. Therefore, we considered that males attain physical maturity of skull at about 9 years of age.
Student's t-test indicated a significant difference (P < 0.001) between sexes (APC and LPC for physically mature skulls and DBC, DPS, LCO, LMP, LRO and LZI for physically immature skulls). The results of the Hotelling T 2 multivariate test indicated the presence of sexual dimorphism (P < 0.05) for physically immature and physically mature skulls. In physically immature skulls, three were dimorphic variables (maximum height of the foramen magnum, minimum width at the inter-orbital constriction and maximum width of the rostrum). In physically mature skulls, 24 variables were sexually dimorphic, and only the post-canine series length, maximum width of braincase, and minimum width at the inter-orbital constriction were not dimorphic.
OTARIA BYRONIA
The correlation coefficient showed that 10 characters (45.45%) in females and 11 characters (50%) in males showed a higher correlation with age (r ≥ 0.85) (Table 4). In females, the variables most highly correlated with age were the length of the jugal (r = 0.91), followed by rostrum length (r = 0.90), whereas those in males were condylobasal length (r = 0.94), and length of the jugal (r = 0.93). The lowest correlation was the maximum width of the braincase (r = 0.42) for both females and males (r = 0.63) (Table 4). In regard to the growth coefficient, females seemed more accelerated. In females, the maximum width of the braincase (k = 0.613) showed the fastest growth, followed by maximum distance between the condyles (k = 0.526). A slower growth was observed in the maximum distance between the supraorbital processes (k = 0.184), followed by maximum width of palate (k = 0.196) (Table 4).
Table 4. Parameters of the Gompertz equation for females and males of Otaria byronia.

A ¥, asymptotic length (cm); k, growth-rate constant; t 0, hypothetical age at which the species has length equal to zero; r, correlation coefficient in relation to age.
In males, the palate length showed the faster growth (k = 0.313), followed by maximum distance between the condyles (k = 0.289). A slower growth was observed in the maximum width of braincase (k = 0.173), and distance between the tympanic bulla and the sagittal crest (k = 0.183) (Table 4).
Differences were observed in the stabilization of asymptotic growth at 95% of the variables selected (r ≥ 0.85). In females, three characters (maximum height of the jugal, post-canine series length, and maximum width of the rostrum) stabilized at 6 years of age. Rostrum length stabilized at 7 years of age, whereas the distance between the optical foramen and the foramen magnum stabilized at 9 years of age. Two variables (length of the jugal, and distance between the tympanic bulla and the sagittal crest) stabilized at 10 years of age (Figure 4). The maximum width between the mastoid processes stabilized at 12 years of age. Finally, palate length stabilized at 14 years of age, and condylobasal length at 24 years of age (Table 4). The median age of all variables selected was 9 years. Therefore, we considered that females attain physical maturity of the skull at about 9 years of age.

Fig. 4. Growth curve (Gompertz model) of the linear measure length of jugal (CJU) in males of Otaria byronia.
In males, stabilization of asymptotic growth at 95% of the maximum width of nasal orifice was at 5 years of age. However, the maximum height of the jugal stabilized at 6 years of age. Two characters (maximum width of palate and rostrum length) stabilized at 9 years of age. The maximum width of the rostrum stabilized at 10 years of age. Two variables (maximum distance between the supraorbital processes and distance between the optical foramen and foramen magnum) stabilized at 12 years of age, whereas the condylobasal length and the length of the jugal stabilized at 13 years of age. Stabilization of the distance between the tympanic bulla and the sagittal crest was at 16 years of age. The maximum width of the zygomatic arch stabilized at 21 years of age. Finally, the basilar length of Hensel and condylobasal length stabilized at 30 and 32 years of age, respectively (Table 4). The median age of all variables selected was 12 years. Therefore, we considered that males attain physical maturity of the skull at about 12 years of age.
Student's t-test showed a significant difference (P < 0.001) between the sexes. In physically immature skulls, 21 variables were dimorphic (only the palate length was not significantly dimorphic). In physically mature skulls, 19 variables were sexually dimorphic. The distance between the palate and the foramen magnum, the palate length, and the basioccipital width were the exceptions. The results of the Hotelling T 2 multivariate test indicated the presence of sexual dimorphism (P < 0.05) for physically immature and physically mature skulls.
The results of the Student t-test of physically immature and physically mature skulls separately, showed the presence of sexual dimorphism (P < 0.05) for both age classes. In physically immature skulls, 21 variables were dimorphic. Only palate length was non-dimorphic (P > 0.05). In physically mature skulls, all measurements were dimorphic (P < 0.05).
Rates and timing of development and growth using geometric morphometric techniques
Some models were excluded because they did not met the assumption that residuals are normally distributed and independent (they showed auto-correlations among residuals in one or more of the analyses; P < 0.05) (Table 5).
Table 5. Relative fit of the eight models fitted to the measure of developmental maturity and logarithm centroid Size.

NS, not significant; S, significant.
The AIC weight evaluates relative goodness-of-fit by balancing the distance between model and data by degrees of freedom. AC refers to serial autocorrelations among residuals of the model. The model in bold is the one judged best.
Of the remaining models, several fitted equally well. We chose the linear model as the basis for comparing rates and timing of growth and development, because it is simple and fits both the developmental and growth data well in all species and sex groups. Furthermore, the Akaike information criterion (AIC) weight was higher in this model than in all the others, in all cases.
Only O. byronia differed between sexes in both developmental model parameters (constant and slope) (Table 6). Females of this species showed a striking degree of linearity, which can be perceived in the difference between the percentages of variation explained by the linear model between the sexes. In contrast, A. australis and C. ursinus showed no differences between sexes in the relationship between changes in shape and absolute age (Table 6).
Table 6. Developmental rate and growth rate for each species and sex examined using the linear model.

CI, Confidence intervals (95%).
The rate of growth in A. australis did not differ between the sexes (nor for the constant), but was higher than the rates of the other species, especially compared to C. ursinus. The other two species showed significantly different rates between sexes for growth (and in the constant as well) (Table 6).
Using geometric morphometric data sets, the comparisons between the growth and developmental models in different species always gave significantly different results in both parameters (slope and constant). The differences between species were more remarkable between males than between females, for both developmental and growth trajectories.
The range of ages sampled did not permit us to determine the time of development and growth in each species and sex group (at which age ontogeny stabilized) using the geometric data sets (Figure 5).

Fig. 5. Rate of developmental in males of Otaria byronia using geometric morphometrics (linear model).
This limitation could not be resolved by the employment of sutural ages, because any model has a good fit to this kind of data (which means that the percentile of explained variation is very small or not greater than could be found by chance). This was especially true for the females of the fur seals, in which ontogenetic changes were less apparent.
DISCUSSION
Besides the fact that the GLG determination method used is not the most precise (Molina-Schiller & Pinedo, 2004b) it does not affect estimates of maturity based on younger age groups. The study of somatic growth is of great value for understanding the biology of a species, because the phenomenon of growth is the end product of biochemical, physiological and organic processes (Rosas & Barreto, Reference Rosas and Barreto2003). In addition, most of the morphological changes during an organism's ontogeny occur during the juvenile phase of growth, particularly during early juvenile development.
A relevant characteristic of the sigmoidal models is that growth rates decay over time (which indicates that the ratios of specific growth rates vary throughout ontogeny). Tarnawski et al. (Reference Tarnawski, Cassini and Flores2013, in Otaria byronia) and Tarnawski et al. (Reference Tarnawski, Cassini and Flores2014, in Mirounga leonina) also demonstrated changes in the growth rate during ontogeny, considering linear models. All measurements follow the same growth curve, and their differing values of k tell us how they are displaced relative to each other in time; i.e. different parts of the skull reach the same point on their growth curves at different times. Furthermore, considering that growth rates decay over time, a more negatively allometric part (e.g. sensorial capsules) has decayed over a longer time probably because it began growing earlier. Orbit, bullae and braincase experienced high rates of growth prenatally, this being the opposite to postnatal conditions, where the growth of trophic apparatus is more important. The choice of the linear model for the geometric data sets could be explained if we consider that perhaps the sample did not include sufficiently young animals to represent the sigmoid part of the growth curves, or even because of the sample size. However, the differences between the two approaches (traditional morphometric and geometric morphometric) might also be due to the mixing of size (and/or scale) and shape information in the traditional data, whereas the geometric approach separates scale and shape more explicitly (Parsons et al., Reference Parsons, Robinson and Hrbek2003).
In the South American fur seal, A. australis, the females attain sexual maturity at ~3 years, and the males at ~7 years (Vaz-Ferreira & Ponce De Léon, Reference Vaz-Ferreira, Ponce De Léon, Croxall and Gentry1987; Lima & Páez, Reference Lima and Páez1995). However, Corcuera (Reference Corcuera1989) demonstrated that females of this species mature at about 2 or 3 years of age (about 130 cm total body length, Molina-Schiller, unpublished data), and males attain sexual maturity when around 150–160 cm of total length (between 9 and 13 years old, Molina-Schiller, unpublished data). In the northern fur seal Callorhinus ursinus, females attain sexual maturity between 3 and 7 years (140 cm total length), and males at about 5 years (210 cm total length) (Lander, Reference Lander1981). Finally, in the southern sea lion Otaria byronia, females mature at about 5 years of age (about 140 cm total length), and males at about 7 years (about 200 cm total length) (Dans, Reference Dans1993). The age of cranial maturity observed for the specimens of A. australis is congruent with the results of Molina-Schiller & Pinedo (Reference Molina-Schiller and Pinedo2004b). Interestingly, in the present study we observed that fur seals of both species (A. australis and C. ursinus) mature at similar ages (females and males), whereas O. byronia requires a longer time to mature, which is congruent with a longer ontogenetic trajectory (where the males have a slower rate of development in relation to that of the females of O. byronia). Tarnawski et al. (Reference Tarnawski, Cassini and Flores2013) also showed the decreasing of some longitudinal variables of the male skull of O. byronia, and the increasing of the growth rate. The same variation of the rate of the skull growth was also observed on the ontogeny of the male skull of Mirounga leonina (Tarnawski et al., Reference Tarnawski, Cassini and Flores2014).
The growth curves parameters and the age of maturity are similar to the results for all three species by Brunner (Reference Brunner2000, Reference Brunner2004), who employed sutural ages as a measurement of age, and the von Bertalanffy growth model.
In general, the correlations of the characters with absolute ages obtained with the Gompertz equation were congruent. The measurements with a very low correlation coefficient (e.g. maximum width of braincase, maximum height of the foramen magnum, and minimum width at the inter-orbital constriction) are related to precocious characters such as the nervous system, which obviously develops in the early ontogeny (Brunner, Reference Brunner2004). Other measurements with a low percentile of explained variance and/or correlation to age were the post-canine length measurements, probably because the adult teeth erupt in the first year of life in otariids (Berta & Sumich, Reference Berta and Sumich1999) and there is no growth on the inter-dental space.
The dimorphic variables for immature individuals were similar for fur seals, and the majority were related to the braincase and its vicinity. In contrast, sexual dimorphism was more apparent in immature individuals of O. byronia, which perhaps is linked with body size at birth (Cappozzo et al., Reference Cappozzo, Campagna and Monserrat1991). In the adults of O. byronia, all linear measurements were dimorphic.
Males showed significantly steeper slopes than females in all analysed species in the geometric morphometric results, indicating a dissociation of size and shape. In contrast, departures from ontogenetic scaling, where size and shape are dissociated, with adult males being disproportionately larger than adult females, are found in cranial regions associated with secondary sexual character development (Leutenegger & Masterson, Reference Leutenegger and Masterson1989; Tarnawski et al., Reference Tarnawski, Cassini and Flores2013, Reference Tarnawski, Cassini and Flores2014).
It is important to place the differences described here in context, in that most pinniped males do not become ‘socially mature’ until several years, usually at least 3–4 years, after reaching sexual maturity. Although a young male may be capable of breeding at a certain age, he is rarely able to copulate successfully with a female or to compete effectively with the dominant or territorial bull until he is older (Riedman, Reference Riedman1990). In this context, it is expected that the level of sexual dimorphism will increase during ontogeny and that it will be more conspicuous and generalized in the adults, where secondary dimorphism also develops (structures related to muscles such as the temporal or the masseter muscles; size of canines and others related to robustness). In most pinnipeds, females attain reproductive age much earlier than males, expending large amounts of energy on their offspring, and thus their ability for further somatic growth is limited. In contrast, males do not provide parental care, and in most cases reach maturity later in life. They can allocate more energy to growth, and hence male pinnipeds often show a dramatic secondary growth spurt during their adolescent years. Lindenfors et al. (Reference Lindenfors, Tulberg and Biuw2002) found no significant relationship between body size and sexual size dimorphism in pinnipeds, and noted that sexual size dimorphism in pinnipeds is a result of selection acting only on males.
Whereas the evolution of genetically based sexual size dimorphism in adults is extremely slow, there is a rapid evolution of differences between males and females in growth patterns, and these differences evolve not just among related species (Leigh, Reference Leigh1995). This is perfectly illustrated by slow-growing species in which selection in males and females during growth, and not during the adult stage, is the most important determinant of adult sexual size dimorphism (Leigh, Reference Leigh1995; Sanfelice & de Freitas, Reference Sanfelice and de Freitas2008). Moreover, the need for within-organism integration during prolonged and complex development might determine the aspects of variation available to selection (Arthur, Reference Arthur2002); thus, the internal dynamics of the developmental programme that is shared between the sexes might have a profound influence on the evolution of sexual size dimorphism.
According to recently developed sex-ratio theories, a parent should vary the amount of maternal investment in relation to its offspring's sex by investing more in the sex with the highest variance in reproductive success (in our case, the males), because parental investment influences the offspring's body size, health and breeding success later in life (Maynard Smith, Reference Maynard Smith1980). In fact, male otariid pups frequently weigh more at birth, grow faster, or ingest more milk than do female pups during the lactation period (Mattlin, Reference Mattlin1981; Doidge et al., Reference Doidge, Croxall and Ricketts1984; Boness et al., Reference Boness, Bowen and Iverson1985; Costa & Gentry, Reference Costa, Gentry, Gentry and Kooyman1986; Kovacs & Lavigne, Reference Kovacs and Lavigne1986; Higgins et al., Reference Higgins, Costa, Huntley and Le Boeuf1988; Trillmich, Reference Trillmich, Rosenblatt and Snowdon1996).
Rensch's Rule and/or ontogenetic scaling is often invoked to explain sexual dimorphism (e.g. Leutenegger & Larson, Reference Leutenegger and Larson1985). Following these approaches, shape differences between adult males and females result from the extension of relative growth (shape change) in the smaller females to larger overall size in the males (Shea, Reference Shea1986). Equally common are examples where females reach their adolescent growth spurt, attain sexual maturity, and cease growth before males do (Tanner, Reference Tanner1963). Thus, from a perspective of heterochrony, the null hypothesis predicts that adult sexual dimorphism in size and shape is primarily the result of time hypermorphosis, i.e. an extension of the growth period in males (Shea, Reference Shea1986). But that is surely a scenario related to dimensional bias. Skull males are not a scaled version of female skull since several variables grow allometrically. In this context, concerning the geometric analysis of the fur seals, it seems that rates or timing of growth and development evolve below a conserved spatiotemporal organization of morphogenesis. However, channelling can occur when growth and development are associated (ontogenetic scaling) or decoupled (exclusively changes in rate that are consistent with the hypothesis that morphogenesis is conserved are verified, where we expect the ‘descendant’ ontogeny to be more nearly isometric that the ‘ancestor’), which could be the case for the evolution of sexual dimorphism in A. australis and C. ursinus, respectively.
It has been suggested (e.g. Leutenegger & Masterson, Reference Leutenegger and Masterson1989; McKinney & Mcnamara, Reference McKinney and McNamara1991) that the combination of data on cranial growth allometries and sex differences in developmental timing offers insights as to the kind of heterochronic processes that may lead to specific patterns of adult cranial sexual dimorphism, such as in peramorphic males which grow for a longer period of time than females (‘time hypermorphosis’). In future studies, it will be interesting to ask whether skull shape at maturity predicts the timing of life-history.
ACKNOWLEDGEMENTS
Previous versions of this manuscript were read by L. R. Monteiro, who also revised the English. We thank E.A. Crespo, A. Lebas, J. Patton, D. Long, L.H. Cappozzo, P.C. Simões-Lopes and the GEMARS for access to scientific collections, L.R. de Oliveira for the access to the age of some Arctocephalus australis specimens, S. Brunner for the pictures of Callorhinus ursinus specimens and Eduardo Quadros and Luciano Amaro Valério for the help with the figures. We also thank two anonymous reviewers for their constructive comments, which helped us to improve the manuscript.
FINANCIAL SUPPORT
Work by DS was partially supported by fellowships from the Coordenadoria de Aperfeiçoamento Pessoal (CAPES), Conselho Nacional de Desenvolvimento Científico e Tecnológico (CNPq), and Fundação de Amparo à Pesquisa do Rio Grande do Sul (FAPERGS), and by the Society of Marine Mammalogy.
Appendix 1
Institution acronyms: AMNH = American Museum of Natural History (New York, USA)* CAS = California Academy of Science (San Francisco, USA); CNP = Centro Nacional Patagónico (Puerto Madryn, Argentina); GEMARS = Grupo de Estudos de Mamíferos Marinhos (Porto Alegre, Brazil); LAMAMA = Laboratorio de Mamíferos Marinos (Puerto Madryn, Argentina); MACN = Museu Argentino de Ciencias Naturales Bernardino Rivadavia (Buenos Aires, Argentina); MCN-M = Museu de Ciências Naturais da Fundação Zoobotânica do Rio Grande do Sul (Porto Alegre, Brazil); ZVC = Museu de Zoologia de Vertebrados (Montevideo, Uruguay); MVZ = Museum of Vertebrate Zoology (Berkeley, USA); NMNH = National Museum of Natural History (Washington DC)*; UAM = University of Alaska Museum*; UFSC = Universidade Federal de Santa Catarina (Florianópolis, Brazil); UMICH = University of Michigan (Ann Arbor, USA). *Pictures by Dr Sylvia Brunner (Alaska University Museum).
Arctocephalus australis: CNP 036, CNP A?1, CNP AA12, CNP AA16, CNP AA17, CNP AA3, CNP AA5, CNP AA7, CNP AT2, LAMAMA 28, MACN 08/09/2024 (1929?), MACN 20460, MACN 20562, MACN 20563, MACN 20568, MACN 20569, MACN 20570, MACN 25192, MACN 28261, MACN jul/87, MCN-D 254, MCN-M `2636, MCN-M 2457, MCN-M 2461, MCN-M 247, MCN-M 2495, MCN-M 2497, MCN-M 2498, MCN-M 2500, MCN-M 2509, MCN-M 2522, MCN-M 2523, MCN-M 2529, MCN-M 2533, MCN-M 2537, MCN-M 2606, MCN-M 2614, MCN-M 2625, MCN-M 2627, MCN-M 2628, MCN-M 2630, MCN-M 2634, MCN-M 2638, MCN-M 2639, MCN-M 2644, MCN-M 2647, MCN-M 2649, MCN-M 2650, MCN-M 2682, MCN-M 2683, MCN-M 2684, MCN-M 2685, MCN-M 2688, MCN-M 2689, MCN-M 2690, MCN-M 2692, MCN-M 2694, MCN-M 2699, MCN-M 2702, MCN-M 2706, MCN-M 2833, MCN-M 2834, MCN-M 2839, MCN-M 2875, MCN-M 533, UFSC 1015, UFSC 1040, UFSC 1063, UFSC 1096, UFSC 1111, UFSC 1131, UFSC 1133, UFSC 1135, UFSC 1137, UFSC 1139, UFSC 1141, UFSC 1142, UFSC 1143, UFSC 1147, UFSC 1148, UFSC 1153, UFSC 1154, UFSC 1156, UFSC 1157, UFSC 1158, UFSC 1159, UFSC 1160, UFSC 1169, UFSC 1170, UFSC 1228, UFSC 1263, UFSC 1272, UFSC 1276, UFSC 1282, UFSC 1283, UFSC1163, ZVC -M1584, ZVC-M (FA 2562), ZVC-M 1188, ZVC-M 1365, ZVC-M 1517, ZVC-M 1523, ZVC-M 1530, ZVC-M 1531, ZVC-M 1532, ZVC-M 1534, ZVC-M 1538, ZVC-M 1539, ZVC-M 1539, ZVC-M 1540, ZVC-M 1542 al 960, ZVC-M 1545, ZVC-M 1550, ZVC-M 1552, ZVC-M 1556, ZVC-M 1558, ZVC-M 1563a13, ZVC-M 1566a11, ZVC-M 1567, ZVC-M 1568, ZVC-M 1569, ZVC-M 1571, ZVC-M 1573, ZVC-M 1580, ZVC-M 1582, ZVC-M 1591, ZVC-M 433, ZVC-M 434, ZVC-M 435, ZVC-M a 1375 1549, VC-M AL 840, ZVC-M AL 873, ZVC-M DS 18, ZVC-M DS 21, ZVC-M DS 22, ZVC-M DS 23, ZVC-M DS 23, ZVC-M DS10 (A21), ZVC-M DS11 (A21), ZVC-M DS13 (A21), ZVC-M DS14 (A21), ZVC-M DS15(A21), ZVC-M DS17 (A21), ZVC-M DS19, ZVC-M DS2 (A21), ZVC-M DS20, ZVC-M DS3 (A21), ZVC-M DS4 (A21), ZVC-M DS6 (A21), ZVC-M DS7 (A21), ZVC-M DS8 (A21), ZVC-M DS9 (A21). Callorhinus ursinus: AMNH 3800, CAS 21243, CAS 21497, CAS 21783, CAS 22829, CAS 23101, CAS 23145, CAS 23153, CAS 2321, CAS 2322, CAS 2323, CAS 2329, CAS 23829, CAS 23831, CAS 23832, CAS 23835, CAS 24350, CAS 26753, CAS 26760, CAS 3070, CAS 3151, CAS 3696, CAS 4330, CAS 4468, CAS 4564, CAS 4655, CAS 4656, CAS 4682, CAS 4702, MVZ 114107, MVZ 115217, MVZ 115218, MVZ 115219, MVZ 115220, MVZ 115221, MVZ 115222, MVZ 115223, MVZ 115224, MVZ 115225, MVZ 115227, MVZ 115228, MVZ 1894, MVZ 2402, MVZ 3081, MVZ 35085, MVZ 35086, MVZ 35090, MVZ 35091, MVZ 3845, MVZ 545, MVZ RC 4160, NMNH 285726, NMNH 285653, NMNH 285665, NMNH 47080, NMNH 285684, NMNH 285694, NMNH 285697, UAM 11492, UAM 11497, NMNH 286143, ZVC-M 43. Otaria byronia: CENPAT 102, CENPAT 111, CENPAT 70, GEMARS 171, GEMARS 184, GEMARS 193, GEMARS 284, GEMARS 353, GEMARS 428, GEMARS 516, GEMARS 523, GEMARS 658, GEMARS 667, LAMAMA 101, LAMAMA 103, LAMAMA 104, LAMAMA 105, LAMAMA 106, LAMAMA 107, LAMAMA 108, LAMAMA 109, LAMAMA 110, LAMAMA 115, LAMAMA 116, LAMAMA 117, LAMAMA 120, LAMAMA 121, LAMAMA 123, LAMAMA 124, LAMAMA 127, LAMAMA 128, LAMAMA 129, LAMAMA 130, LAMAMA 131, LAMAMA 132, LAMAMA 133, LAMAMA 133, LAMAMA 134, LAMAMA 135, LAMAMA 135, LAMAMA 140 (CNP82), LAMAMA 141 (CNP83), LAMAMA 142 (CNP84), LAMAMA 143 (CNP085), LAMAMA 144 (CNP61), LAMAMA 145 (CNP86), LAMAMA 170 (CNP89), LAMAMA 175 (CNP94), LAMAMA 179 (CNP98), LAMAMA 199, LAMAMA 210, LAMAMA 213, LAMAMA 214, LAMAMA 215, LAMAMA 216, LAMAMA 217, LAMAMA 218, LAMAMA 218, LAMAMA 224, LAMAMA 225, LAMAMA 228, LAMAMA 229, LAMAMA 233, LAMAMA 234, LAMAMA 235, LAMAMA 236, LAMAMA 237, LAMAMA 237, LAMAMA 238, LAMAMA 238, LAMAMA 24 (CNP11), LAMAMA 24 (CNP8), LAMAMA 240, LAMAMA 241, LAMAMA 242, LAMAMA 243, LAMAMA 244, LAMAMA 245, LAMAMA 246, LAMAMA 247, LAMAMA 249, LAMAMA 250, LAMAMA 252, LAMAMA 253, LAMAMA 254, LAMAMA 255, LAMAMA 256, LAMAMA 261, LAMAMA 262, LAMAMA 263, LAMAMA 264, LAMAMA 269, LAMAMA 270, LAMAMA 271, LAMAMA 272, LAMAMA 273, LAMAMA 275, LAMAMA 276, LAMAMA 277, LAMAMA 280, LAMAMA 281, LAMAMA 282, LAMAMA 284, LAMAMA 285, LAMAMA 287, LAMAMA 290, LAMAMA 293, LAMAMA 294, LAMAMA 295, LAMAMA 300, LAMAMA 301, LAMAMA 302, LAMAMA 303, LAMAMA 304, LAMAMA 305, LAMAMA 307, LAMAMA 31 (CNP24), LAMAMA 311, LAMAMA 312, LAMAMA 313, LAMAMA 314, LAMAMA 315, LAMAMA 316, LAMAMA 320, LAMAMA 322, LAMAMA 323, LAMAMA 325, LAMAMA 327, LAMAMA 328, LAMAMA 329, LAMAMA 33 (CNP26), LAMAMA 331, LAMAMA 332, LAMAMA 337, LAMAMA 341, LAMAMA 344, LAMAMA 345, LAMAMA 347, LAMAMA 348, LAMAMA 349, LAMAMA 350, LAMAMA 351, LAMAMA 352, LAMAMA 353, LAMAMA 356, LAMAMA 363, LAMAMA 364, LAMAMA 366, LAMAMA 367, LAMAMA 368, LAMAMA 368, LAMAMA 369, LAMAMA 370, LAMAMA 371, LAMAMA 372, LAMAMA 373, LAMAMA 374, LAMAMA 375, LAMAMA 376, LAMAMA 377, LAMAMA 378, LAMAMA 380, LAMAMA 381, LAMAMA 382, LAMAMA 383, LAMAMA 385, LAMAMA 394, LAMAMA 395, LAMAMA 396, LAMAMA 398, LAMAMA 399, LAMAMA 402, LAMAMA 404, LAMAMA 415, LAMAMA 416, LAMAMA 417, LAMAMA 418, LAMAMA 421, LAMAMA 426, LAMAMA 426, LAMAMA 43, LAMAMA 431, LAMAMA 434, LAMAMA 435, LAMAMA 438, LAMAMA 444, LAMAMA 448, LAMAMA 449, LAMAMA 45, LAMAMA 450, LAMAMA 451, LAMAMA 453, LAMAMA 46, LAMAMA 47, LAMAMA 48, LAMAMA 56, LAMAMA 60, LAMAMA 61, LAMAMA 63, LAMAMA 65, LAMAMA 66, LAMAMA 67, LAMAMA 68, LAMAMA 87, LAMAMA 88, LAMAMA 89, LAMAMA 90, LAMAMA (CNP81), LAMAMA 177 (CNP96), LAMAMA357, LAMAMA76, MACN 10.30, MACN 125, MACN 13.11, MACN 13.13, MACN 13.14, MACN 159, MACN 20.420, MACN 20.572, MACN 20.573, MACN 20.576, MACN 20.578, MACN 20.583, MACN 20.595, MACN 20.596, MACN 21.01, MACN 23.26, MACN 25.138, MACN 25.168, MACN 25.45, MACN 30.236, MACN 33.93, MACN 41.226, MACN 4-13-12, MACN 50.52, MACN 9/7 (260), MACN 90.03, MCN-M 2459, MCN-M 2460, MCN-M 2462, MCN-M 2505, MCN-M 2521, MCN-M 2525, MCN-M 2601, MCN-M 2602, MCN-M 2603, MCN-M 2604, MCN-M 2610, MCN-M 2612, MCN-M 2616, MCN-M 2619, MCN-M 2622, MCN-M 2629, MCN-M 2686, MCN-M 2691, MCN-M 2693, MCN-M 2696, MCN-M 2697, MCN-M 2700, MCN-M 2701, MCN-M 2704, MCN-M 2807, MCN-M 2832, MCN-M 2990, UFSC 1134, UFSC 1140, UFSC 1152, UFSC 1161, UFSC 1168, UFSC 1171, UFSC 2695, UFSC 2698, UFSC 2703, ZVC-M 1171, ZVC-M 1181, ZVC-M 1191, ZVC-M 1192, ZVC-M 1193, ZVC-M 1194, ZVC-M 1204, ZVC-M 1205, ZVC-M 1525, ZVC-M 1526, ZVC-M 1581, ZVC-M 1587, ZVC-M 2051, ZVC-M 28, ZVC-M 29, ZVC-M 360, ZVC-M 46, ZVC-M 87001, ZVC-M DS 1.


