


1 Introduction
As shown by Samuelson (Reference Samuelson1958), in a two-age groups overlapping generations model with an infinite time horizon, an exogenous production sector and a constant contribution rate, the steady-state rate of return on contributions in a pay-as-you-go (PAYG) pension system is equal to the rate of growth in the labor force and in productivity. Hence, in countries experiencing population aging, low fertility, and low productivity growth, pre-funded pension systems with privately defined contribution plans may appear a superior alternative. Indeed, the two most propagated arguments in favor of privately defined contribution plans are that such plans raise national savings and thus stimulate growth, and that returns on contributions are higher than in PAYG systems (e.g., Palacios and Whitehouse, Reference Palacios and Whitehouse1998).Footnote 1
Models that quantitatively investigate rates of return on pension contributions almost exclusively focus on the inter-generational dimension. Recent literatures include Settergren and Mikula (Reference Settergren and Mikula2005) and Knell (Reference Knell2010) . Only a few studies address the intra-cohort dimension (i.e., Auerbach and Kotlikoff, Reference Auerbach and Kotlikoff1987; Fullerton and Rogers, Reference Fullerton and Rogers1993; Imrohoroglu et al., Reference Imrohoroglu, Imrohoroglu and Joines1995; Cubeddu, Reference Cubeddu2000). This is surprising as the intra-cohort dimension is of key relevance for policymakers: PAYG pension schemes approach maturity worldwide and the intra-cohort distribution of rates of return can be seen as an indicator of life-time redistribution within the pension system. Our study, therefore, provides complementing information to studies dealing with the redistributive effects of tax-transfer systems in the course of a year. Particularly, the intra-cohort dimension reveals how well, in monetary terms, an insurant is treated relative to other insurants in her cohort, and how well-off the birth cohort as a whole is (e.g., Liebman, Reference Liebman2001, pp. 5–6).
In many countries neither experts nor the public know how intra-cohort distributions of rates of return on pension contributions look like, largely because the necessary micro data, i.e., insurances' biographies together with their pension entitlements, is not available. Instead, rates of return on pension contributions are typically computed for some types of ‘representative’ insurants with stylized biographies. Yet, such representative beneficiaries are rarely an efficient simplification, and the exception rather than the rule: Even within the same birth cohort, labor-market shocks, human capital investments, marriage and fertility decisions, and other factors cause substantial heterogeneity in individuals' employment biographies. All these factors affect individual pension contributions and entitlements, and this may map in differences in rates of return across insurants.Footnote 2 Furthermore, computations based on representative beneficiary types do not shed light on the intra-cohort redistributive channels inherent in pension systems, coming from the fact that pension entitlements depend on various factors other than earnings. For example, in the German system as in many others, pension entitlements of married insurants can be transferred to the partner after the insurant's death; insurants with children benefit from regulations that compensate for income losses during periods of child raising.
For such and other reasons, Bosworth et al. (Reference Bosworth, Burtless and Steuerle1999) argue that stylized hypothetical earnings biographies assuming steady earnings throughout earnings careers are misleading, and argue that researchers should consider real-life earnings patterns that can be seen in micro data. The present work seeks to contribute in this direction by providing the intra-cohort distribution of internal rate of return (IRR) on pension contributions in Germany's PAYG system, the blueprint of Bismarck-type pension systems worldwide.
In our analysis, we focus on old-age pensioners with West German employment biographies retiring in year 2005. These insurants realized an average expected nominal IRR of about 3.3%. At the same time, IRR substantially differs across different beneficiary groups. In particular, IRR is significantly influenced by the beneficiaries' gender: it is about one percentage point higher for female compared with male beneficiaries. A substantial part of the IRR gender divide results from the fact that the German PAYG system credits periods of child raising or care for ill/handicapped partners and that female insurants undertake these activities more often. Another important finding is that the IRR is decreasing in insurants' lifetime earnings, suggesting that the German system entails an intra-cohort lifetime progressive element: insurants with high lifetime earnings usually have long working phases and benefit less frequently from regulations intended to compensate for particular non-working periods (e.g., childcare, care for an ill partner, unemployment). Our finding of the system to be progressive is particularly interesting for researchers and policy makers who seek to design ‘fair’ or ‘equitable’ tax-transfer systems, particularly from the perspective of lifetime income redistribution.
The IRR distribution is derived from authentic representative social security records from a recently released database, the ‘Completed Insurant Lives’Footnote 3 (CIB) provided to us by the German Pension Insurance. For a representative sample of pension insurants retiring in year 2005, the CIB contains monthly level information on insurants’ employment biographies. Particularly, the database documents, for each insurant, the entire stream of pension contributions before retirement together with actual annual pension entitlements at the moment of retirement. Unfortunately, the CIB does not include insurants who did not survive until retirement. Accordingly, our IRR estimates are conditional upon survival up to the year 2005. Due to a positive risk of pre-retirement death, unconditional IRR estimates should be lower. In sum, our approach takes a forward-looking perspective on retirement and a backward-looking perspective on employment.Footnote 4
Empirical studies on the intra-cohort IRR distribution, such as ours, are scarce due to the lack of adequate data. Only a handful of studies exist, including Burkhauser and Warlick (Reference Burkhauser and Warlick1981), Hurd and Shoven (Reference Hurd, Shoven and Wise1985), Duggan et al. (Reference Duggan, Gillingham and Greenlees1993), Gustman and Steinmeier (Reference Gustman and Steinmeier2001) and Liebman (Reference Liebman2001) . To the best of our knowledge, previous studies for Germany exclusively focused on stylized biographies (e.g., Schnabel, Reference Schnabel1998; Ohsmann and Stolz, Reference Ohsmann and Stolz2004; Schnabel and Ottnad, Reference Schnabel and Ottnad2008).
The remainder of the article is organized as follows. Section 2 presents the database and its preparation. Section 3 contains the technical framework. The sample breakdown is presented in Section 4, and Section 5 provides our empirical results. Section 6 deals with the implications of our results, and Section 7 concludes.
2 Database and data preparation
2.1 Completed Insurant Lives 2005
The scientific use file CIB from year 2005 is an excerpt of all German social insurance accounts. It stores representative administrative employment biographies of 37,716 pension beneficiaries born between year 1940 and 1975 entitled to public pension benefits (old-age and reduced-earnings capacity pensions) from year 2005 onward. The database is split into two parts. The first part contains several time-invariant variables, e.g., the beneficiary's gender, nationality, date of birth, or type of pension entitlement. The second part documents the employment histories. For each beneficiary, it reports monthly data on pension contributions, employment status, child raising activity, etc. Up to 624 elements of monthly information (equivalent to 52 insurance years) are stored in a 37,716×624 matrix for every reported variable. No other German database provides longitudinal biographical information for a longer time horizon.
We have discarded several biographies from the database for reasons listed below:
(1) Sometimes biographical information is fragmented and incomplete. This can happen if the pension entitlement of a beneficiary has been computed manually by an employee of the German pension insurance (see German Pension Insurance, 2007, p. 15, for details). This affects 2,222 cases which have been discarded from the database.
(2) As our focus is on old-age pensioners (according to Social Security Code (SSC), Book VI, sections 35, 36, 37, 237, 237a), we have excluded all beneficiaries receiving a pension for a limited duration only, e.g., due to a serious illness.Footnote 5 Including such cases would have urged us to make (arbitrary) assumptions about the duration of illness and the future ability/capacity to work. For this reason, 7,133 cases have been discarded.
(3) Altogether, 5,991 beneficiaries have made contributions to the pension system of the Former German Democratic Republic.Footnote 6 These are discarded as a meaningful conversion of contributions made in Marks to pension entitlements in Euro seems impossible to us.
(4) Some beneficiaries are entitled to an old-age pension without ever having made sizable own contributions from earned income subject to mandatory insurance. Such a beneficiary's IRR can be quite high. To avoid outlier-driven bias, we have excluded the 1% of beneficiaries with the highest IRR. For symmetry reasons, we have also excluded the 1% with the lowest IRR. Altogether, this results in dropping 562 (=2⋅281) cases.
By construction, the resulting working sample underlying all further calculations is not ‘representative’ in the sense of the original CIB database. The CIB represents all the insurants born between 1940 and 1975 entitled to an old-age or a reduced-earnings capacity pension from year 2005 onward. Instead, our working sample of 21,509 insurants contains West German old-age pensioners born between 1940 and 1945. Accordingly, our analysis sheds light on a specific, yet prominent sub-population of the original CIB database: old-age pensioners with West German employment biographies.
2.2 Survival probabilities
To assess the expected value of pension entitlements, insurants' survival probabilities are required. Survival probabilities are derived from official gender- and age-specific mortality statistics for West Germany (see German Federal Statistical Office, 2007, for details). For persons of age 60–65 in year 2005, Figure 1 depicts survival probabilities up to an age of 100 years. Altogether, six graphs are provided, one for each age in year 2005 (60–65 years). Within each graph, survival probabilities are further distinguished by gender. For example, the graph in the bottom left corner of Figure 1 indicates that in year 2005 a 64-year-old woman's (man's) probability to survive another 20 years is about 60 (40)%.

Figure 1. Survival probabilities by age cohort
In case of an insurant's death, the surviving partner receives a survivor pension that constitutes a further return component on the insurant's contributions. To derive the expected value of survivor pensions, we have also computed the probability that an insurant deceases in a specific year after retirement while the partner is still alive (and hence is credited a survivor pension). Resulting joint probabilities are summarized in Figure 2. Again, graphs are decomposed by retirement age and gender. The joint probabilities rely on the assumption that the partner of a male (female) insurant is 3 years younger (older).Footnote 7 Higher survival probabilities of females together with the age difference between the partners lead to a substantial gap in the joint probabilities for female and male insurants.
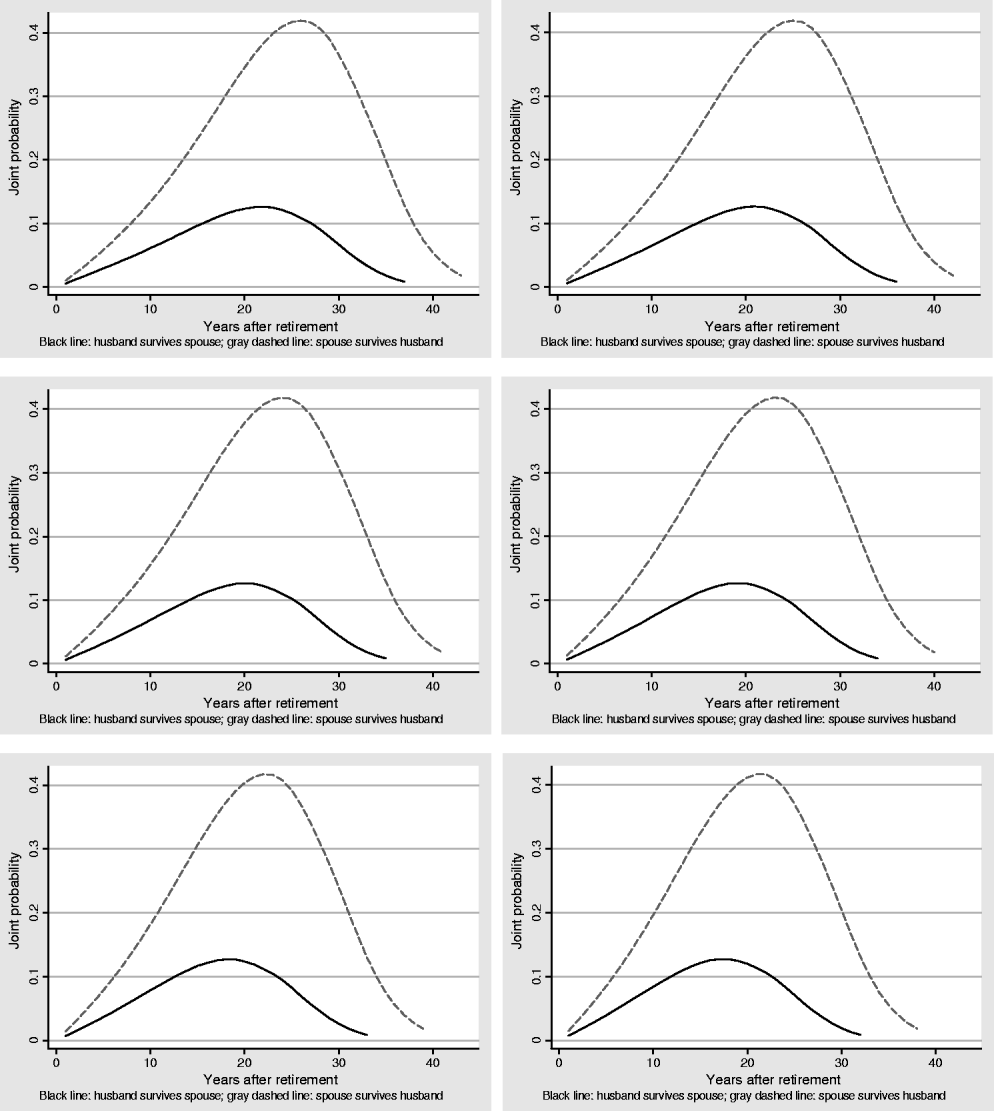
Figure 2. Joint survival probabilities by age cohort
Mortality tables provided by the German Federal Statistical Office do not differentiate with respect to income. However, several studies suggest that people with higher incomes tend to live longer (e.g., Rogot et al. Reference Rogot, Sorlie, Johnson and Schmitt1992; Pappas et al., Reference Pappas, Queen, Hadden and Fisher1993). This affects the IRR distribution: our approach tends to underestimate IRR of insurants with high income. We will come back to this issue in Section 5.2. Official mortality statistics also do not reveal the inter-dependencies in the remaining lifetimes of spouses. According to Luciano et al. (Reference Luciano, Spreeuw and Vigna2008), when one of the spouses dies, the partner's probability of dying rises. Then our IRR estimates for married insurants are too high as expected returns from widow(er) pensions are overvalued. Finally, the possibility of future improvements in life expectancy is not taken into account, potentially leading to downward-biased IRR estimates.
3 Definitions, legal and technical framework
3.1 IRR – unique, nominal, and gross
IRR measures the profitability of an investment. It is the interest rate, i, for which the net present value of an investment is zero. As our perspective is forward-looking on retirement, returns are weighted by survival probabilities.Footnote 8 As we take a backward-looking perspective on employment, the flow of investment, i.e., the pension contributions, enter the computations in non-weighted form. Let t denote a period, Bt⩾0 the pension contribution in t, and E[Rt] the current (year 2005) expected value of the pension benefit level in period t, with Rt⩾0. Then the expected IRR at the moment of retirement (year 2005) ensures that
Generally, if the sign of cash flows repeatedly changes over time, multiple IRR can be obtained, making it difficult to decide which IRR to use. This complication does not apply in our case as the sign changes only once, namely from exclusively negative during the contribution phase to positive in the retirement phase. Hence, individual IRR functions are continuous and unique, potentially ranging from minus to plus infinity.
In principle, IRR can be obtained from cash flows denominated in real or nominal terms. In the first case, contributions and pension entitlements are expressed in prices as of the time of occurrence of the flow. In the second case, they are expressed in prices as of the day of the evaluation. Using data on past consumer prices, it is possible to convert previous contributions in real terms. Expressing future returns in real terms, however, would require price forecasts for the next few decades. As forecast errors can be huge, we have expressed all flows in nominal terms. Measuring IRR in nominal terms has a second merit as it allows comparisons with nominal capital market interest rates.
The German pension system is stabilized via substantial tax-financed state subsidies. Non-insurance-related benefits such as transfers to the new federal states, to families, immigrants and minimum pensions, which are not entirely covered by own contributions, are the rationale for these subsidies. The rise in VAT rates in April 1998 was justified by a rising deficit in the public pension system and the political will not to further increase contribution rates. Since year 1990, the share of total PAYG expenses that was covered by state subsidies rose from 18.7% to 27.8% (see Figure 3 for details). Our IRR estimates do not reflect that such subsidies are financed by taxes, also imposed on the beneficiaries. Moreover, tax-subsidization may have additional distributional effects. Germany's income-tax tariff, for example, is progressive. Taking such an effect into account would reduce the IRR of the ‘rich’ relative to the ‘poor.’

Figure 3. Share of tax financed expenditures of the German PAYG system
Finally, our IRR estimates are gross. In the German PAYG system, pension contributions are equally financed by the beneficiary and her employer. Eventually, both reduce the beneficiary's net earnings so that we interpret the sum of both as the beneficiary's investment.Footnote 9 To be consistent, we consider gross pension entitlements before tax deductions, health care or care insurance contributions when calculating the IRR.
3.2 Deriving IRR from the database
This subsection first sketches the legal framework determining pension contributions and entitlements. Then we show how the necessary information can be derived from CIB and complementary external databases, and we summarize our working assumptions.
Book six of the SSC contains the legal framework of Germany's statutory PAYG pension system. A central characteristic of the system is a close relation between the sum of earnings liable to compulsory insurance from so-called ‘contribution periods’ and monthly pension entitlement after retirement. However, pension entitlements can also be gained during so-called ‘non-contribution periods’. For example, when a mother withdraws from the labor market after the birth of a child, pension contributions (and corresponding entitlements) are credited for a limited period although she did not make pension contributions from own earnings in the same period. Non-contribution periods can be credited for the following reasons: (i) sickness, rehabilitation, studies or higher education, and others (so-called ‘Anrechnungszeiten’); (ii) military service or detention due to political reasons (so-called ‘Ersatzzeiten’); (iii) child-raising or care of dependants (‘Berücksichtigungszeiten’).
The sum of all the credited pension contributions of a beneficiary j in period t, bj,t, (in Euro) equals
In equation (2), Ē t is the national average of earnings in t (expressed in Euro), CRt the contribution rate in t, and RPj,t denotes the remuneration points accumulated by j in t. Ēt and CRt are identical for all beneficiaries and can be taken from official statistics. RPj,t is beneficiary specific and is stored in CIB's variable part. Remuneration points from own employment are directly linked with annual earnings subject to compulsory insurance. If j's earnings in period t coincide with average earnings of all employed workers in the same year (50% of the national average), RPj,t=1.0 (RPj,t=0.5). Accumulated remuneration points during aforementioned non-contribution period do not reflect an investment. For this reason, they are not included when a beneficiary's investment is computed. However, they are considered when the pension entitlement is defined.
It is possible to distinguish remuneration points from own contributions and from non-contribution periods through combining, monthly, the information contained in the variables mEGPT 1, …, mEGPT 624, gmEGPT 1, …, gmEGPT 624, SES 1, …, SES 624 and JKUM 1, …, JKUM 624. The variable mEGPTm provides the remuneration points from principal employment in month m. The variable gmEGPTm is an aggregate including remuneration points from principal and non-principal employment as well as from non-contribution periods. The variable SESm describes the insurant's social status, e.g., whether the insurant is employed, unemployed, is raising a child or caring for an ill partner. The dummy variable JKUMm indicates whether the insurant has more than one employment contract subject to mandatory insurance.
In our calculations, monthly pension contributions are defined by mEGPTm whenever JKUMm does not indicate more than one employment contract subject to mandatory insurance. Otherwise, we use gmEGPTm. Our approach may lead to some error in the value of the derived investment if beneficiaries have two or more employment contracts and, in the same month, are credited remuneration points for a non-contribution period. Such cases, however, should be a rare exception.
When computing actual insurants' investments, only contributions from own earnings should matter. Accordingly, remuneration points from own contributions are determined via
where m=a denotes the first and m=a+11 denotes the last month of a year t. E1j,m and E2j,m denote dummy variables: E1j,m (E2j,m) equals one if beneficiary j earns exactly one income (more than one income) subject to compulsory insurance in month m. Otherwise, the dummy is zero.Footnote 10 Then, j's annual contributions from own earnings in t equal b j,town=Ē t⋅CRt⋅RPj,town. The sum of contributions made by the beneficiary and her employer is B j,t=2⋅b j,town.
Pension entitlements are defined by the so-called ‘pension formula’. According to SSC VI, section 64, the annual pension entitlement of an insurant j in year t is
The variable At denotes the aggregate level of current pensions (‘Aktueller Rentenwert’), a monetary amount that links up the pension entitlement with several macro variables including the wage sum, the nation-wide sum of pension contributions, the demographic structure of the population, etc. (see SSC VI, section 68 for details). In year 2005, for example, the current pension level in Germany's Old Federal States was €26.13. The variable Ej is the number of personal remuneration points a beneficiary has accrued over the lifetime (stored in the variable psegpt90 in the fix part of the CIB database), i.e., the sum of all remuneration points (from own contributions and also from non-contribution periods) corrected for the so-called ‘Zugangsfaktor’. The latter reduces annual pension entitlements in case of early retirement (see SSC VI, section 77 for details).Footnote 11 Finally, the ‘Rentenartfaktor’, RAj, differs by the type of pension that is defined in the variable LEAT in CIB's fix part. For example, the Rentenartfaktor equals 1.0 when an old-age pension according to SSC Book VI, sections 35, 36, 37, 237, 237a is granted. It is 0.55 when a ‘large’ widow(er) pension is granted (see SSC VI, section 77 for details). While this set of information in combination with equation (4) defines the pension entitlement in the present year (in 2008), an assumption is necessary to define the stream of future pension entitlements. We assume a rather conservative scenario where all future pension entitlements (from year 2009 and on) are frozen at the nominal level of year 2008.Footnote 12
With the streams of contributions, pension entitlements and survival probabilities, the expected nominal IRR for every beneficiary can be computed. When no survivor pension must be taken into account, IRR equalizes the value of annual contributions (from own earnings) during the active phase and the expected annual pension entitlements in the passive phase
In equation (5), B j,t, for example, denotes the annual amount of pension contributions from own employment of beneficiary j (and her employer) in year t, and R j,t is the pension entitlement in year t. The term P j,t(aj,gj) denotes the probability that a person j of gender gj retiring at age aj is alive in period t.
The returns from an insurant's contributions do not necessarily end after death, i.e., if a surviving partner exists who is credited a widow(er) pension.Footnote 13 We interpret survivor pensions as a further but risky return component on beneficiaries’ pension contributions.Footnote 14 The expected value of the survivor pension is derived using the joint probabilities from Section 2.2. Conditional upon having a partner, let W k,t be the survivor pension being paid to j's partner k, then equation (5) becomes
![\eqalign{\tab\mathop{\sum}\limits_{t \equals \setnum{1954}}^{\setnum{2005}} {B_{j\comma\hskip-1pt t} \cdot \lpar 1 \plus i_{j} \rpar ^{\setnum{2005} \minus t} }\cr \tab \equals \mathop{\sum}\limits_{t \equals \setnum{2005}}^{\setnum{2046}} {\left[ {{{\left[ {R_{j\comma\hskip-1pt t} \cdot P_{j\comma\hskip-1pt t} \left( {a_{j} \comma g_{j} } \right) \plus W_{k\comma t} \left( {R_{j\comma t} \comma Y_{k} } \right) \cdot Q_{j\comma\hskip-1pt t} \left( {a_{j} \comma g_{j} } \right)} \right]} \mathord{\left/ {\vphantom {{\left[ {R_{j\comma t} \cdot P_{j\comma t} \left( {a_{j} \comma g_{j} } \right) \plus W_{k\comma t} \left( {R_{j\comma t} \comma Y_{k} } \right) \cdot Q_{j\comma t} \left( {a_{j} \comma g_{j} } \right)} \right]} {\left( {1 \plus i_{j} } \right)^{t \minus \setnum{2005}} }}} \right. \kern-\nulldelimiterspace} {\left( {1 \plus i_{j} } \right)^{t \minus \setnum{2005}} }}} \right]}}](https://static.cambridge.org/binary/version/id/urn:cambridge.org:id:binary:20151128065440419-0767:S147474721100031X_eqn5a.gif?pub-status=live)
with Q j,t indicating the joint probability that an insurant with characteristics (aj,gj) in year t is dead whereas the married partner is still alive. The level of the survivor pension depends on j's pension entitlement and several socio–economic characteristics of the partner, captured by the vector Yk: the partner's own pension entitlement, age, health status, etc. Unfortunately, CIB does not provide information on the partner's characteristics. We assume that the surviving partner always receives a ‘large’ widow(er) pension and that the corresponding income equals the mean pension entitlement of a married beneficiary of the same gender. According to SSC VI, any Euro of a survivor's income exceeding a threshold amount of 26.4 times the current pension level reduces the survivor pension by €0.40. As ‘large’ widow(er) pensions are granted if the surviving partner has reached the age of 47 and all insurants in the working sample are of age 60 or older, using ‘large’ widow(er) pensions in the computations should be an appropriate procedure.
4 Sample description
Table 1 provides the sample composition. The sample is about equally split in male and female beneficiaries. About three out of four beneficiaries are married or re-married. The average age at retirement is about 63 years with hardly any difference between male and female beneficiaries. Accordingly, compared to the official retirement age of 65 years in year 2005, the average beneficiary retires about 2 years earlier. Indeed, as can be seen from Figure 4, a substantial fraction of the working sample already retires around the age of 60 years.

Figure 4. Retirement age, decomposed by gender
Table 1. Socio-demographics of the sample

Note: Standard deviation in parentheses. Database is CIB 2005 (FDZ-RV – SUFVVL2005).
Table 2 illustrates the sample composition by type of old-age pension. Most beneficiaries receive an old-age retirement pension according to SSC VI, section 35, a so-called ‘Regelaltersrente’. Entitlement to ‘Regelaltersrente’ requires that a beneficiary has completed her 65th life year, and has been insured for a specific time period (the so-called ‘Wartezeit’). Other beneficiaries in the sample receive an unemployment or part-time work old-age pension. Such an old-age pension is credited to beneficiaries of age 60 or older in case of unemployment or part-time employment around retirement (see SSC VI, section 237 for details). For female beneficiaries further regulations may apply (SSC VI, section 237a). Altogether 4,241 female beneficiaries are entitled to old-age pensions according to SSC VI, sections 237 and 237a. Specific regulations also apply to handicapped persons. A handicapped person is granted an old-age pension after having completed her 63rd year of life if she can claim a ‘Wartezeit’ of at least 35 years.Footnote 15 Altogether, 2,151 beneficiaries are entitled to such a pension, the predominant fraction of them being male. Finally, old-age pensions for long-term insured persons (‘Altersrente für langjährig Versicherte’, SSC VI, section 36) are granted to beneficiaries of age 62–65 years with a ‘Wartezeit’ of 35 years. With 1,888 out of 2,161 cases, male beneficiaries constitute the dominant part of this sub-sample.
Table 2. Number of beneficiaries by type of pension

Note: Column ‘LEAT’ gives the value of the variable LEAT that defines the corresponding type of pension. SSC VI denotes Social Security Code Book VI. Database is CIB 2005 (FDZ-RV – SUFVVL2005).
Gender-specific distributions of remuneration points accumulated over their lifetimes can be taken from Figure 5. It is transparent that male beneficiaries, on average, accrue more remuneration points and hence are entitled to higher annual pensions than female beneficiaries. As can be taken from Figure 6, most of the difference can be explained by the fact that male beneficiaries typically have longer contribution periods compared to female beneficiaries. Yet, also the composition of the remuneration points is gender specific.Footnote 16 As outlined above, remuneration points can be gained from own contribution periods but also from non-contribution periods. Table 3 gives the shares of remuneration points accrued during periods when no own contributions were made. On average, about 15% of a beneficiary's remuneration points stem from non-contribution periods, and about 85% result from own contribution periods. The fraction of remuneration points from non-contribution periods is substantially higher for female beneficiaries (22.226% compared to 7.489%). Particularly, remuneration points for child-raising periods and care for an ill partner are driving this divide.

Figure 5. Remuneration points, decomposed by gender

Figure 6. Length of contribution period by gender
Table 3. Composition of remuneration points

Note: Standard deviation in parentheses. SSC VI denotes Social Security Code Book VI. Database is CIB 2005 (FDZ-RV – SUFVVL2005).
5 IRR estimates and the IRR distribution
Section 5 consists of two parts. Section 5.1 provides descriptive statistics of the IRR and its distribution. A regression analysis quantifying the determinants of IRR follows in Section 5.2.
5.1 Descriptive statistics
Table 4 presents the IRR sample means and standard deviations for the entire working sample, differentiated by gender and also by type of old-age pension. For example, consider the entry in row ‘Standard old-age retirement pension (SSC VI, section 35)’ in column ‘Female insurants’. It indicates that the expected average IRR on pension contributions for female beneficiaries receiving a standard old-age retirement pension is 4.753%. We would like to remind the reader that all IRR estimates are conditional upon insurants’ survival until retirement and healthy completion of employment history (i.e., not being disabled). Moreover, it is assumed that future pension entitlements are frozen on the 2008 level.
Table 4. Rates of return by type of pension

Note: Standard deviation in parentheses. SSC VI denotes Social Security Code Book VI. Database is CIB 2005 (FDZ-RV – SUFVVL2005).
An immediate observation following from the figures is that female beneficiaries benefit from an above-average expected IRR, i.e., 3.884% compared with 2.572% for male beneficiaries. The difference in gender-specific average IRR can be explained by a longer payoff phase for females resulting from a higher life-expectancy. Another reason is that particularly females benefit from remuneration points credited in non-contribution periods for childcare, etc. By type of old-age pension, recipients of a standard old-age retirement pension benefit from the highest IRR. The regression analysis following in Section 5.2 investigates these and other relationships in more detail.
Figures 7 and 8 complement the information provided in Table 4 by IRR histograms. In each graph, the horizontal axis gives IRR, and the vertical axis the relative frequency of beneficiaries with a respective IRR level. Figure 7 provides the gender-specific information for the full sample, and Figure 8 provides IRR histograms by type of old-age pension. Black bars always relate to female beneficiaries, gray bars to male beneficiaries.

Figure 7. Rate of returns, decomposed by gender

Figure 8. Rates of return, decomposed by type of pension and gender of insurants
Figure 7 suggests that IRR distributions are highly gender specific. For male beneficiaries, the distribution looks lognormal with a peak slightly above 2% and a fatter right than left tail. For female beneficiaries, the distribution is about uniformly distributed between 2.0% and 4.5%, and it possesses a fatter right tail. Histograms by pension-type in Figure 8 support the impression of systematic gender-specific differences even after controlling for the type of pension. Most pronounced is the difference in SSC VI, section 35-related pensions. Here the shape is uniform for female beneficiaries with a peak at an IRR level of about 4.5%. For male insurants, the distribution has two peaks, one at an IRR level of about 2.0% and another around 4.0%. The graph for section 237a pension recipients contains only one histogram. The reason is that only female insurants are credited section 237a pensions. The peak of the histogram is at an IRR level of around 2.5%.
5.2 Regression analysis
The subsequent regression analysis is performed for two purposes. First, it quantifies how insurants’ individual characteristics and PAYG system inherent regulations affect IRR. Second, it sheds light on whether such regulations have similar effects on the IRR of female and male beneficiaries after controlling for individual characteristics.
The regression model is
The left-hand variable ij is the nominal internal rate of return (IRR) for beneficiary j in percent. The parameter α denotes the regression constant. The variable s j,r gives the share of remuneration points of type r, excluding the share of remuneration points from own contributions to avoid multi-collinearity. As remuneration points from own contributions are excluded from the regression, βr should be positive for non-contribution periods when remuneration points are credited as a result of specific regulations, e.g., childcare.Footnote 17 To assess how earning capacity affects IRR, we further include the variable ![]() . It reveals how much, in relative terms, the total sum of remuneration points from own contributions, RPj, deviates from the sample mean,
. It reveals how much, in relative terms, the total sum of remuneration points from own contributions, RPj, deviates from the sample mean, ![]() . If ζ>0 (ζ<0), IRR is positively (negatively) related with earnings capacity and the system entails a lifetime regressive (progressive) element. D j,p is a dummy variable. It takes the value 1 if beneficiary j receives an old-age pension according to paragraph p (other than SSC VI, section 35 which serves as the reference). Hence, parameter δp captures IRR differences across different types of old-age pensions. Partnerj is a dummy indicating the marital status of the insurant. It is set equal to one if the insurant is married and zero else. Due to survival pensions, we should expect the respective regression coefficient φ to be positive. The variable ΔAgej gives the difference between the official retirement age and insurants’ age at retirement, so that ϕ captures the effect of early retirement on IRR.Footnote 18 Finally, ∊j denotes the error term. In addition to a regression based on the full-working sample, we also run gender-specific regressions and apply χ2 tests to investigate whether the right-hand side variables have the same effects for male and female insurants.
. If ζ>0 (ζ<0), IRR is positively (negatively) related with earnings capacity and the system entails a lifetime regressive (progressive) element. D j,p is a dummy variable. It takes the value 1 if beneficiary j receives an old-age pension according to paragraph p (other than SSC VI, section 35 which serves as the reference). Hence, parameter δp captures IRR differences across different types of old-age pensions. Partnerj is a dummy indicating the marital status of the insurant. It is set equal to one if the insurant is married and zero else. Due to survival pensions, we should expect the respective regression coefficient φ to be positive. The variable ΔAgej gives the difference between the official retirement age and insurants’ age at retirement, so that ϕ captures the effect of early retirement on IRR.Footnote 18 Finally, ∊j denotes the error term. In addition to a regression based on the full-working sample, we also run gender-specific regressions and apply χ2 tests to investigate whether the right-hand side variables have the same effects for male and female insurants.
The regression results are provided in Table 5. Adjusted coefficients of determination suggest that the regression models capture heterogeneity in IRR satisfactorily well. F statistics reject the null-hypothesis that all the regression coefficients (excluding the constant) are zero.
Table 5. Results from regression analysis

Note: *** denote significance at the 1% level; ** at the 5% level; * at the 10% level. Standard errors in parentheses. SSC VI denotes Social Security Code Book VI. Database is CIB 2005 (FDZ-RV – SUFVVL2005).
Concerning the composition of remuneration points, remuneration points from childcare and care have a particularly positive impact on IRR. The χ2 test statistic indicates that the effect is more pronounced for females (at 10% significance level). Moreover, such remuneration points are typically accumulated by female beneficiaries, contributing to the gender divide in IRR observed in Section 5.1. For the full sample, the regression coefficient pertaining to the share of additional/credited remuneration points for childcare has no significant effect. For the male sub-sample, it has a strong and negative effect. However, the result should not be overrated: only eight male insurants are credited additional/credited remuneration points, and the share of such remuneration points in the total sum of remuneration points for the eight insurants is quite low (ranging between 0.204% and 0.341%). The regression coefficient for the ‘share of remuneration points from contribution-free periods’ exhibits a negative sign for all three samples. The effect of contribution-free periods on IRR is quantitatively stronger for females (at 5% level). Contribution-free periods include periods when no own contributions have been made for reasons not in the responsibility of the insurant (so-called ‘Ersatzzeiten’). Particularly, such periods include war captivity and prosecution during Nazi dictatorship. Contribution-free periods also encompass none-insured periods due to sickness, maternity or unemployment (so-called ‘Anrechungszeiten’). IRR decreases in the ‘share of remuneration points from such contribution-free periods,’ and the effect is stronger for female insurants. The ‘share of remuneration points from periods of reduced contributions’ rises IRR, at least for male insurants. For female insurants, the effect is insignificant. Periods of reduced contributions are a mixture of own-contribution periods and ‘Anrechnungszeiten’, for example, a month where an insurant is working on a part-time basis and simultaneously is enrolled as a student. If, during such periods, remuneration points from own contributions fall below a specific threshold, additional remuneration points are granted (see SSC VI, section 71, para. 2). The effect is particularly strong for male insurants. The ‘share of additional remuneration points from periods of reduced contributions’ also has a positive effect on IRR. Again, the effect is more pronounced for male compared to female insurants.
Earnings capacity, measured by ΔRPj, turns out to be negatively related with IRR: the more contributions from own earnings an insurant has provided over her/his lifetime, the lower is IRR. Interpreting IRR as an indicator of the life-time redistribution, the finding indicates that Germany's pension system is progressive, redistributing in favor of insurants with a lower earnings capacity. The effect is more pronounced for male compared to female insurants. We would like to remind the reader that the survival probabilities underlying our calculations do not differentiate with respect to income. Differential mortality may weaken or even offset the progressive effect.Footnote 19
Via survivor pensions, the system also redistributes in favor of married insurants. Compared with non-married beneficiaries, average IRR for the married is significantly higher. The longer life expectancy of females in combination with the positive age difference between husbands and spouses explain why the effect is more pronounced for male insurants (regression coefficients of 0.456 for male and 0.126 for female insurants, and a highly significant χ2 statistic).
Early retiring beneficiaries receive below-average returns reflecting regulations punishing early retirement (for the role of early retirement on returns on pension contributions see also Börsch-Supan (Reference Börsch-Supan2000), and references cited therein). As indicated by an insignificant χ2 statistic, the impact of such regulations is the same for male and female insurants.
Concerning the set of dummy variables distinguishing retirees by type of pension, full sample estimates indicate no differences in IRR for section 35 retirees, our reference group, sections 36 and 237 retirees. However, recipients of old-age pensions for handicapped persons (SSC VI, section 37) benefit from a slightly higher IRR, while the opposite is true for females receiving a section 237a pension. The latter finding is driven by the fact that female section 237a-pension recipients, on average, retire 2.893 years earlier than female insurants falling into another pension category.
Finally, the regression constant is the same for female and male insurants. After controlling for all the right-hand-side variables, regressions do not indicate IRR of male and female insurants to be different.
6 Implications
To get a better idea about what an average IRR of 3.3% means, it may be interesting to compare this number to the returns of a risk-free asset. We have chosen German Federal Treasury notes (with a 7-year life) as a benchmark. Between years 1969 and 2005, the average rate of return on such notes was 6.31%, although rates of return are lower from year 2000 onward. This can be seen from Figure 9 that provides time series of rates of return on 7-year life German Federal Treasury notes. Accordingly, in a world where insurants would have had an option to invest their PAYG contributions in bonds, they had been better-off.

Figure 9. Rates of return on 7-year-life German Federal Treasury notes
Making such a direct comparison of returns is naive for a number of reasons. The PAYG system involves a life-insurance element. In particular, there are two issues concerning the timing of death. First, the capital stock from an investment in treasury notes may be exhausted too early in case the person lives longer than expected. On the contrary, the PAYG system covers the insurant until the random date of death. The second issue about the timing of death is that the insurant might die ‘too young’, even many years before retirement age. Then the PAYG system can serve, via survivor pensions, as insurance for the surviving partner (or children). Such a risk is not insured by an investment in treasury notes. Via pensions for the disabled, the PAYG system also provides insurance in case of reduced earning capacity. Risk-averse insurants may be reluctant to accept a low but stable rate of return on PAYG contributions rather than higher yet more volatile returns on bonds. Another aspect is that it is not ruled out that capital markets are affected by population aging, too (with some delay). The asset market meltdown hypothesis predicts that, when the baby boomers retire, they will sell bonds and stocks and this will negatively affect the value of such assets (see Poterba, Reference Poterba2001). Then returns on assets in the past are a much optimistic predictor for their future returns. Also, the recent turbulence in financial markets indicates that even conservative saving plans do not assure that saving wealth will be enough to pay for an adequate living standard during retirement.
To better understand the meaning of our IRR estimates it is also interesting to examine the specific macro-economic conditions in the contribution phase of the 2005 retirees and the actual conditions when the entitlements must be financed by today's contributors. For this reason, Figure 10 depicts the long-run trends of several macroeconomic variables since the early/mid 1950s. Our working sample experienced a long phase with low unemployment rates, particularly in the 1950s until the early 1970s. Also labor productivity and wage growth have been quite high particularly in the earlier years, yet slowing down over the observation period. Particularly in the early years, a huge gap in gender-specific labor force participation rates existed, but the gap continuously narrowed. Low birth rates together with a rising life expectancy doubled the dependency ratio from about 16% in year 1950 to about 32% in the late 2000. Compared to the later periods, inflation rates have been relatively high in the 1970s and in the early years after unification.

Figure 10. The macro picture
Particularly the upward trend in the dependency ratio lays ‘stress’ on the PAYG system. The higher the dependency ratio, the more retirees’ pension entitlements each actual contributor needs to finance. Ensuring a positive IRR for today's elderly may result in higher contribution rates for today's active generation and/or require higher tax-financed transfers thereby shedding doubts on the sustainability and economic attractiveness of the system for later generations. Nevertheless, only recently the German government has passed a law that nominal pension entitlements of today's pensioners will never decline, most likely resulting in higher contribution rates in the next years. Accordingly, our scenario with inter-temporally constant nominal pension entitlements may be a good benchmark for the actual IRR levels for the birth cohort 1940–1945.
Low inflation rates and low nominal wage growth in recent years tend to lower average IRR. Given that inflation rates remain at a low level, future pensioner generations, ceteris paribus, are likely to realize lower nominal returns on their pension investments than the birth cohorts investigated in the present paper. If inflation rates systematically change over time, a fair profitability comparison, however, requires an IRR measurement in real terms.
The decline in fertility together with the rise of female labor supply will have implications for the IRR distribution of future pensioner cohorts. Both trends are likely to reduce the length of non-contribution periods of female insurants, and this should translate into lower IRR for future female pensioner cohorts. Accordingly, it is likely that the gender divide in IRR becomes lower in the next few decades. Converging labor-force participation rates of females and males should work in the same direction.
Finally, given the political will to guarantee a minimal living standard for pensioners together with rising unemployment rates and discontinuous employment biographies, more redistribution will be required in the future. A provision of the funds via higher PAYG contributions or lower returns, ceteris paribus, puts further pressure on the returns of insurants whose pension exceeds the legal minimum. An alternative financing via taxes results in a higher tax burden for particular economic groups or for the entire economy. If the sum of total earnings is negatively affected by such a policy, pension cuts and lower IRR for future cohorts are likely.
7 Concluding remarks
Based on real-life employment biographies for German PAYG pension insurants retiring in year 2005, the present paper has provided the distribution of intra-cohort IRR on pension contributions. Such information should be particularly useful to policy makers who want to understand the intra-cohort redistributive effects of Bismarck-type pension systems.
Under the conservative assumption that nominal future pension entitlements are frozen at the year 2008 level, we find that the expected average nominal IRR is slightly above 3%. Differences in life expectancy, earnings capacity, marital status and other socio-economic characteristics, however, translate into substantial differences in IRR across insurants. Our findings suggest that the German pension system, at least within the cohort retiring in 2005, redistributes toward female insurants (due to a higher life expectancy), married insurants (due to survivor pensions), and toward insurants with children (as periods of child-care are credited in the German pension system). Moreover, it turns out that the system is intra-cohort progressive, as indicated by a negative correlation between rates of return and lifetime earning capacity.
Finally, some words on the limitations of our analysis. First, our IRR estimates are conditional on reaching retirement age. Insurants deceasing earlier are not included in our calculations. The fraction of the population not reaching retirement age is about 15% for male and 8% of female insurants. If no survivor pension is granted, the de-facto IRR of these insurants is minus infinity (positive investments but zero returns). Second, insurants with East German employment biographies are not included in our working sample. Germany's pension system, however, grants pension entitlements to people with East German employment biographies. As we see no sensible way to convert Mark, the currency in the former GDR, to Euro, we have excluded these insurants from the analysis. Third, the working sample exclusively consists of old-age pensioners. Accordingly, our estimates do not reflect that the system redistributes resources to recipients of a pension of limited duration paid during a period of a serious illness. The inclusion of such benefits may affect both level and patterns of intra-cohort redistribution. Finally, the IRR estimates do not reflect that billions of taxes are spent to stabilize the system year by year, and that pensioners bear part of the tax burden. In year 1990, taxes in the amount of €20.371 Billion have been transferred to stabilize the system. Until 2008, the amount has more than tripled to €78.615 billion (see German Pension Insurance, 2009, p. 221).


