


Introduction
Palaearctic in origin (Titus Reference Titus1911), the alfalfa weevil Hypera postica (Gyllenhal) (Coleoptera: Curculionidae) is the most economically important insect pest of alfalfa (Medicago sativa Linnaeus; Fabaceae) in western United States of America (Long et al. Reference Long, Getts, Goding, Stevens, Clark, Putnam and Mostafa2017; Pellisier et al. Reference Pellisier, Nelson and Jabbour2017) and the southern Canadian prairies (Aasen and Bjorge Reference Aasen and Bjorge2009; Soroka and Otani Reference Soroka, Otani and Floate2011). The first Canadian record of alfalfa weevil was from southeastern Alberta and southwestern Saskatchewan in 1954 (Hobbs Reference Hobbs1954). In the mid-1990s, notable alfalfa weevil numbers were found across southern Saskatchewan (J. Soroka, unpublished data), and heavy infestations in the last decade caused losses to alfalfa quantity and quality to Saskatchewan and Manitoba hay crops (Hartley Reference Hartley2008; Gavloski Reference Gavloski2017). Alfalfa weevil is univoltine in Canada, overwintering as an adult in crop residue and litter in or near alfalfa fields (Beirne Reference Beirne1971). As temperatures warm in spring, adult alfalfa weevils become active, feed, and mate; females lay eggs on or near alfalfa shoots. Larvae emerge shortly thereafter, with early instars feeding on vegetative terminals and young growth, and third and fourth instars shredding entire leaves (Bundy Reference Bundy, Sumach, Rhodes and Lamp2015). After a short pupal period in mid- to late summer, adults emerge, feed on senescing alfalfa, and then select sites in which to overwinter (Hamlin et al. Reference Hamlin, Lieberman, Bunn, McDuffie, Newton and Jones1949). Although both adults and larvae feed on alfalfa foliage, over 90% of the damage is caused by third and fourth instars (Koehler and Pimentel Reference Koehler and Pimentel1973). Mitigation of economic loss from the alfalfa weevil can be achieved by early cutting and/or insecticide sprays (Onstad and Shoemaker Reference Onstad and Shoemaker1984), the principal methods for alfalfa weevil control in alfalfa hay and seed production on the Canadian prairies (Aasen and Bjorge Reference Aasen and Bjorge2009; Saskatchewan Ministry of Agriculture 2019). A precise determination of pest population development results in maximum benefit from control application, with the best economic outcome occurring when control is applied prior to the appearance of large numbers of third-instar alfalfa weevils (Koehler and Pimentel Reference Koehler and Pimentel1973).
Since insects are ectothermic, temperature is a major abiotic factor influencing their growth and development. Numerous historic natural history studies have shown that temperature is the most critical environmental factor to affect alfalfa weevil survival and development (Cook Reference Cook1925; Essig and Michelbacher Reference Essig and Michelbacher1933; Yakhontov Reference Yakhontov1934). Growing degree days are a temperature-based measure of the time that organisms require to complete specific developmental stages, starting at a base temperature unique to each organism (Pruess Reference Pruess1983; Sharratt et al. Reference Sharratt, Sheaffer and Baker1989). While the physiological relationship between insect developmental rate and temperature is curvilinear in shape, and degree-day models are summations of the linear portion of insect developmental curves, such models often provide sufficient simplicity and accuracy for practical use in timing of sampling and control application, especially if daily temperatures do not regularly enter the lower or upper curvilinear portions of the curve (Higley and Peterson Reference Higley, Peterson, Pedigo and Buntin1994).
Many degree-day models have been created, adjusted, and refined for alfalfa weevil development, using a variety of modelling techniques. From laboratory results, Guppy and Mukerji (Reference Guppy and Mukerji1974) plotted the development of alfalfa weevil from egg to adult over 11 constant temperatures using fitted curves from the logistic equation 1/y = K/(1 + e a−bx), where y is development time, x is temperature, and K, a, and b are constants. From these curves the authors then calculated the expected degree days from the peak of one developmental stage to the next, using a lower developmental threshold of 10 °C, and tested the expected degree days against observed values from two Ontario (Canada) locations (Guppy and Mukerji Reference Guppy and Mukerji1974). Harcourt (Reference Harcourt1981) used alfalfa weevil life table data collected over four years from locations in southeastern Ontario to determine peak egg hatch (50% eclosion) as a starting point for degree-day accumulation, a lower developmental threshold of 9 °C, and a sine curve approximation (Baskerville and Emin Reference Baskerville and Emin1969) for degree-day calculation, in order to refine the degree-day values of Guppy and Mukerji (Reference Guppy and Mukerji1974). Schaber et al. (Reference Schaber, Lysyk and Lactin1994) used correlations between relative abundance of alfalfa weevil life stages and degree-day accumulations, from a lower developmental threshold of 10 °C, calculated by sine wave integration (Allen Reference Allen1976), wherein degree-day accumulations were calculated as the area under a sine wave temperature curve above the minimum development temperature (Higley et al. Reference Higley, Pedigo and Ostlie1986), to predict the appearance of different life stages of the alfalfa weevil in seed alfalfa fields in southern Alberta. In the United States of America, Eklund and Simpson (Reference Eklund and Simpson1977) used an alfalfa weevil mean egg lower developmental temperature threshold of 6.9 °C and an egg hatch mean value of 174 degree days to determine degree-day accumulations for alfalfa weevil populations in Colorado. In Wyoming, United States of America, Brewer and Hoff (Reference Brewer and Hoff2002) used a 10 °C lower developmental temperature threshold and simple mean temperature to determine the initiation of alfalfa weevil sampling. Stilwell et al. (Reference Stilwell, Wright, Hunt and Blankenship2010) used a 9 °C lower developmental temperature threshold and the sine wave method generated by the computer programme DEGDAY (version 1.2) to calculate alfalfa developmental degree days in eastern Nebraska, United States of America. Peterson and Meyer (Reference Peterson and Meyer1995) used an 8.9 °C lower developmental temperature threshold and the sine wave method generated by the computer programme ClimProb3.1 to calculate alfalfa developmental degree days, using 60-year temperature data sets from 12 midwestern states from southern Missouri to northern North Dakota, United States of America. In North Dakota, Knodel and Beauzay (Reference Knodel and Beauzay2018) (updated from Beauzay et al. Reference Beauzay, Knodel and Ganehiarachchi2013) used a model adapted from the Harcourt (Reference Harcourt1981) model but with a base alfalfa weevil developmental temperature of 8.9 °C and with degree-day accumulation values for alfalfa weevil development stages that are sine wave-based according to the method of Allen (Reference Allen1976) and, thus, differing somewhat from the values of the model of Harcourt (Reference Harcourt1981). The values are the same as those commonly used to predict alfalfa weevil development in several central states of the United States of America (e.g., Wisconsin (University of Wisconsin (2010) and South Dakota (Varenhorst et al. (Reference Varenhorst, Bachmann, Edwards, Rozeboom and Wagner2018)).
Determination of the phenology of alfalfa weevil development in alfalfa ecosystems is an important prerequisite for an effective management of the insect, but validated models to forecast alfalfa weevil development in the Canadian prairie provinces are lacking. Given the variety of parameters and methods used to determine degree-day development of alfalfa weevil populations as exemplified by the above and other investigations, rather than developing a new model for alfalfa weevil phenology, we wished to compare the accuracy of three alfalfa weevil growing degree-day models developed elsewhere for alfalfa weevil population prediction in locations across the Canadian prairies. We evaluated three temperature sources to determine which predictive model and temperature source combination provided the best fit of expected and observed instar data peaks. In this manner, we aimed to improve the prediction of alfalfa weevil developmental stages in alfalfa production regions of Alberta, Saskatchewan, and Manitoba.
Materials and methods
Alfalfa weevil phenology
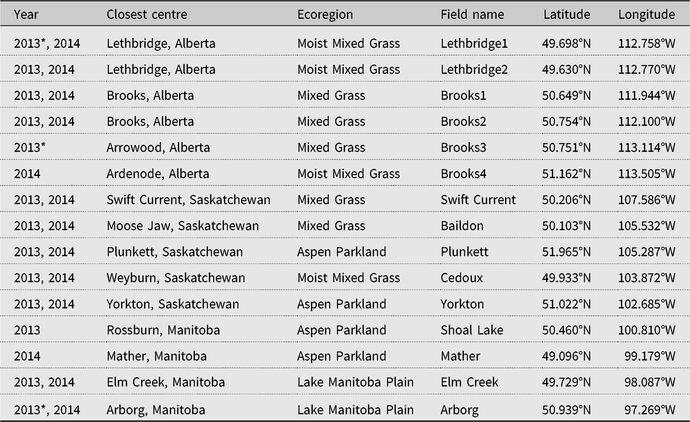
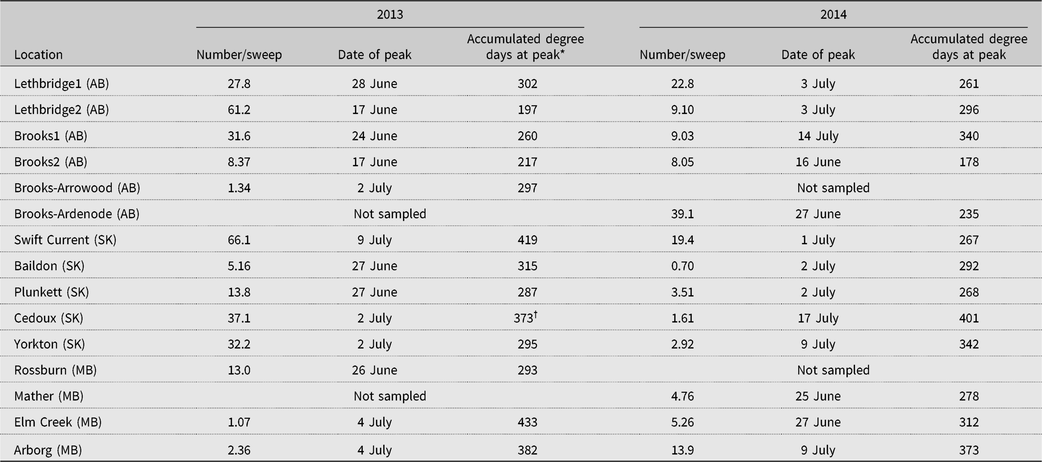
Thirteen alfalfa hay fields, five in Alberta, five in Saskatchewan, and three in Manitoba, were monitored for the presence of alfalfa weevils at approximately weekly intervals from the time of alfalfa regrowth in spring until mid- or late summer in 2013; 11 of these fields and two others in the vicinity of the two that were sampled only in 2013 were sampled in 2014, for a total of 26 field-years of data from 15 individual fields in four prairie ecoregions (Table 1). Of the 26 field-years of data obtained, alfalfa weevil larval development data were not used from three fields in 2013, Lethbridge1, Brooks3, and Arborg, for logistic reasons, including insufficient numbers of sampling dates and sampling initiation too late in the season. Results from the remaining 14 fields and 23 field-years were used in data analyses (Table 1). Early in the season, at the onset of new alfalfa growth, alfalfa stems in each field were examined for the presence of alfalfa weevil adults and evidence of their feeding (Johansen and Retan Reference Johansen and Retan1971). Three randomly selected, undisturbed stems of alfalfa from each of 10 sites 25–50 m apart within a field, and chosen in a predetermined pattern depending on the size and configuration of the field (Otani Reference Otani2015; Saskatchewan Ministry of Agriculture 2019), were examined visually in situ for the presence of overwintering adults and small larvae, with alfalfa weevil number and developmental stage recorded. Stem sampling continued weekly as the alfalfa grew. When the alfalfa was tall enough to sweep, at approximately 10 cm height, each field was sampled by sweeping plants with a standard 38-cm insect net. Ten 180° walking sweeps were taken at each of 10 sites in the field that were 25–50 m apart and chosen in a predetermined sampling pattern, and the sweep nets emptied into plastic bags (100 sweeps and 10 sample bags per field). After each 10-sweep sample, three nearby, randomly selected, undisturbed alfalfa stems were collected and placed in bulk in a paper bag. All bags were placed in insulated boxes containing ice packs, and samples from Saskatchewan and Manitoba were brought or shipped by refrigerated courier to the Agriculture and Agri-Food Canada Saskatoon Research Centre laboratory at Saskatoon, Saskatchewan. Samples were refrigerated and analysed or frozen until analysis. Samples from Alberta were handled similarly, and examined at the Agriculture and Agri-Food Canada laboratory at Lethbridge, Alberta, or the Alberta Agriculture and Forestry (Alberta Agriculture Food and Rural Development) laboratory in Brooks, Alberta. In the laboratory, the number of alfalfa weevils in each growth stage – first to fourth instar, pupa, or overwintered/newly emerged summer adult – was determined under a stereomicroscope using body length, head capsule measurements, and morphological features (Hamlin et al. Reference Hamlin, Lieberman, Bunn, McDuffie, Newton and Jones1949; Whiteford and Quisenberry Reference Whiteford and Quisenberry1990; Cook et al. Reference Cook, Ratcliffe, Gray and Steffey2003). Alfalfa weevil numbers and developmental stage were calculated initially from pooled stem samples, then from pooled stem and sweep samples, and, after the majority of larvae had passed the second instar growth stage, from pooled sweep samples alone. Proportions of each instar for each field and sampling date were calculated by dividing the total number of larvae in each growth stage by the total number of all alfalfa weevils collected from the field on that sampling date. The sampling date with the greatest proportion of larvae in each instar was deemed the observed population peak for that instar. Alfalfa weevils were identified through the keys of Titus (Reference Titus1911) and Anderson (Reference Anderson1948). Voucher specimens have been deposited at the Strickland Museum, University of Alberta (Edmonton, Alberta, Canada).
Table 1. Geographic locations and ecoregions of alfalfa hay fields surveyed in 2013–2014.

* Data not used.
Degree-day determination
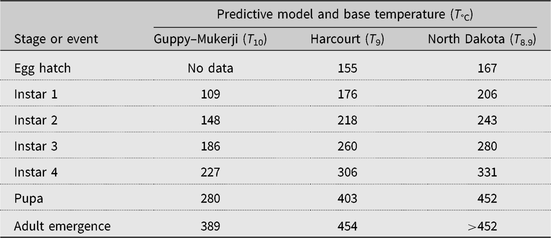
Three alfalfa weevil development models were tested: the Guppy–Mukerji (Guppy and Mukerji Reference Guppy and Mukerji1974) and Harcourt (Reference Harcourt1981) models, selected because of their development using data from Canadian latitudes, and the model described in Knodel and Beauzay (Reference Knodel and Beauzay2018), which we term the North Dakota model, selected because of its use in proximity to Manitoba and Saskatchewan alfalfa fields. Each model that we tested has different accumulated degree-day values required to reach population peak by the various alfalfa weevil growth stages (Table 2). Given the closeness of the alfalfa weevil lower developmental threshold for the Harcourt (9 °C) and North Dakota models (8.9 °C), we used a 9 °C lower developmental threshold for both models. Starting from 1 January, we used a biofix or start of degree-day accumulation date equal to the day of first accumulation of degree days above the alfalfa weevil lower developmental threshold of 10 °C (Guppy and Mukerji (Reference Guppy and Mukerji1974) or 9 °C (Harcourt Reference Harcourt1981; Knodel and Beauzay Reference Knodel and Beauzay2018). That is, biofix date = first degree day when (((maximum T + minimum T)/2) − lower developmental threshold) > 0.1 °C.
Table 2. Predicted number of accumulated degree days to date of peak occurrence of alfalfa weevil growth stages according to three development models with three base temperatures.

At the beginning of each season, Hobo Onset TidBit version 2 temperature probes (Hoskin Scientific, Burnaby, British Columbia, Canada) were placed in solar radiation shields affixed to stakes at a height of 120 cm at a convenient location at each of the 13 fields to record hourly air temperatures for the same duration as the alfalfa weevil collection period. At the end of the sampling period, temperature data were downloaded and returned to the Saskatoon laboratory for further analyses.
Degree-day data from three temperature sources were evaluated. First, in-field data were recorded from the temperature probes at each field as described above. Mean daily temperatures were determined by (daily Maximum T + daily Minimum T)/2, and accumulated degree days were calculated from the time of probe placement and when mean temperatures were greater than the lower minimal threshold. Second, temperature data from the Environment Canada weather station nearest to the field in question and typically within 40 km of it, with a start date of temperature assessment of 1 January and accumulated degree days calculated as for in-field data, were obtained. Third, an Agriculture and Agri-Food Canada multiple-site temperature data set, using multiple Environment Canada stations, with a temperature assessment start date of 1 March, and degree days estimated using the modified sine wave method of Allen (Reference Allen1976), was obtained. The maximum and minimum temperatures inputted into the formula were weighted averages of maximum and minimum temperatures reported by multiple nearby weather stations, weighted inversely as the square of the distance from the reporting station using the ArcMap 10.1 Spatial Analyst IDW tool (Environmental Systems Research Institute, Redlands, California, United States of America). Data from the in-field temperature probes, Environment Canada weather stations, and multiple-site data sets were downloaded to a central computer, and growing degree-day accumulations based on a particular development model and temperature data source were calculated for each field for the duration of the sampling period.
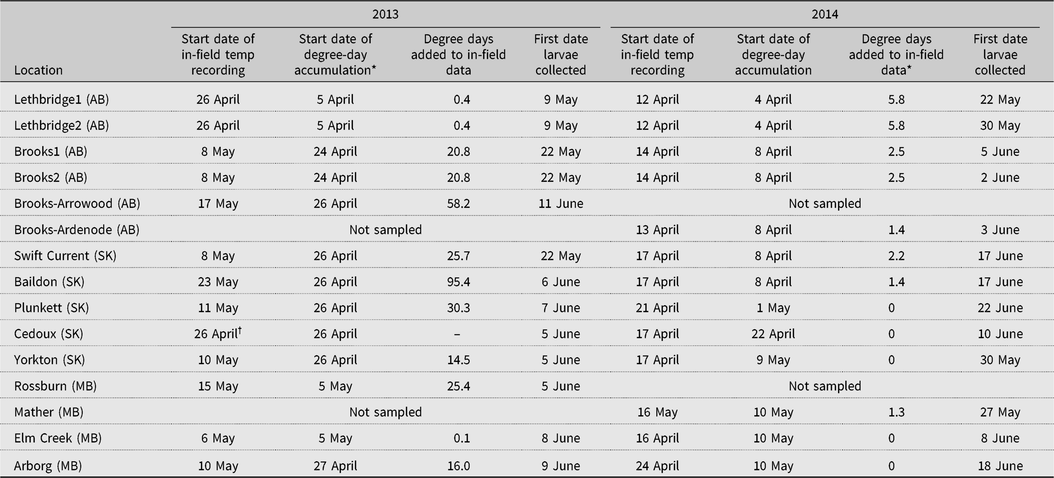
In 2013, the selection of fields and placement of temperature probes were delayed at all fields because of heavy mid-April snow cover and difficult field access, even though warm temperatures earlier in the month resulted in the accumulation of alfalfa weevil developmental degree days. To overcome this data gap, we added the growing degree days already accumulated from the nearest Environment Canada weather station to the start of in-field data set for a particular field (Table 3). For a base temperature of 9 °C, this gap ranged from 0.1 degree day at Elm Creek to 95.4 degree days at Baildon, averaging 25.7 ± 27.2 degree days. Setting out of probes was more timely in 2014 than in 2013, and the range of degree days added to the within-field temperature sets was 1.3–5.8, averaging 1.76 ± 2.04 degree days.
Table 3. Dates when within-field temperature recording began, when degree-day accumulation above a minimal alfalfa weevil development temperature of 9 °C began according to data from the nearest Environment Canada weather station, the number of accumulated degree days from the Environment Canada data added to within-field accumulated data, and the date of first collection of alfalfa weevil first instars in 13 alfalfa fields across Alberta (AB), Saskatchewan (SK), and Manitoba (MB) in 2013 and 2014.

* Start of accumulated degree days according to the nearest Environment Canada weather station, base 9 °C.
† Within-field temperature sensor failure throughout the season.
The observed dates of the greatest numbers of larvae collected for each of the four instars per field per year were compared to the predicted dates of occurrence, according to the data generated by each of the three predictive models and the three temperature data set combinations. The resultant binomially distributed data, with the dependent variable being the probability that the observed peak date did or did not overlap with the predicted peak date for each alfalfa weevil developmental model and temperature data source, were analysed against the independent fixed variables of instar, year, field, and ecoregion in which the field occurred, with random effects being the variation in fixed effects across predictive models and temperature sources. The binomial logistic regression program GLIMMIX of SAS (SAS Institute 2010) determined the probability of overlap of each predictive model, temperature data set, and combination of the two with observed larval instar peaks, incorporating the Tukey Kramer adjustment for multiple comparisons (SAS Institute 2010). Independent variables and their interactions were assessed, and the statistical model with the terms that gave the best explanation for a given data set was selected, using the FIT procedure (SAS Institute 2010) for model quality assessment. Results of the analyses were interpreted as predicted probability or odds of overlap of observed and expected population peaks. The GLIMMIX programme (SAS Institute 2010) fits generalised mixed models to binomial outcomes by maximum likelihood estimation using a logit link function and logistic regression analysis (Bolker et al. Reference Bolker, Brooks, Clark, Geange, Poulsen, Stevens and White2009). A developmental model was deemed successful at prediction if the predicted date of greatest alfalfa weevil numbers of a particular instar occurred within 3.5 days of the actual peak of that instar; given the weekly sampling regime, we assumed that the date of prediction occurred within a seven-day overlap window around the date of observed peak of a particular alfalfa weevil instar (Schaber et al. Reference Schaber, Lysyk and Lactin1994; Brewer and Hoff Reference Brewer and Hoff2002). We first evaluated the instar over pooled data as an independent variable in the analyses to determine whether the pattern of individual alfalfa weevil instars themselves varied in the overlap of observed and predicted cumulative degree-day values. We then determined the probability of overlap of predicted peaks using each predictive model and temperature data set with observed instar peaks for each field within and between years. Because of the 1300-km distance between our farthest data points, we then grouped our fields into the ecoregion in which they were located, according to the Ecological Stratification Working Group (1995) classification system, to account for possible disparity in alfalfa weevil occurrence and prediction on a broad ecoregional scale. Our fields were located in four ecoregions of the Prairie Ecozone: the Lake Manitoba Plain, Aspen Parkland, Moist Mixed Grass, and Mixed Grass Ecoregions.
Results
Alfalfa weevil phenology
Despite one of the coldest Februarys on record across all three prairie provinces in 2014 (Environment Canada 2019), the initiation of degree-day accumulation for alfalfa weevil development in the spring of 2014 was similar to or earlier than in 2013 at most fields sampled (Table 3). A comparison of mean April–June temperatures based on the nearest Environment Canada weather stations showed that spring temperatures were similar between the two years, with the average monthly April–June temperatures over the commonly sampled fields varying by only 0.3 ± 0.6 °C. In 2013 the biofix or degree-date accumulation start dates ranged from 5 April near Lethbridge, Alberta, to 5 May near Elm Creek, Manitoba; in 2014, comparable dates were 4 April at Lethbridge to 10 May in Manitoba fields (Table 3).
The extremely cold winter of 2014 may have contributed to decreased alfalfa weevil numbers collected in 2014 relative to 2013. In 2013, six of our 13 fields had maximum alfalfa weevil larval numbers that surpassed a nominal economic threshold of 20 alfalfa weevils per sweep (Long et al. Reference Long, Getts, Goding, Stevens, Clark, Putnam and Mostafa2017; Saskatchewan Ministry of Agriculture 2019), while only two fields did so in 2014 (Table 4).
Table 4. Alfalfa weevil population peak numbers and dates when peaks were measured at 13 alfalfa fields across Alberta (AB), Saskatchewan (SK), and Manitoba (MB) in 2013 and 2014.

* Accumulated degree days recorded from within-field temperature probes, base 9 °C.
† Within-field temperature sensor failure; data from the nearest Environment Canada weather station.
Degree-day assessment
An examination of (a) the growing degree days necessary to reach peak alfalfa weevil growth stages according to the three degree-day models evaluated, (b) the growing degree days accumulated according to the three temperature recording methods, and (c) the peak number of each of the four different alfalfa weevil instars sampled at each of the fields sampled in each of the two years led to the collection of 591 usable data points out of a potential maximum of 828 points (2013: 3 × 3 × 4 × 10 fields plus 2014: 3 × 3 × 4 × 13 fields) for a comparison of observed and expected instar population peaks.
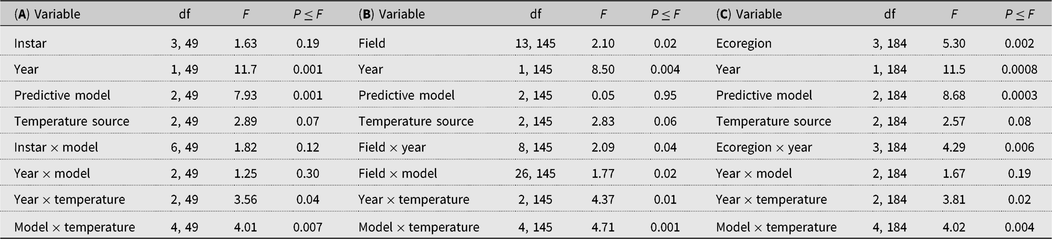
When the data were analysed by individual alfalfa weevil instar, neither instar nor instar by any other variable interaction significantly affected the probability of overlap in our analysis, and our best fit model excluded most instar interaction terms (Table 5A). In subsequent analyses, the probability of overlap of date of estimated and observed population peaks was evaluated uniquely for each of the four instars in each field, but instar and instar interaction terms were not included in the analyses models (Table 5B–C).
Table 5. Analyses of independent variables: A, individual instar; B, field sampled; C, ecoregions in which the fields were situated, and sampling year to binomial logistic regression models of the number of times that actual accumulated degree days for alfalfa weevil population peaks overlapped with those of three predictive models and three temperature sources.

When the data were analysed by fields sampled, the fields varied in their probability of overlap of predicted and observed date of peak instar (Table 5B), and a significant field by predictive model term (Table 5B) pointed to a greater variation in overlap among the predictive models at some fields than others (Fig. 1). Year affected the probability outcomes (degrees of freedom (df) = 1, 145; F = 8.50; P = 0.004; Table 5B), with a higher probability of overlap in 2013 (0.49) than in 2014 (0.35). There was a significant year by field interaction (df = 8, 145; F = 2.09; P = 0.04; Table 5B). The pattern of results from all three predictive models was similar between years, and the year by predictive model interaction was not included in the analytical model. Although the temperature source did not significantly affect probabilities as a main effect, the year by temperature source interaction was significant (df = 2, 145; F = 4.37; P = 0.01; Table 5B) (Fig. 2). While the probability of overlap was lower in 2014 for all three temperature data sources, least-squares-means values indicated that only the multiple-site temperature data set varied significantly in probability of peak date overlap between 2013, when the probability of overlap was 0.51, and 2014, when the probability of overlap was 0.37 (df = 1, 17; t = 3.16; P = 0.001).
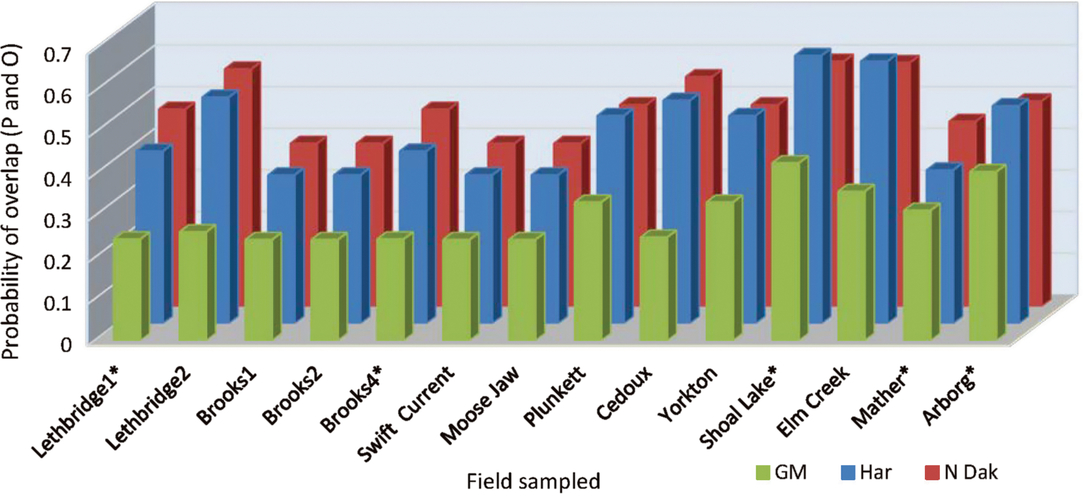
Fig. 1. Probability of overlap, to within 3.5 days, of predicted (P) alfalfa weevil life stage population peaks using three developmental models, Guppy–Mukerji (GM), Harcourt (Har), and North Dakota (N Dak), compared with observed (O) population peaks at 14 alfalfa fields in western Canada, over 2013 and 2014. Fields listed with asterisks have one year of data.
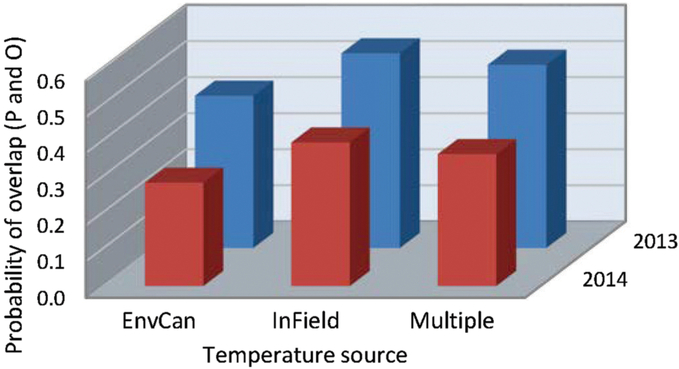
Fig. 2. Probability of overlap, to within 3.5 days, of predicted (P) alfalfa weevil life stage population peaks using three degree-day temperature accumulation methods, the nearest Environment Canada weather station (EnvCan), in-field temperature probe (InField), or Agriculture and Agri-Food Canada multiple-site weighted temperature degree-day accumulations (Multiple), compared with observed (O) population peaks at 14 fields across the Canadian prairies in two years, 2013 and 2014.
The predictive model by temperature source interaction term had the highest P value of all analysis components, despite lack of significant main effects of both predictive model and temperature source (df = 4, 145; F = 4.71; P = 0.001) (Table 5B). When the data were analysed by predictive model, temperature source was a significant variable for all three models (df = 2, 49 for the three models; F = 3.34, 4.51, and 5.07; P = 0.04, 0.02, and 0.01 for Guppy–Mukerji, Harcourt, and Multiple-Site models, respectively). Least-squares-means values indicated that the Environment Canada temperature data source was different from either in-field or mixed-site data in the probability of overlap for all three predictive models. However, the pattern of probabilities over temperature sources was reversed between the Guppy–Mukerji and the two other predictive models (Fig. 3); for all comparisons, df = 1, 49; for the Guppy–Mukerji model, t EnvCan-Multiple = 2.50, P EnvCan-Multiple = 0.04; for the Harcourt model, t EnvCan-Multiple = −2.97, P EnvCan-Multiple = 0.01; and for the North Dakota model, t EnvCan-Multiple Site = −2.80, P EnvCan-Multiple Site = 0.02, as well as t EnvCan-InField = −2.80, P EnvCan-InField= 0.02. GLIMMIX analyses of all field parameters determined that the best population peak data overlap was at the Elm Creek field in 2013, using the Harcourt model and the Agriculture and Agri-Food Canada multiple-site temperature data set to predict second instar peak, with the probability of overlap of predicted and observed dates of population peak at 0.84. The worst data predictions were at fields near Brooks1, Brooks2, Swift Current, and Baildon in 2014, using the Guppy–Mukerji model and the Agriculture and Agri-Food Canada multiple-site temperature data set to predict the fourth instar peak, all fields with odds of overlap of predicted and observed dates of population peak at 0.13 (Fig. 1).
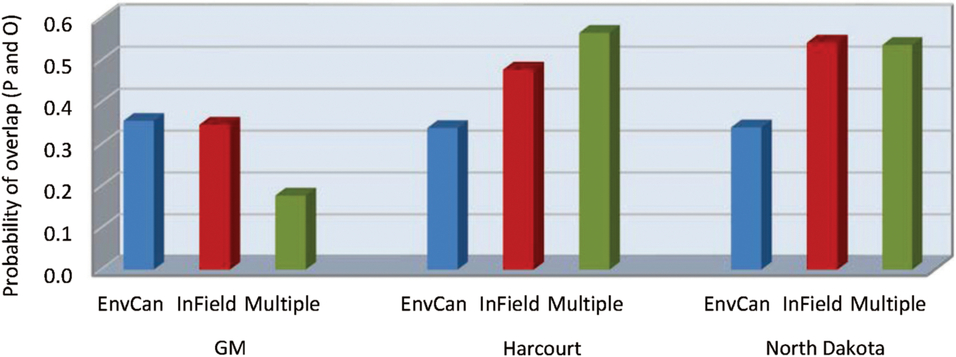
Fig. 3. Probability of overlap, to within 3.5 days, of predicted (P) alfalfa weevil life stage population peaks using three developmental models, Guppy–Mukerji (GM), Harcourt, and North Dakota, and three degree-day temperature accumulation methods, the nearest Environment Canada weather station (EnvCan), in-field temperature probe (InField), or Agriculture and Agri-Food Canada multiple-site weighted temperature degree-day accumulations (Multiple), compared with observed (O) population peaks at 14 fields across the Canadian prairies over two years, 2013 and 2014.
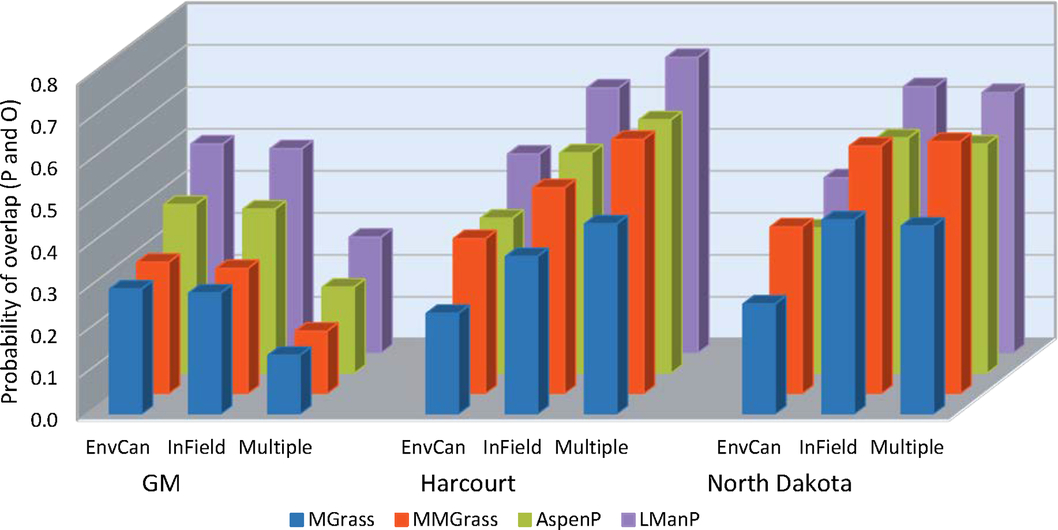
When the fields were grouped by ecoregion, the variable that most affected our analyses was the predictive model used (df = 2, 184; F = 8.68; P = 0.0003) (Table 5C) (Fig. 4). Over both years and temperature data sets, the Guppy–Mukerji model probability of overlap of predicted and observed dates of instar population peak was 0.30, that of the Harcourt model was 0.38, and the North Dakota model was 0.41. The year by model interaction term was not significant, with the probability of overlap lower in 2014 than in 2013 for all three predictive models. However, when we examined the probability of overlap by year within each model, there was no difference in probability between years in the Guppy–Mukerji model, but probabilities were significantly lower in 2014 than 2013 for the Harcourt and North Dakota models (for both models df = 61, t Harcourt = 12.2, P Harcourt < 0.001; and t North Dakota = 7.17, P North Dakota = 0.001, respectively). The model by temperature interaction was significant, with significant least-squares-means differences between the probability of overlap for the Guppy–Mukerji model and both the Harcourt and North Dakota models, using the in-field temperature data set (for both comparisons, df = 59, t Guppy–Mukerji-Harcourt = –4.54, P Guppy–Mukerji-Harcourt < 0.0001, t Guppy–Mukerji-North Dakota = –4.24, P Guppy–Mukerji-North Dakota = 0.0002). The ecoregion significantly affected the probability of matching observed and expected instar population peak (Table 5C) (Figs. 4–5). Over both years, the Lake Manitoba Plain Ecoregion had the greatest probability of peak date overlap at 0.52, the Aspen Parkland value was 0.43, the Moist Mixed Grassland value was 0.42, and the Mixed Grass Ecoregion had the lowest probability of predicted and observed peak date at 0.33 (Fig. 5). Because of improved FIT statistics, we excluded from our analysis the ecoregion by predictive model and ecoregion by temperature source interaction terms, which were found to be not significant in previous ecoregion analyses. However, the ecoregion by year interaction was significant (df = 3, 184; F = 4.29; P = 0.006) (Table 5C), indicating that the probabilities of overlap for ecoregions varied with year (Fig. 6). Least-squares-means values revealed that in 2013 differences were significant between Lake Manitoba Plan and both Moist Mixed Grass and Mixed Grass ecoregions (for both comparisons, df = 75, t LMP-MMG = 3.34, P LMP-MMG = 0.007, t LMP-MG = 3.05, P MLP-MG = 0.02), while in 2014 differences in least squares means were significant between Moist Mixed Grass and Mixed Grass ecoregions (df = 105; t = −3.37; P = 0.006). Although temperature source by itself did not influence the analyses, there was a significant year by temperature source interaction (Table 5C). Only multiple-site temperature data varied significantly in probability of peak date overlap between the two years (df = 1, 59; t = 3.51; P = 0.001).

Fig. 4. Probability of overlap, to within 3.5 days, of predicted (P) alfalfa weevil life stage population peaks using three developmental models, Guppy–Mukerji (GM), Harcourt, and North Dakota, and three degree-day temperature accumulation methods, the nearest Environment Canada weather station (EnvCan), in-field temperature probe (InField), or Agriculture and Agri-Food Canada multiple-site weighted temperature degree-day accumulations (Multiple), compared with observed (O) population peaks at 14 fields in four prairie ecoregions (listed in Table 1), Lake Manitoba Plain (LManP), Aspen Parkland (AspenP), Moist Mixed Grass (MMGrass), and Mixed Grass (MGrass) over two years, 2013 and 2014.
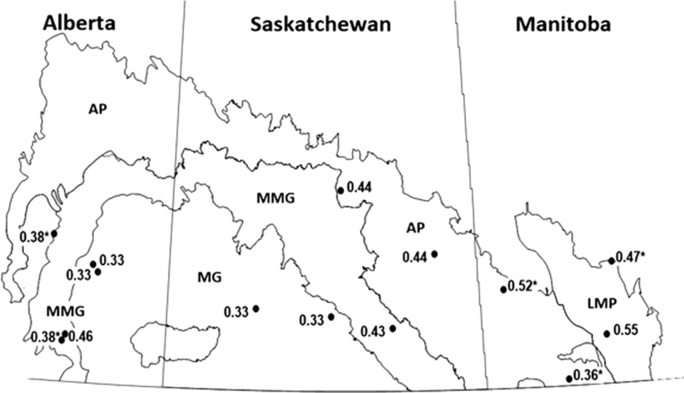
Fig. 5. Canadian prairie province ecoregions monitored for alfalfa weevil population development, 2013–2014, and the average probability of accuracy of instar prediction at 14 fields in those ecoregions. LMP, Lake Manitoba Plain; AP, Aspen Parkland; MMG, Moist Mixed Grass; MG, Mixed Grass. Values with asterisks are single-year data.
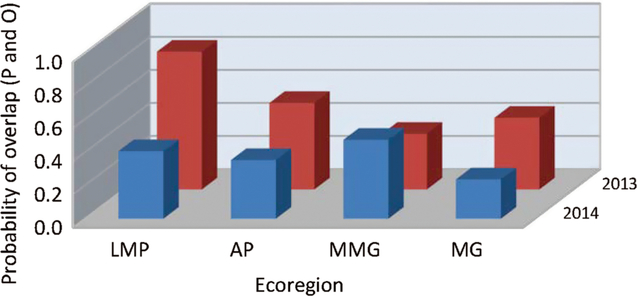
Fig. 6. Probability of overlap, to within 3.5 days, of predicted (P) alfalfa weevil life stage population peaks compared with observed (O) population peaks, averaged over development model and temperature source, at 14 fields during 2013–2014 in four prairie ecoregions (listed in Table 1): LMP, Lake Manitoba Plain; AP, Aspen Parkland; MMG, Moist Mixed Grass; MG, Mixed Grass.
Discussion
Developmental model and developmental model by temperature source interactions were the parameters that most influenced the probability of overlap of our observed and predicted alfalfa weevil growth peaks. The significant interactions between the two terms found in all analyses indicate that the relationships between the components of the two variables are complex and not uniform. The results of this investigation show that there is no best model for the prediction of alfalfa weevil growth stage peaks across the three Canadian prairie provinces, or any best temperature source for degree-day accumulation, but some predictive models and temperature source combinations are better than others in predicting alfalfa weevil developmental stages.
Our results that data from the Guppy–Mukerji model least often overlapped with the observed peak instar growth of the three predictive models tested may be a function of the minimum temperature threshold of the model. Although Guppy and Mukerji (Reference Guppy and Mukerji1974) found a 42% hatch rate of alfalfa weevil eggs that were reared at a constant temperature of 8 °C, they concluded that 8 °C was too low as a base temperature because no subsequent larvae reared at that temperature survived to adulthood, and they suggested that a development-survival threshold of 10 °C would be more satisfactory for predicting the seasonal development of alfalfa weevil populations. The authors did note that a base temperature of 6 °C may be more appropriate for eggs and early instars in the spring when temperatures are low (Guppy and Mukerji Reference Guppy and Mukerji1974). Our finding that odds of overlap of observed and predicted dates of population peaks did not vary with instar suggests that the use of one developmental temperature in alfalfa weevil phenology prediction is appropriate, but the Guppy–Mukerji minimum temperature likely is too high. The use of constant temperatures to determine developmental minimal temperatures (Sweetman and Wedemeyer Reference Sweetman and Wedemeyer1933; Koehler and Gyrisco Reference Koehler and Gyrisco1961; Roberts et al. Reference Roberts, DeWitt and Armbrust1970; Guppy and Mukerji Reference Guppy and Mukerji1974; Harcourt Reference Harcourt1981) may not accurately reflect responses in the field. Insects that experience the fluctuating high and low daily temperatures that occur in the field can exhibit different responses and be less temperature-sensitive than those that are exposed to constant temperatures close to their developmental minima or maxima (Bahar et al. Reference Bahar, Soroka and Dosdall2012).
Koehler and Gyrisco (Reference Koehler and Gyrisco1961) reported the theoretical minimum temperature for larval development to be 9 °C, and today the most frequently used minimal developmental temperature for North American alfalfa weevil degree-day models is 8.9–9.0 °C (Koehler and Gyrisco Reference Koehler and Gyrisco1961; Harcourt Reference Harcourt1981; Whiteford and Quisenberry Reference Whiteford and Quisenberry1990; DeGooyer et al. Reference DeGooyer, Pedigo, Giles and Rice1996; Brewer et al. Reference Brewer, Legg and Grey2008; Stilwell et al. Reference Stilwell, Wright, Hunt and Blankenship2010; Knodel and Beauzay Reference Knodel and Beauzay2018), although Zahiri et al. (Reference Zahiri, Fathipour, Khanjani, Moharramipour and Zalucki2010) found the theoretical minimum temperature for intrinsic rate of increase of alfalfa weevil in Iran to be as low as 5.7 °C. When Schaber et al. (Reference Schaber, Lysyk and Lactin1994) determined the phenology of alfalfa weevil in southern Alberta alfalfa seed fields, they used a minimum developmental temperature of 10 °C. The alfalfa weevil phenology they observed differed from that of Harcourt (Reference Harcourt1981), which may have been due, in part at least, to the different base temperatures of the two studies.
Our similarities in the probability of overlap using the Harcourt and North Dakota models suggest that, when considering the predictive model alone, either could be used for alfalfa weevil phenology prediction. This is unexpected given the different number of accumulated degree days predicted for the instar population peaks for the two models. However, the differences in degree-day accumulation between the two models are relatively constant and low, averaging about 25 degree days more for the North Dakota model for each of the four instars, which could amount to two or three days of temperature accumulation in a field. Field sampling more frequently than the weekly regime used here may better differentiate the accuracy of the two models.
The lack of significant main effects of temperature data source on prediction accuracy suggests that temperature source by itself did not affect the accuracy of alfalfa weevil phenology prediction. It is unlikely that the addition of data from the nearest Environment Canada weather station to that collected by in-field sensors at the beginning of the 2013 season influenced the lack of a significant temperature source main effect on prediction accuracy in that year. There was no indication of erroneously similar results between the Environment Canada data source and the adjusted in-field data source in the Baildon field, which had the largest amount of degree days added to the in-field data set, or any other field, including the ones with additions of < 1 °C. As well, the additions of accumulated degree days from the nearest Environmental Canada weather station to in-field data sets using the Guppy–Mukerji model were smaller than for the other two models because the higher base temperature of this model meant that the accumulation started later in the season, closer to our actual in-field start dates. Further, over all the fields, the patterns of probability of overlap of predicted and observed population peaks using the three temperature sources were comparable between 2013 and 2014, even though there was minimal temperature data adjustment in the latter year. Using only one prediction model, Brewer and Hoff (Reference Brewer and Hoff2002) found that on-site and nearest weather station temperature data for alfalfa weevil development in northern Wyoming gave similar information regarding degree-day accumulation for the assessment of alfalfa weevil population phenology.
Our finding that the probability of overlap of predicted and observed date of population peak of the temperature source varied with the alfalfa weevil development model used is novel. The opposite results seen between the Environment Canada and multiple-site temperature data sets using the Guppy–Mukerji model, and the Environment Canada and multiple-site data sets in combination with either of the other two models, are puzzling and warrant further investigation. We evaluated data from the nearest Environment Canada weather station because the majority of Canadian prairie alfalfa producers do not have access to on-site temperature records, and we examined the Agriculture and Agri-Food Canada multiple-site method of degree-day accumulation in an attempt to improve prediction accuracy over the nearest weather station data, which it generally did. The study found that the use of either the Harcourt or North Dakota models with the Agriculture and Agri-Food Canada multiple-site temperature data set was the most appropriate combination of factors to predict alfalfa weevil population development over the Canadian prairies. Although it cannot explain our Guppy–Mukerji model results, the increase in accuracy between the nearest Environment Canada weather station and Agriculture and Agri-Food Canada multiple-site temperature data set found using the Harcourt and North Dakota models in this study may be a reflection of the smoothing effects of multiple points of temperature recording. Discrepancies between weather station temperature data and field temperatures may occur due to differences in topography, distance from the weather station to the field, and other factors such as observation time, latitude, surface structure, and even urbanisation (Baker et al. Reference Baker, Kuehnast and Zandlo1985).
Our finding that year strongly affected the accuracy of prediction of alfalfa weevil development was unexpected given the closeness in biofix dates and the similar average temperatures over the three spring months of both years. The extremely cold winter of 2013–2014 across the prairies and heavy rains in June at several fields likely explains the fewer adult alfalfa weevils and lower subsequent larval numbers found in 2014. Low numbers of larvae would have decreased the accuracy and increased standard error in the assessment of peak instar date.
Some insects have a genetically based geographic gradient in their response to climate (Peterson Reference Peterson1960; Tauber and Tauber Reference Tauber and Tauber1986), and previous studies have found variation in the thermal response of alfalfa weevils along a latitudinal gradient as low as 1° or 2° (DeGooyer et al. Reference DeGooyer, Pedigo, Giles and Rice1996 in Iowa; Stilwell et al. Reference Stilwell, Wright, Hunt and Blankenship2010 in Nebraska). Our study fields varied by 2.9° latitude and 15.5° longitude, but no relationship in the probability of date of peak overlap became apparent using either geographic parameter. Likewise, thermal gradient did not appear to play a large role in our probability values. It is reasonable that the Lake Manitoba Plain ecoregion scored differently than the Moist Mixed Grass and Mixed Grass ecoregions in alfalfa weevil development prediction accuracy in 2013, as it was the smallest ecoregion surveyed, is farthest away from the warmer two ecoregions, and is the ecoregion closest to the areas where the Harcourt and North Dakota models originated. However, as our 2014 results show, field location per se and their temperature profile differences cannot explain the differences in predicted and observed overlaps among Mixed Grass and Moist Mixed Grass ecoregions since the fields surveyed in those two ecoregions are closer and more thermally similar to each other than to fields in the other two ecoregions. There could be many reasons for the significant effect of ecoregion on the probability of overlap. As well as the physical and climatological components that comprise the ecosystems, other factors such as alfalfa agronomy and management practices, and even the migration pattern of alfalfa weevil itself (J. Soroka, unpublished data), may play a part in the variability among ecoregions in the prediction of alfalfa weevil development.
This research points to the caution needed when adopting the use of predictive models in areas in which they were not developed and tested, and highlights the many factors and their interrelationships that can affect model accuracy. The accuracy of growing degree-day accumulation models can vary considerably (Zahiri et al. Reference Zahiri, Fathipour, Khanjani, Moharramipour and Zalucki2010; Marchioro et al. Reference Marchioro, Krechmer, de Moraes and Foerster2015), as exemplified by our wide range of accuracy in predicting peak alfalfa weevil growth stage in this study, with the probability of overlap varying from 0.13 to 0.84. Despite their similarities, the three models tested here interacted uniquely with our temperature data and field parameters, and producers need to consider factors other than degree-day values alone when planning to implement alfalfa weevil control measures. In the Lake Manitoba Plain in 2013, our probability of accurate prediction rates approached the 85–90% range suggested by Higley and Peterson (Reference Higley, Peterson, Pedigo and Buntin1994) to be necessary to manage insect pest sampling and control efforts effectively. Producers in the Mixed Grassland Ecoregion, on the other hand, should be aware of the inadequacies of the models and temperature sources, and should supplement reliance on degree-day accumulation data with frequent sampling of their alfalfa fields. Our finding that the accuracy of prediction declined in years of low alfalfa weevil numbers should hearten producers, since control timing is less urgent or necessary in years of low alfalfa weevil populations.
For farmers, agronomists, and extension personnel in the Canadian prairie provinces, especially those not in the Mixed Grass Ecozone, either the Harcourt or North Dakota degree-day models could be useful for estimating alfalfa weevil development stage and determining when to initiate monitoring for alfalfa weevil presence, with consideration given to the inadequacies mentioned above. As a general guideline, once either of these models suggests first instars are present, field monitoring should be initiated to determine if alfalfa weevil numbers approached economic thresholds. Resources such as the Prairie Pest Monitoring Network (http://prairiepestmonitoring.blogspot.com), which posts seasonal growing degree-day maps incorporating Agriculture and Agri-Food Canada multiple-site day accumulation, should be consulted. It is important to note that decisions regarding alfalfa weevil management need to be made based on field scouting, which degree-day models can help initiate, and not directly from the results of degree-day models themselves.
Acknowledgements
We gratefully acknowledge funding from the Pest Management Centre, Agriculture and Agri-Food Canada, Ottawa, Ontario, Canada, for part of this research. Our thanks to Carolyn Herle of Agriculture and Agri-Food Canada Lethbridge; Nirmal Hari, Jane Thornton, Lionel Kaskiw, and staff of Manitoba Agriculture; Trevor Lennox, Bill Bilegatu, Nadia Mori, Lorne Klein, Lyndon Hicks, and Charlotte Ward of Saskatchewan Ministry of Agriculture; and Agriculture and Agri-Food Canada Saskatoon and Lethbridge summer students for sampling and insect identification. We thank the following, all from Agriculture and Agri-Food Canada, Saskatoon: David Giffen generated maps; Boyd Mori confirmed alfalfa weevil identification by genetic sequencing; and Ross Weiss provided temperature and modelling advice. We thank two anonymous reviewers for their suggestions.


