


Introduction
Watermelon (Citrullus lanatus (Thunb.) Matsum. & Nakai) is a speciality vegetable valued mainly for its fruits and seeds. The genus Citrullus consists of cultivated watermelon and six other distinct species viz., C. amarus, C. mucospermus, C. colocynthis, C. ecirrhosus, C. rehmii and C. naudinianus (Chomicki and Renner, Reference Chomicki and Renner2015). The crop is native to Africa (Renner et al., Reference Renner, Sousa and Chomicki2017). However, considerable diversity exists in India and the species C. colocynthis is found to grow in the wild in the country (Dane et al., Reference Dane, Liu and Zhang2007). Over 4000 years ago, domestication of C. lanatus started in North-eastern Africa, Egypt and Sudan from which, few elite selections were introduced into India during the 8th Century (Paris et al., Reference Paris, Daunay and Janick2013). Since then, it is under cultivation in irrigated as well as conserved moisture conditions and mainly for seed purpose in the arid and semi-arid regions of Rajasthan. As a result of gene flow between C. lanatus and C. colocynthis, several well-adapted landraces with novel characters have evolved in India (Mahla et al., Reference Mahla, Singh and Roy2014). During the 11th Century, the crop was introduced into China (Zhao, Reference Zhao2015), where few local dessert varieties and an edible-seeded variety were developed and are still prevalent (Levi et al., Reference Levi, Jarret, Kousik, Wechter, Nimmakayala, Reddy, Grumet, Katzir and Garcia-Mas2017). Owing to the presence of ample genetic diversity, the area adjoining India and China is considered as the secondary centre of origin of the genus Citrullus (Wehner, Reference Wehner, Prohens and Nuez2008). The crop was introduced into the Americas after 1493 (Zoltán et al., Reference Zoltán, Gyulai, Szabó, Horváth and Heszky2007) and several important cultivars have been developed over the last 250 years (Levi et al., Reference Levi, Jarret, Kousik, Wechter, Nimmakayala, Reddy, Grumet, Katzir and Garcia-Mas2017). Some of these US cultivars like Mickey Lee and Bush Sugar Baby share genetic relatedness to the Asian gene pool (Hwang et al., Reference Hwang, Kang, Son, Kim and Park2011).
There exists ample variability for different horticultural traits, but several studies indicated narrow genetic diversity among the cultivated varieties (Kwon et al., Reference Kwon, Oh, Yi, Kim, An, Yang, Ok and Shin2010; Minsart et al., Reference Minsart, Zoro, Dje, Baudoin, Jacquemart and Bertin2011; Levi et al., Reference Levi, Thies, Wechter, Harrison, Simmons, Reddy, Nimmakayala and Fei2013). The narrow genetic base of the cultivated species might be the result of ‘founder effect’ originating from the introduction of few superior genotypes and their use in genetic improvement and directional selection for few consumer appealing traits (Dane and Liu, Reference Dane and Liu2007). Further, the narrow genetic base poses a challenge for breeders, especially for resistance breeding. A large germplasm panel without the information of trait diversity hinders their successful utilization (Zhang et al., Reference Zhang, Fan, Guo, Ren, Gong, Zhang, Weng, Davis and Xu2016). This necessitates a thorough understanding of genetic diversity in the available germplasm for broadening the genetic base using wild accessions.
A core set (Frankel and Brown, Reference Frankel, Brown, Holden and Williams1984) represents maximum diversity with minimum repetitiveness, thus helps in efficient management, conservation and utilization of germplasm. To date, a core watermelon collection has been established by Zhang et al. (Reference Zhang, Fan, Guo, Ren, Gong, Zhang, Weng, Davis and Xu2016) from a germplasm panel including only 51 Indian accessions, which might not represent the extent of diversity present in Indian germplasm. Keeping the above facts in mind, we attempted to study the genetic diversity and population structure of Indian Citrullus sp. accessions in comparison with exotic collections and to formulate a core set of Indian accessions of watermelon.
Materials and methods
Plant materials
The experimental material comprised of 336 genotypes (online Supplementary Table S1) collected from 15 different countries (194 inbreds and 19 hybrids and their derivatives from India, 77 from the USA, 15 from Nigeria, eight from Thailand, five from Senegal, three each from China and Zimbabwe, two each from Japan, South Africa, Mali and Botswana and one each from Ghana, Moldova, Taiwan and Zambia). The germplasm panel consisted genotypes of the cultivated species (C. lanatus; n = 241) along with three other related-wild species viz., C. mucospermus (n = 49), C. colocynthis (n = 44) and C. amarus (n = 2) were used for the current study (online Supplementary Table S2). The genotypes were collected from the respective countries through germplasm explorations while the genotypes mentioned under the USA were collected from Germplasm Resource Information Network by ICAR-NBPGR (online Supplementary Table S3). All these genotypes are actively being maintained at ICAR-IIHR.
Experimental site and morphological evaluation
The genotypes were evaluated phenotypically during the rabi season of 2015–2016 in Randomized Complete Block Design with three replications comprising 10 plants in each replication. The site is located at 890 m above mean sea level at 13°08′26.6″N latitude and 77°30′2.2″E longitude. The soil in the experimental plot has loamy-sand texture, neutral pH (6.7) and belongs to Alfisol order. The total nitrogen, phosphorus and potassium content in the soil are 188.2, 89.6 and 350 kg/ha; estimated following the standard alkaline permanganate (Subbiah and Asija, Reference Subbiah and Asija1956); sodium bicarbonate (Olsen et al., Reference Olsen, Cole, Watanabe and Dean1954) and flame-photometric (Black, Reference Black1965) methods, respectively. Fourteen-day old seedlings were transplanted in the experimental plot at a spacing of 180 cm × 45 cm. Standard cultural practices were followed to raise a healthy crop stand except for fungicidal sprays (including tebuconazole, pyraclostrobin and trifloxystrobin) which are generally used for managing gummy stem blight in watermelon. Observations were recorded for 12 qualitative characters viz., early plant vigour, plant growth habit, degree of lobing of the leaf blade, sex expression, fruit shape, primary and secondary rind colour, rind stripe colour, flesh colour, distribution of grooves on the fruit skin, flesh bitterness, seed-coat colour, stripe colour and five quantitative traits viz., fruit weight, vine length, number of primary branches per plant, number of fruits per plant and Total Soluble Solids as per the minimal descriptor for watermelon of ICAR-National Bureau of Plant Genetic Resources, New Delhi, India (online Supplementary Table S3). For the vegetative and fruit characters, observations were recorded on seven random plants per replication for each accession.
Simple sequence repeat genotyping for molecular analysis
Three weeks after transplanting, bulked leaf samples were collected from 10 random plants from each accession for molecular analysis. Genomic DNA was isolated from these samples by following a modified CTAB method (Doyle and Doyle, Reference Doyle and Doyle1987) with minor modifications. Air-dried DNA pellets were re-suspended in 1X TE Buffer (pH = 8.0) and were quantified by using UV-Spectrophotometer (GeneQuantPro, GE Healthcare, USA). The dilution was made accordingly in milli-Q water to obtain the final working concentration of 10 ng DNA/μl.
Zhang et al. (Reference Zhang, Wang, Guo, Ren, Gong, Weng and Xu2012) identified 23 simple sequence repeat (SSR) markers which possessed high polymorphism information content (PIC) and could consistently group watermelon accessions similar to the grouping pattern made using SNP data obtained from whole-genome sequencing as well as using data on morphological traits. Thus, these markers were considered to be a core set for diversity analysis. Among them, 21 markers were included in the current study. The remaining two markers viz., BVWS00734 and BVWS00333 were yielding faint inconclusive bands. Therefore, we replaced these markers with BVWS01708 and BVWS00539 which fall in the same bins respectively, on the linkage map of Ren et al. (Reference Ren, Zhao, Kou, Jiang, Guo, Zhang, Hou, Zou, Sun, Gong, Levi and Xu2012). The SSR primers were synthesized at Bioserve India Pvt. Ltd., Hyderabad. All the 336 accessions were genotyped using these 23 markers in a thermal cycler (Eppendorf, USA) with the following conditions: initial denaturation at 94°C for 5 min; denaturation 94°C for 30 s, annealing at 55°C for 30 s, extension at 72°C for 90 s for 35 cycles followed by a final extension at 72°C for 8 min. Each reaction (volume 16 μl) consisted of 4 μl nuclease-free water, 3 μl of genomic DNA (diluted to 10 ng/μl), 2 μl of each of dNTPs (1 mM), forward and reverse primers (10 pM), 2.5 μl of 10X polymerase chain reaction (PCR) buffer with MgCl2 and 0.5 μl Taq DNA polymerase (Genei, Bangalore, India). The PCR amplicons were run in 4% molecular biology grade agarose gel stained with 0.5 μg/ml of ethidium bromide (Genei, Bangalore, India) and was visualized in the gel documentation system (UVI-TEC, Cambridge). For each marker, the amplicons with the smallest size were scored as 1 and subsequently, incremental values were assigned with the increase in size. The missing values were scored as −9.
Statistical analysis
Major allele frequency, the average number of alleles, observed and expected heterozygosity (Ho and He) and PIC for each SSR marker were computed using PowerMarker v. 3.25 (Liu and Muse, Reference Liu and Muse2005).
The genotypic data of the SSR markers were used for population structure analysis employing admixture model-based approach implemented in STRUCTURE software v.2.3.4 (Pritchard et al., Reference Pritchard, Stephens and Donnelly2000). The data were tested from K = 1–10 populations (K = putative number of populations) with three replications and burn-in of 30,000 followed by 1,00,000 MCMC repeats for each run. Later, the three replicates of the analysis were integrated using CLUMPP software (Jakobsson and Rosenberg, Reference Jakobsson and Rosenberg2007). To avoid overestimation of the number of populations estimated from log-probability [LnP(D)] data, the number of subpopulations was estimated based on ΔK, by using ad-hoc web-based programme STRUCTURE HARVESTER (http://taylor0.biology.ucla.edu/structureHarvester/) (Evanno et al., Reference Evanno, Regnaut and Goudet2005). A membership probability of ≥0.75 was considered for assigning a genotype into a population and the genotypes with membership probability less than this value were assigned to an admixture group as per Rao et al. (Reference Rao, Kadirvel, Symonds, Geethanjali and Ebert2012). The genotypic data of individuals in each population were further subjected to intra-population analysis following the same protocol (Pritchard et al., Reference Pritchard, Stephens and Donnelly2000). Unweighted neighbour-joining tree for the Citrullus sp. accessions was also constructed with the genotypic data using DARwin v. 6.0.21 (Perrier and Jacquemoud-Collet, Reference Perrier and Jacquemoud-Collet2006).
The core collection was developed employing PowerCore v. 1.0 software which is based on a modified heuristic algorithm (Kim et al., Reference Kim, Chung, Cho, Ma, Chandrabalan, Gwag, Kim, Cho and Park2007). For this purpose, the data from 17 phenotypic traits and 23 microsatellite markers were utilized. To assess the homogeneity of the core with the original collection, Shannon Weaver diversity index (Shannon and Weaver, Reference Shannon and Weaver1963) and Nei diversity index (Nei, Reference Nei1973) were estimated for both the phenotypic traits and the SSR markers in both collections. Coverage of the phenotypic traits of the original collection was also estimated in the core as suggested by Kim et al. (Reference Kim, Chung, Cho, Ma, Chandrabalan, Gwag, Kim, Cho and Park2007).
Results
Phenotypic and molecular evaluation of the panel
Wide genetic variation was observed across the genotypes for 12 qualitative and five quantitative traits (online Supplementary Table S1). All the genotypes, except IIHR-86 and IIHR-184, had moderate to good early plant vigour. Two Indian inbreds viz., IIHR-15 and IIHR-86 had bushy plant habit. Further, 72 accessions had andromonoecious sex form and 17 accessions had nonlobed leaves. The maximum number of primary branches per plant was noted in IIHR-515 (C. mucospermus), while it was minimum in IIHR-277 (C. lanatus). IIHR-259 was most vigorous in terms of length of the vines, while IIHR-86 had the shortest vine. The fruit shape varied from round to oblong while the primary fruit skin colour varied from light green to yellow, the former states being predominant for both the traits. Most of the genotypes possessed medium to dark green striped fruits with few exceptions. The flesh colour in different C. lanatus genotypes varied as red, pink, canary yellow and salmon yellow. However, all the genotypes belonging to C. colocynthis, C. amarus and C. mucospermus had white-fleshed fruits. The average fruit weight varied from 0.1 kg in IIHR-573 (C. colocynthis) to 4.54 kg in IIHR-609 (C. lanatus) while the average number of fruits varied from 0.20 in 23 different accessions to 3.75 in IIHR-197 (C. colocynthis). Most of the genotypes of C. lanatus and C. colocynthis were dark-brown to tan seeded while all the C. mucospermus accessions were white seeded. The total soluble solid content varied from 1.0oBrix in IIHR-582 (C. colocynthis) to 11.33oBrix in IIHR-608. In addition to the C. lanatus, six C. colocynthis viz., IIHR-158, IIHR-202, IIHR-272, IIHR-286, IIHR-299 and IIHR-568 and 11 C. mucospermus viz., IIHR-310, IIHR-517, IIHR-530, IIHR-532, IIHR-533, IIHR-533, IIHR-534, IIHR-536, IIHR-537, IIHR-556, IIHR-587 and IIHR-605 accessions produced non-bitter fruits.
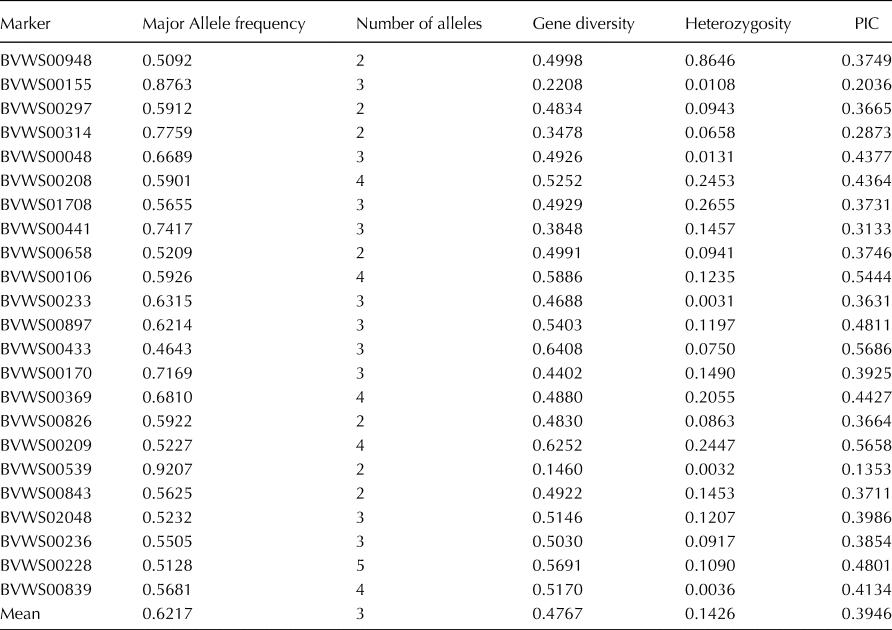
The 23 SSR markers yielded a total of 69 alleles across the germplasm panel. The range for the number of alleles varied from 2 (BVWS00948, BVWS00297, BVWS00314, BVWS00658, BVWS00826, BVWS00539 and BVWS00843) to 5 (BVWS00228) with an average of 3 alleles per locus. Average gene diversity and PIC were 0.4767 and 0.3946 respectively, recording mean heterozygosity of 14.26% over the whole panel under study (Table 1).
Table 1. General statistics of the SSR markers computed using PowerMarker v. 3.25
Population structure analysis
The model-based analysis implemented in STRUCTURE resulted in 30 data sets (three replications for each K from 1 to 10), which were then permuted for each K value by using CLUMPP software. The actual number of populations could not be inferred from the [LnP(D)] value as it increased continuously for each K from 1 to 10 (online Supplementary Figure S1A). Hence, second-order statistics (Evanno et al., Reference Evanno, Regnaut and Goudet2005) was applied and a sharp peak of ΔK was obtained at K = 2, suggesting the presence of two major populations (online Supplementary Figure S1B). The Population I (hereafter referred as Pop I) consisted of 271 accessions, majority of which were from India (72.69%, n = 197/271), followed by genotypes from the USA (55), Thailand (7), China (3), Nigeria (3), Japan (2) and one genotype each from Taiwan, Senegal, Botswana and Moldova. The population II (hereafter referred as Pop II) contained 46 accessions from the USA (18), Nigeria (10), India (7), Zimbabwe (3), two each from South Africa and Mali, and one each from Thailand, Senegal, Ghana and Botswana (Fig. 1, online Supplementary Table S3). The remaining 19 genotypes (nine from India, four from the USA, three from Senegal, two from Nigeria and one from Zambia) had membership probabilities less than 0.75 for any of the populations, hence were classified into an admixture group. The unweighted neighbour-joining tree was also constructed for the accessions (Fig. 2) and the clades were highlighted based on their area of the collection (A) and species (B).

Fig. 1. Model-based clustering of 336 accessions in two main populations and five subpopulations.

Fig. 2. Genetic relationship among 336 Citrullus sp. accessions. Unweighted neighbour-joining tree constructed using the genotypic data obtained from 23 SSR markers across the accessions. Clades are highlighted based on their area of collection (A) and species (B).
The two main populations could further be subdivided into five subgroups based on the ΔK values 3 and 2, for Pop I and Pop II, respectively. Population I, predominated by C. lanatus accessions (83.76%), consisted of three subgroups viz., Pop I-A with 31 accessions (26 from the USA, three from India and one each from China and Nigeria); Pop I-B with 55 accessions (50 from India, three from USA and one each from Thailand and Botswana) and Pop I-C with 54 accessions (46 from India, five from USA and one each from Nigeria, Thailand and Taiwan) and an admixture group with 131 genotypes, predominantly from India (74.81%, n = 98/131) (online Supplementary Table S3). Population II was subdivided into two subgroups viz., Pop II-A and Pop II-B, consisting of 21 and 17 genotypes respectively, and an admixture group with eight accessions. Both these sub-populations were predominated by the C. mucospermus accessions (90.47% and 94.12%; respectively; Fig. 1 and online Supplementary Table S2).
Analysis of Molecular Variance depicted significant differences among the five sub-populations, with a maximum genetic diversity of 33.5%. The genetic diversity within Pop I-B was 22.04% followed by Pop I-C (14.75%), Pop I-A (5.94%), Pop II-A (5.65%) and Pop II-B (4.25%). Pop I-B had maximum genetic diversity in terms of maximum values of both PIC value (0.6396) and the number of alleles per locus (2.5652) with a moderate frequency of major alleles (0.6704) while the minimum PIC (0.1843) and the maximum frequency of major allele (0.8455) was recorded in Pop I-A. Pop II-B exhibited the minimum number of alleles per locus (2.0435). Both expected and observed heterozygosity were maximum in Pop II-A (0.3286 and 0.1689, respectively) whereas the values were minimum in Pop I-A (0.2167 and 0.0981 respectively; Table 2). The genetic distance between these subpopulations, revealed by the pair-wise F st values (Table 3), indicated Pop I-A and Pop II-B to be the most diverse (F st = 0.6021) followed by Pop I-C and Pop II-B (F st = 0.5558). The genetic distance (F st = 0.2312) was found to be the minimum between Pop I-B and Pop II-A (Tables 2 and 3).
Table 2. Genetic diversity in the five sub-populations based on 23 SSR markers

Table 3. Pair-wise F st estimates among the five subpopulations identified

Formulation of the core set
A total of 194 indigenous Citrullus inbreds (19 hybrids and their derivatives were excluded from a total of 213; hereafter referred as the entire collection), belonging to five different species were subjected to core set analysis. The heuristic search in PowerCore identified 46 accessions as the core collection (online Supplementary Table S1). The values of MD, VD, CR and VR for the core set were 3.35, 29.89, 95.13 and 116.84%, respectively, as compared with the entire collection of Indian inbreds. As the VR was more than 100%, the resultant core collection is a good representative of the entire collection. The CR was also more than the 80% threshold suggested by Kim et al. (Reference Kim, Chung, Cho, Ma, Chandrabalan, Gwag, Kim, Cho and Park2007). This indicated a homogeneous distribution of the genotypes in the core collection. The distribution of Nei gene indices and Shannon Weaver diversity indices were similar in core and the original collection (Fig. 3). The value for Nei diversity index varied from 0.078 (growth habit) to 0.779 (BVWS00106) with an average of 0.547 in the entire population, while it varied from 0.126 (growth habit) to 0.808 (flesh colour) with an average of 0.587 in the core collection. Similarly, in the base collection, Shannon Weaver diversity index varied from 0.078 (growth habit) to 1.752 (BVWS00106) with an average of 1.016 in the entire collection, whereas in the core collection, it varied from 0.146 (growth habit) to 1.755 (BVWS00106) with an average of 1.120. A total of 16 markers (69.56% of 23 SSRs) had Nei diversity index of more than 60%, which implied the presence of greater genetic diversity in the accessions across the markers (Fig. 3).

Fig. 3. Distribution of Nei and Shannon Weaver diversity indices across phenotypic traits and molecular markers in the entire collection (E-Nei; E-Sh.W) and the core collection (C-Nei; C-Sh.W). The markers have been arranged according to their respective positions in watermelon genome.
Discussion
Phenotypic and molecular evaluation of the panel
Watermelon is a speciality vegetable crop which is nowadays bred keeping in view the specific traits preferred by the growers, traders and consumers. In general, a variety with a greater number of fruits per plant and bigger size of the fruits are widely accepted by the growers; crispy sweet flesh with fewer seeds by consumers and good shipping of varieties by traders. Bushiness of the vine is the most desirable target trait when watermelon is bred for container or rooftop garden or for planting in high density. The non-lobed leaf trait can be used as a morphological marker for maintenance of parental lines of hybrids as the character is recessive to normal lobed leaf. This is governed by a single dominant gene (ClLL1) situated on chromosome 4 (Wei et al., Reference Wei, Chen, Wang, Liu, Li, Zhang, Ma, Yang and Zhang2017). Though sweetness and flesh colour are the two most important traits that strongly influence consumer preference (Kyriacou et al., Reference Kyriacou, Rouphael, Colla, Zrenner and Schwarz2017); fruit shape, stripe pattern and as well as seed colour also stands as one of the key acceptance determining traits.
Microsatellite loci are prone to replication errors leading to multiple alleles. Therefore, their use in the characterization of genetic diversity provides better insights as compared to SNPs which are generally biallelic (Reddy et al., Reference Reddy, Abburi, Abburi, Saminathan, Cantrell, Vajja, Reddy, Tomason, Levi, Wehner and Nimmakayala2015). The average PIC value (0.3946) of all the SSR markers across the studied germplasm was less in magnitude than that reported by Mujaju et al. (Reference Mujaju, Zborowska, Werlemark, Garkava-Gustavsson, Andersen and Nybom2011) (PIC = 0.92 for 22 Southern African accessions), Kwon et al. (Reference Kwon, Oh, Yi, Kim, An, Yang, Ok and Shin2010) (PIC = 0.50 for 49 commercial watermelon cultivars) and Zhang et al. (Reference Zhang, Fan, Guo, Ren, Gong, Zhang, Weng, Davis and Xu2016) (PIC = 0.49 for 1197 accessions belonging to seven Citrullus species), Singh et al. (Reference Singh, Singh, Sandhu and Chunneja2017) (PIC = 0.46 for 88 accessions belonging to three Citrullus species). However, our results corroborate with the PIC value observed by Nantoume et al. (Reference Nantoume, Andersen and Jensen2013) (PIC = 0.35 for 134 landraces from Mali) and Munisse et al. (Reference Munisse, Jensen and Andersen2013) (PIC = 0.34 for 96 genotypes from Mozambique). Among various factors, the number and source of genotypes under study and the level of polymorphism of the microsatellite markers, have the greatest impact on the magnitude of PIC. Though there are several studies on genetic diversity of watermelon, the current study includes the largest panel size only after Zhang et al. (Reference Zhang, Fan, Guo, Ren, Gong, Zhang, Weng, Davis and Xu2016) and the largest panel of Indian accessions ever studied.
Population structure analysis
Insights into the genetic diversity and structure of germplasm panel are crucial for the successful deployment and efficient management of the genetic stocks (Li et al., Reference Li, Schulz and Stich2010). The predominance of the exotic and Indian accessions into statistically distinct subpopulations (online Supplementary Table S3) indicated that the evolution of the exotic and Indian landraces is parallel and largely unrelated to each other. However, among the Indian inbreds, the preponderance of C. lanatus and C. mucospermus into different subpopulations indicated a clear distinction between these two species, though they were reported to be taxonomically close to each other (Guo et al., Reference Guo, Zhang, Sun, Salse, Lucas, Zhang, Zheng, Mao, Ren, Wang, Min, Guo, Murat, Ham, Zhang, Gao, Huang, Xu, Zhong, Bombarely, Mueller, Zhao, He, Zhang, Zhang, Huang, Tan, Pang, Lin, Hu, Kuang, Ni, Wang, Liu, Kou, Hou, Zou, Jiang, Gong, Klee, Schoof, Huang, Hu, Dong, Liang, Wang, Wu, Xia, Zhao, Zheng, Xing, Liang, Huang, Lv, Wang, Yin, Yi, Li, Wu, Levi, Zhang, Giovannoni, Wang, Li, Fei and Xu2013; Renner et al., Reference Renner, Sousa and Chomicki2017). Both Pop II-A and Pop II-B predominantly included C. mucospermus genotypes (online Supplementary Table S2), however, these populations were statistically distinct (Table 3), indicating a genetic distinction among the accessions within the same species.
Across subpopulations, the magnitude of observed heterozygosity was less than the corresponding expected heterozygosity/gene diversity. This implies that inbreeding has happened among the individuals during the process of their evolution and/or domestication. Among the five sub-populations, Pop I-B (with 90.90% Indian accessions); comprised of C. lanatus (58.18%), C. colocynthis (40%) and C. mucospermous (1.82%) accessions; recorded maximum value for the average number of alleles (2.5652), maximum gene diversity (0.4184) and maximum PIC (0.6396), implying presence of greater genetic diversity among the genotypes (Table 2). However, Zhang et al. (Reference Zhang, Fan, Guo, Ren, Gong, Zhang, Weng, Davis and Xu2016) reported low values for gene diversity (0.30), heterozygosity (0.03) and PIC (0.26) for the East-Asian genotypes including 51 Indian accessions and found those parameters to be highest in the subpopulation dominated by the American ecotypes. Nimmakayala et al. (Reference Nimmakayala, Abburi, Bhandary, Abburi, Vajja, Reddy, Malkaram, Venkatramana, Wijeratne, Tomason, Levi, Wehner and Reddy2014) grouped both East-Asian and American ecotypes into a single group while studying 130 accessions of cultivated watermelon. These minor quantitative discrepancies observed in various studies might be because of the sampling size and source of genotypes used. Overall, the current study employing a larger sample size of 213 accessions is more representative of the available variability of the region and hence recording higher diversity and PIC values in populations (Pop I-B and Pop I-C) predominated by the Indian accessions when compared to earlier studies. In the present study, the grouping of the genotypes belonging to C. lanatus (32) and C. colocynthis (22) in Pop I-B confirms their genetic closeness to each other. Earlier, Mahla et al. (Reference Mahla, Singh and Roy2014) reported free gene flow between these two species resulted in the development of several intermediate forms in India. We found 19 accessions from overall, 131 from Pop I and eight from Pop II belonging to the admixture group with partial ancestry from more than one genetic background which might have resulted from the complex evolutionary process involving intercrossing and gene flow between different taxa. The results indicate a probable advantage in the deployment of these adapted Indian landraces in the watermelon breeding programmes to increase the fitness value. One such example is a mega variety, Arka Manik, developed at ICAR-IIHR, Bangalore during the 1980s. It was derived from a cross between IIHR-21, which is a local collection from Jahajpur, Rajasthan, India and an American cultivar Crimson Sweet. This variety is recorded to possess resistance against downy mildew, powdery mildew and anthracnose, giving it a wide range of adaptability and is still being commercially cultivated after three decades of its release.
Formulation of the core set
The formulated Indian core collection is comprised of 46 accessions belonging to three different species viz., C. lanatus (29), C. colocynthis (14) and C. mucospermus (3). The size of the core set (n = 46/194), i.e. 23.71% of the entire Indian inbred-collection used, which is slightly higher than the general size of core collections (10%) of the crop plants (Agrama et al., Reference Agrama, Yan, Lee, Fjellstrom, Chen, Jia and McClung2009). This may be because of the collection of the accessions from the wild without much human intervention or due to a small base panel. Zhao et al. (Reference Zhao, Cho, Ma, Chung, Gwag and Park2010) also concluded that accessions of wild species or landraces are richer in terms of allele frequency as compared to commercially bred varieties. Therefore, accessions belonging to different species included in our study might have widened the size of the core collection to ensure 100% allelic coverage.
Watermelon is not native to India. However, considerable diversity exists in various pockets of the country to be treated as a secondary centre of diversity. Our study signifies the importance of this diversity in the well-adapted landraces which can be used for broadening the genetic base to improve the adaptive value of the modern-day improved varieties that otherwise have a narrow genetic base. The developed core collection would ease in maintenance of the diversity present among indigenous Citrullus sp. accessions; would ease trait search while exploring Indian diversity and can also be used as a base panel for association mapping. Core collections from different countries of diversity for this crop can be pooled to form a global core. Such a global core would help in understanding trait diversity in entirety aiding in successful deployment in breeding programmes.
Supplementary material
The supplementary material for this article can be found at https://doi.org/10.1017/S1479262120000386.
Acknowledgements
The first author acknowledges the University Grants Commission, Ministry of Human Resource Development, Government of India, for granting fellowship for PhD programme and the authors acknowledge Indian Council of Agricultural Research, New Delhi for funding the programme entitled ‘CRP on Agrobiodiversity’.
Author contributions
ESR, DCLR and CDP conceived and designed the experiments. MR and RNT carried out the phenotypic evaluation. SP performed the genotyping and statistical analysis with assistance from ESR and DCLR. SP and ESR wrote the manuscript. BV made necessary corrections. All the authors discussed the results and commented on the manuscript.
Conflict of interest
The authors declare that there is no conflict of interest. The authors also declare that the manuscript has neither been submitted nor under consideration elsewhere. All authors have read and commented on the manuscript. This article does not contain any studies with human participants or animals performed by any of the authors.


