


Obsessive-compulsive disorder (OCD) is a psychiatric disorder characterized by recurrent, intrusive, and persistent thoughts (obsessions) and/or urges or impulses (compulsions), associated with marked distress (American Psychiatric Association, 2013; Eisen et al., Reference Eisen, Mancebo, Pinto, Coles, Pagano, Stout and Rasmussen2006; Menzies et al., Reference Menzies, Achard, Chamberlain, Fineberg, Chen, Del Campo and Bullmore2007). One predominant psychological model of OCD is the cognitive-behavioral one, which emphasizes the role of catastrophic appraisals of naturally occurring intrusive thoughts (e.g. Salkovskis & Warwick, Reference Salkovskis and Warwick1985). Findings supporting this model, however, are often inconsistent and do not unequivocally show dysfunctional cognition to be etiologically related to OCD (Anholt & Kalanthroff, Reference Anholt and Kalanthroff2013; Kalanthroff, Anholt, & Henik, Reference Kalanthroff, Anholt and Henik2014; Tibi et al., Reference Tibi, van Oppen, van Balkom, Eikelenboom, Hendriks and Anholt2018). Therefore, in recent years, researchers have become increasingly interested in executive dysfunctions – particularly, response inhibition – as factors potentially underlying OCD symptoms (Bannon, Gonsalvez, Croft, & Boyce, Reference Bannon, Gonsalvez, Croft and Boyce2002; Chamberlain, Fineberg, Blackwell, Robbins, & Sahakian, Reference Chamberlain, Fineberg, Blackwell, Robbins and Sahakian2006; Linkovski, Kalanthroff, Henik, & Anholt, Reference Linkovski, Kalanthroff, Henik and Anholt2013; Morein-Zamir et al,. 2016; Penades et al., Reference Penades, Catalan, Rubia, Andres, Salamero and Gasto2007). Response inhibition is the ability to suppress irrelevant actions in order to voluntarily select goal-directed responses (e.g. Luna, Padmanabhan, & O'Hearn, Reference Luna, Padmanabhan and O'Hearn2010; Verbruggen & Logan, Reference Verbruggen and Logan2008). However, results regarding response inhibition in OCD have also been inconsistent (Abramovitch, Abramowitz, & Mittelman, Reference Abramovitch, Abramowitz and Mittelman2013; Kalanthroff, Henik, Simpson, Todder, & Anholt, Reference Kalanthroff, Henik, Simpson, Todder and Anholt2017; Krishna et al., Reference Krishna, Udupa, George, Kumar, Viswanath, Kandavel and Reddy2011; Roth et al., Reference Roth, Saykin, Flashman, Pixley, West and Mamourian2007). One potential explanation for these inconsistencies is that successful inhibition of responses may not only depend on the ability to withhold the performance of responses but may also depend on the strength of the response itself (Logan & Cowan, Reference Logan and Cowan1984; Verbruggen, McLaren, & Chambers, Reference Verbruggen, McLaren and Chambers2014). Therefore, the difficulty in inhibiting behaviors in OCD may result from a more intense initiation of responses.
Consistently, we have recently demonstrated that OCD is associated with enhanced action tendencies in response to external stimuli expressed by increased motor preparation. This was indicated by an event-related potential (ERP) component known as the readiness potential (Dayan, Berger, & Anholt, Reference Dayan, Berger and Anholt2014; 2017). Enhanced action tendencies were demonstrated both in participants with high compared to low OC symptoms (Dayan et al., Reference Dayan, Berger and Anholt2014), as well as in participants with OCD compared with healthy controls (Dayan, Berger, & Anholt, Reference Dayan, Berger and Anholt2017). Importantly, results of both studies indicated that these group differences were enhanced in response to negatively valenced stimuli and were not explained by levels of anxiety or depression (Dayan et al., Reference Dayan, Berger and Anholt2014, 2017).
Another relevant variable that could affect action tendencies in OCD are the stimulus–response associations that particular stimuli evoke. In real-life, compulsive behavior is often triggered by external stimuli associated with a specific prepotent response (e.g. gas rings, door knobs, etc.; Bannon et al., Reference Bannon, Gonsalvez, Croft and Boyce2002). Whether OCD patients indeed differ from controls in the motor-preparation processes elicited by stimuli associated with strong automatic responses has not yet been explored. One theory that may be particularly useful in understanding such responses is Gibson's theory of Affordances (Gibson, Reference Gibson1979). Gibson suggested that we perceive not only the physical properties of an object but its use as well, and this activation was suggested to require very little cognitive effort (Gibson, Reference Gibson1979). Stimuli that are frequently associated with a specific action may evoke stronger affordances, and in turn, greater action tendencies. Indeed, certain stimuli are associated with, and therefore, evoke specific actions; these are termed stimulus-driven behaviors (Allport & Wylie, Reference Allport, Wylie, Monsell and Driver2000; Monsell, Reference Monsell2003; Rogers & Monsell, Reference Rogers and Monsell1995). In a recent study, OCD patients showed impaired task control, which is the ability to suppress these stimulus-driven actions (Kalanthroff et al., Reference Kalanthroff, Henik, Simpson, Todder and Anholt2017). Moreover, OCD patients have been shown to demonstrate greater relative activation of the supplementary motor area during high conflict compared to low conflict (i.e. incongruent v. congruent condition) relative to controls (Yücel et al., Reference Yücel, Harrison, Wood, Fornito, Wellard, Pujol and Pantelis2007). However, no studies to date have yet investigated whether conflict between actions is associated with stronger action tendencies in OCD. Therefore, the present study investigated whether OCD patients would demonstrate increased action tendencies when responses required the suppression of strong automated responses, i.e. to a stimulus with a stronger affordance.
The Stroop task (Stroop, Reference Stroop1935) measures the influence of stimulus-driven responses on enhanced action tendencies by requiring a task-relevant dimension to be identified and acted upon while ignoring a task-irrelevant dimension (Liu, Banich, Jacobson, & Tanabe, Reference Liu, Banich, Jacobson and Tanabe2004). In the Stroop task, responses are typically faster when the task-irrelevant and task-relevant aspects of the stimulus overlap, namely, the congruent condition, compared to the case when they do not overlap, namely, the incongruent condition (MacLeod, Reference MacLeod1991; Proctor & Reeve, Reference Proctor, Reeve, Proctor and Reeve1990; Stroop, Reference Stroop1935). A specific variant of the Stroop task is the Arrow Stroop task, in which the compatibility of the spatial component of the stimuli (i.e. arrow direction) and the graphic component of the stimuli requiring a response (i.e. color of the arrow) are manipulated (Hajcak, McDonald, & Simons, 2003). Because the spatial aspects of the stimuli used in this task imply actions and exert large affordance effects (McBride, Boy, Husain, & Sumner, Reference McBride, Boy, Husain and Sumner2012; Tipper, Paul, & Hayes, Reference Tipper, Paul and Hayes2006), the Arrow Stroop Task variation in the present study presents participants with the need to override or suppress a strong association between the stimulus and the automatic response associated with it. Therefore, this task is particularly suitable for examining the ability to suppress strong response tendencies in OCD. Evidence suggests that the conflict in the Stroop effect is resolved at response-related stages (Lu & Proctor, Reference Lu and Proctor1995; Umiltá & Nicoletti, Reference Umiltá and Nicoletti1990). The automatic response activation triggered by the stimulus should be reflected in the lateralized readiness potential (LRP) component. The LRP component reflects electrical activity from right and left motor cortices that is larger in the contralateral hemisphere to the responding hand and serves as an indicator of hand-motor response preparation (de Jong, Wierda, Mulder, & Mulder, Reference de Jong, Wierda, Mulder and Mulder1988; Gratton, Coles, Sirevaag, Eriksen, & Donchin, Reference Gratton, Coles, Sirevaag, Eriksen and Donchin1988; Luck & Kappenman, Reference Luck and Kappenman2011; Vaughan, Costa, & Ritter, Reference Vaughan, Costa and Ritter1968).
Because the Arrow Stroop task examines the ability to suppress strong response tendencies, it might further involve mechanisms of inhibition needed to override a prepotent response in the incongruent condition. Therefore, another relevant component for understanding mechanisms of action tendencies under response conflict is the N2 component. The N2 is a negative component peaking at about 200–300 ms post stimulus presenting at centrofrontal scalp sites (Folstein & Van Petten, Reference Folstein and Van Petten2008). The N2 is considered to represent top-down cognitive processes such as conflict control and cognitive inhibition and is specifically relevant because it mirrors obsessional symptomology in OCD (Ciesielski et al., Reference Ciesielski, Rowland, Harris, Kerwin, Reeve and Knight2011; Riesel, Klawohn, Kathmann, & Endrass, Reference Riesel, Klawohn, Kathmann and Endrass2017). Although various studies reported a reduction in N2 amplitude in OCD (e.g Keskin-Ergen et al., 2014; Kim, Kim, Yoo, & Kwon, Reference Kim, Kim, Yoo and Kwon2007), others did not find evidence of such a reduction and even demonstrated enhancement in the N2 amplitude (e.g. Ciesielski et al., Reference Ciesielski, Rowland, Harris, Kerwin, Reeve and Knight2011; Ruchsow et al., Reference Ruchsow, Reuter, Hermle, Ebert, Kiefer and Falkenstein2007). Such conflicting literature regarding N2 in OCD is perhaps due to task characteristics and motivational factors (Riesel et al., Reference Riesel, Klawohn, Kathmann and Endrass2017). The literature regarding the N2 component regarding compatibility and congruency manipulations in healthy populations conclusively points to a stronger N2 under cognitive conflict (Folstein & Van Petten, Reference Folstein and Van Petten2008; Qiu, Luo, Wang, Zhang, & Zhang, Reference Qiu, Luo, Wang, Zhang and Zhang2006).
In this study, we tested the hypothesis that participants with OCD would present with increased action tendencies and a differential pattern of inhibition during conflict, when responses required disregarding stimuli associated with strong affordances (as manifested by the incongruent trials in the Stroop task). We tested these hypotheses using the LRP and N2 components and source localization analyses. Based on our previous findings (Dayan et al., Reference Dayan, Berger and Anholt2014, 2017), we expected OCD participants to exhibit greater LRP compared to healthy controls. Further, based on research indicating that OCD patients have a higher sensitivity to conflict (van Veen & Carter, Reference van Veen and Carter2002), we expected OCD participants to exhibit greater LRP and slower reaction time (RT) in the incongruent condition compared to healthy controls.
Additionally, because OCD is highly comorbid (Simon et al., Reference Simon, Otto, Wisniewski, Fossey, Sagduyu, Frank and Pollack2004), psychopathology was assessed to ensure that results were not explained by symptoms other than OCD. Regarding the Stroop effect, consistent with extensive literature, we expected that all participants would exhibit faster RTs and lower error rates (ERs) in the congruent condition compared to the incongruent one.
Methods
Participants and questionnaires
This study involved 76 undergraduate students (mean age = 23.87 years; s.d. = 1.48; 58 females and 18 males) who received course credit or a small monetary compensation for their participation. An invitation was sent via email to 550 undergraduate students asking them to complete an online questionnaire that assessed OCD symptoms [Obsessive-Compulsive Inventory-Revised (OCI-R); Foa et al., Reference Foa, Huppert, Leiberg, Langner, Kichic, Hajcak and Salkovskis2002]. The ad stated that participants might then be invited to the lab to participate in further research on OCD. Out of 550 students who received the invitation for participation via e-mail, about 500 completed the online questionnaire, which represents a 91% response rate; 150 participants exceeding the OCI-R cut off score of 21 (suggestive of a possible OCD diagnosis) and 70 participants with an OCI-R below a cut-off score of 21 (suggestive of an unlikely OCD diagnosis) were invited to participate. Participants underwent a clinical interview by a clinical psychology graduate student under the supervision of an OCD expert (GEA), using the Mini International Neuropsychiatric Interview (M.I.N.I.), a structured clinical diagnostic interview based on DSM-V (Sheehan et al., Reference Sheehan, Janavs, Baker, Harnett-Sheehan, Knapp, Sheehan and Lepine1998). A score of 21 on the OCI-R was set as the cut-off score for inviting subjects with suspected OCD for clinical interviews as this is the recommended cut-off score, with scores at or above this level indicating the likely presence of OCD (Foa et al., Reference Foa, Huppert, Leiberg, Langner, Kichic, Hajcak and Salkovskis2002). OCD symptoms were evaluated using the Yale-Brown Obsessive Compulsive Scale (Y-BOCS; Goodman et al., Reference Goodman, Price, Rasmussen, Mazure, Fleischmann, Hill and Charney1989). Participants were diagnosed as having OCD if they met the OCD criteria on the M.I.N.I. and had a Y-BOCS score greater than 16 (this is the recommended cut-off score), with scores at or above this level indicating moderate, severe or extreme OCD (Goodman et al., Reference Goodman, Price, Rasmussen, Mazure, Fleischmann, Hill and Charney1989). Participants with OCI-R scores lower than 21 were admitted to the control group after screening for OCD or any other psychopathology. Exclusion criteria included self-reported history of neurological disorders, current use of medication, learning disabilities, head injury and left-hand dominance. The study was approved by the Helsinki Ethics Board of Soroka University Medical Center and the Ethics Committee of the Ben-Gurion University of the Negev Psychology Department. All participants willingly signed informed consent forms and were debriefed at the end of the experiment.
The OCD group consisted of 6 male and 32 female participants (mean OCI-R score = 34.135, s.d. = 10.594, range: 10–64; mean Y-BOCS score = 20.23, s.d. = 4.023, range: 13–29). It is important to note that these OCI-R scores accord with other studies and are suggestive of a relatively high percentage of college students with OCD (Sulkowski, Mariaskin, & Storch, Reference Sulkowski, Mariaskin and Storch2011). The control group was composed of 12 male and 26 female participants (mean OCI-R score = 13.816, s.d. = 8.917, range: 0–21). The groups differed significantly in OCI-R score, t(74) = 9.165, p = 0.000. The groups did not differ in age, intelligence (measured via self-reported psychometric grade performed as an acceptance criterion for college admission) or gender, t(74) = 0.154, p = 0.878; t(74) = 1.188, p = 0.239; χ2(1) = 2.621, p = 0.106, respectively. Participants' trait anxiety was evaluated using the State Trait Anxiety Inventory (STAI; Spielberger, Reference Spielberger1983) and the Beck Depression Inventory (BDI; Beck, Ward, & Mendelson, Reference Beck, Ward and Mendelson1961). The M.I.N.I. was further used to exclude participants with psychopathology from the OCD and control groups. Although anxiety and depression comorbidities were excluded from the sample, the OCD group maintained increased levels of anxiety and depression relative to the control group, t(74) = 3.937, p = 0.004; t(74) = 9.474, p = 0.002, respectively. For complete demographic data see Table 1.
Table 1. Demographic data for the OCD and control group
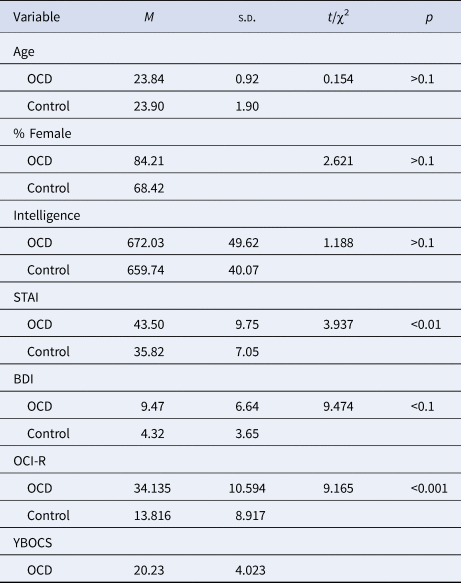
Note: N = 38 in each group, M = mean, s.d. = standard deviation.
Experimental tasks and procedures
Participants performed a variation of the Stroop task, namely, the Arrow Stroop task, where the stimuli were presented in a continuous stream, and participants made a binary decision for each stimulus with both outcomes requiring a motor response. To assess motor preparatory processes for reactions, the task included a dual-choice that employed key-press responses using both the right and left hands. The task involved arrows of two different colors, appearing sequentially at the center of the screen. Each of the two arrow colors was indicative of a different required response, such that a green colored arrow indicated that a left key response was needed, and a purple colored arrow indicated that a right key response was needed. The response required for each color varied randomly – yet equally – between a participants and groups (e.g. sometimes a participant was allocated a ‘press right for green’ condition and sometimes a ‘press right for purple’ condition). The arrows randomly appeared pointing to the right or the left of the screen, creating two experimental conditions: congruent and incongruent. A congruent trial in the ‘press right for green’ condition was therefore composed of a green arrow pointing right or a purple arrow pointing left, and an incongruent trial was composed of a green arrow pointing left or a purple arrow pointing right. Subjects were asked to respond as quickly and as accurately as possible because accuracy and RTs were measured for each event.
Following a short practice block, participants completed two blocks, each including 225 congruent trials and 75 incongruent ones, according to common Stroop methodology (see Kane & Engle, Reference Kane and Engle2003). Participants were asked to focus on the screen throughout the entire experiment. In each experimental trial, participants were presented with a sequence of colored arrows at the center of a black screen, pointing either left or right. Participants were instructed to respond with a left or right key press according to the color of the arrow while ignoring the direction the arrow was pointing (see Fig. 1). Each trial was composed of a fixation cross presented for 500 ms, followed by the arrow stimulus presented in the center of the screen for 200 ms. Following each stimulus presentation, subjects were presented with a black screen for a randomly varying interval ranging between 1000 and 1500 ms during which they had to respond (based on the arrow color) with a key press. The size of the arrows was 3.625 × 2.625 cm, allowing for a 2.6° visual angle when seen by the subject sitting approximately 80 cm from the screen in a relatively dark room.
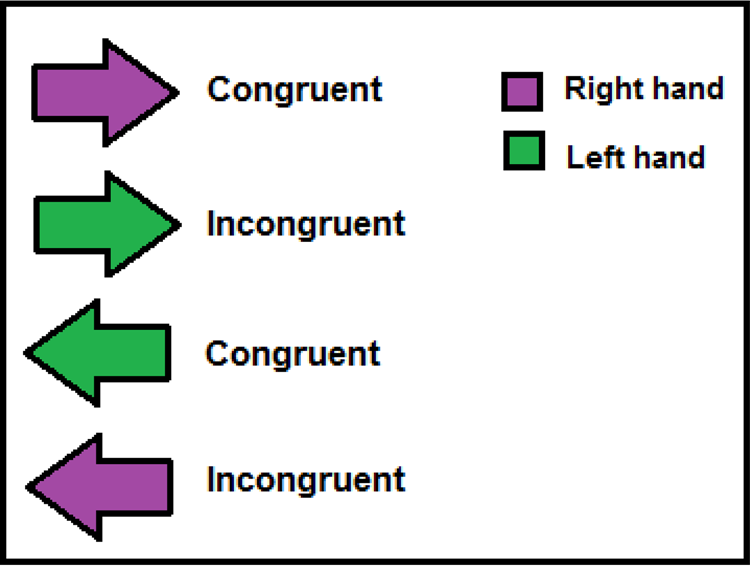
Fig. 1. Example of the experimental stimuli in the Arrow Stroop task.
Experimental set-up, data acquisition, and preprocessing
The experiment was programed using E-prime v1.1 software (Schneider, Eschman, & Zuccolotto, Reference Schneider, Eschman and Zuccolotto2002), adapted to the EGI Netstation version 4.5. Visual displays were generated by a Dell computer attached to a 17″ CRT monitor, using a 1024 × 768 resolution graphic mode. All responses were collected using a button-press response box. The duration of the entire experimental session was approximately 1 h per subject.
Continuous electroencephalogram (EEG) data were recorded using a Geodesic Sensor Net (V2.1; Electrical Geodesic, Inc., Eugene, OR) – comprised of 128 electrodes evenly distributed across the scalp – while participants performed the Arrow Stroop Task. A 0.1–100 Hz band-pass filter was used, and the EEG signal was digitized at a 250 Hz sampling rate with a 24-bit A/D converter. EEG data were referenced during data acquisition to the vertex and were then re-referenced offline to a polar average reference effect (PARE)-corrected average reference. This method of estimation was used to compensate for the PARE (Junghoefer, Elbert, Tucker, & Braun, Reference Junghoefer, Elbert, Tucker and Braun1999), which is caused by an uneven surface sample. Using this method, spherical spline interpolation was performed to estimate the voltage of the surface not covered by electrodes. The value of the average reference was then computed for the entire surface of the head, resulting in a more accurate reference. EEG data were processed offline using Netstation 4.5 (Electrical Geodesics Inc., Eugene, OR) and segmented into stimuli-synchronized epochs, which were extracted at 200 ms before (baseline) until 800 ms poststimulus onset. The EEG signal was subjected to a low-pass digital filtering of 30 Hz prior to ERP derivation to ensure that electrical main noise did not affect the data, while losing as little signal as possible.
Resulting segments were subjected to a bad channel and eye blink or movement detection procedure followed by visual verification. Channels were marked as bad if they contained a Max–Min difference higher than 150 μV. Eye blinks, eye movements, and EEG comprising artifacts were removed from further analyses based on a criterion of Max–Min >150 μV, Max–Min >100 μV, and Max–Min >150 μV, respectively. Segments in which any eye activity was detected or containing 10 or more bad channels were discarded. A subject having an insufficient number of artifact-free trials was removed from the ERP statistical analyses. This happened for five participants (four from the OCD group and one from the control group). These data contained a high percentage of trials that remained after the cleaning phase (an average of 96.7%). No significant interaction effect was found between group (OCD v. control) and congruency (congruent v. incongruent) for the artifact-free trial percentages, F 1, 74 = 0.400, p = 0.531. Further, these percentages did not differ between groups, F 1, 74 = 0.270, p = 0.606, or conditions, F 1, 74 = 0.040, p = 0.847. No significant correlations were found between the artifact-free trial percentages and the OCI-R scores in either of the groups (OCD and control) nor in either condition (congruent v. incongruent): for the OCD group under the Congruent condition and Incongruent condition, respectively: r(38) = −0.017, p = 0.921; r(38) = 0.010, p = 0.954; for the Control group under the Congruent condition and Incongruent condition, respectively: r(38) = 0.166, p = 0.320; r(38) = 0.162, p = 0.331. The methodology used in the present study was in accordance with recently published guidelines and recommendations used for studies using EEG (Keil et al., Reference Keil, Debener, Gratton, Junghöfer, Kappenman, Luck and Devrim-Üçok2014).
The clean ERP segments of correct responses, for the responding and nonresponding hands were stimulus locked (measured relative to the moment the eliciting stimulus appeared) and averaged according to the different experimental conditions. The time window for the LRP component was preselected based on previous research (Eimer, Reference Eimer1998; Luck & Kappenman, Reference Luck and Kappenman2011; Mordkoff & Gianaros, Reference Mordkoff and Gianaros2000) and inspection of the ERP grand averages. Accordingly, the LRP component was calculated (between 200 and 550 ms following stimulus onset) as the mean negative amplitude measure (in μV) of all correct response segments. Relying on previous literature (Eimer, Reference Eimer1998; Luck & Kappenman, Reference Luck and Kappenman2011; Mordkoff & Gianaros, Reference Mordkoff and Gianaros2000), the LRP was examined over bilateral parietal sites collapsing across nine electrodes situated between the T3 and C3 electrodes of the 10–20 system for right-hand responses and nine electrodes situated between the T4 and C4 electrodes of the 10–20 system for left-hand responses. The LRP was calculated according to Coles (Reference Coles1989), using the reduction of left-hemisphere electrodes voltage from that of the right-hemisphere electrodes for left-hand movements and the opposite for right-hand movements. The resulting two difference waveforms were then averaged to form the final LRP component (Coles, Reference Coles1989; Eimer, Reference Eimer1998; Luck & Kappenman, Reference Luck and Kappenman2011; Mordkoff & Gianaros, Reference Mordkoff and Gianaros2000).
The time window for the N2 component was preselected based on previous research (Folstein & Van Petten, Reference Folstein and Van Petten2008; Luck & Kappenman, Reference Luck and Kappenman2011) and inspection of the ERP grand averages. Accordingly, the N2 component was calculated (between 150 and 350 ms following stimulus onset) as the mean negative amplitude measure (in μV) of all correct response segments. Relying on previous literature (Folstein & Van Petten, Reference Folstein and Van Petten2008; Luck & Kappenman, Reference Luck and Kappenman2011), the N2 was examined over centrofrontal sites collapsing across thirteen electrodes situated between the Cz and Fz electrodes of the 10–20 system.
Further analysis was performed on two other commonly analyzed and relevant components – the P300 and P100 – to rule out their effect on the expected results. The time windows for the P300 and P100 components were preselected based on previous research (Luck & Kappenman, Reference Luck and Kappenman2011) and inspection of the ERP grand averages. Accordingly, the P300 and P100 components were calculated (between 200 and 500 ms and 80 and 130 ms, respectively, following stimulus onset) as the mean positive amplitude measure (in μV) of all correct-response segments. Relying on previous literature (Luck & Kappenman, Reference Luck and Kappenman2011), the P300 was examined over centroparietal sites collapsing across 13 electrodes situated between the Pz electrode of the 10–20 system. The P100 was examined over centroparietal sites collapsing across 13 electrodes situated between the Pz electrode of the 10–20 system in accordance with previous research (Luck & Kappenman, Reference Luck and Kappenman2011).
EEG source imaging for the LRP and N2 components was derived using the standardized low resolution brain electromagnetic tomography (sLORETA; Pascual-Marqui, Reference Pascual-Marqui2002) and analyzed in the NetStation GeoSource 2.0 software package (EGI, Eugene, OR). This method assumes standard electrode locations provided by EGI and uses an isotropic Sun-Stok four-shell sphere head model, across 2447 dipoles distributed over the cortical surface with a resolution of 2 mm and relies on the Tikhonov regularization (1 × 10⁻⁴).
Statistical analysis methods
Data screening
Pearson correlations were calculated to evaluate potential covariates (trait anxiety, depression, intelligence, and age) for the ERP and behavioral measures. No such confounds were identified (i.e. no significant correlations).
Main analyses
Group differences (OCD and control) and congruency effects in the ERP (LRP and N2 components) and behavioral measures (RT and ER) were examined using repeated-measures analyses of variance (ANOVAs), and planned comparisons were performed for testing the a priori hypotheses within these ANOVAs. For the source localization analyses, an a-parametric bootstrap t test analysis was performed for each comparison, at each time point, with 300 iterations with significant confidence intervals (CIs) at p < 0.05 and marginal at p < 0.1. Further, to apply a more dimensional approach and to examine whether findings were specific to OCD, Pearson correlation analyses were conducted between all ERP measures and all clinical-symptom questionnaires. Because strong a priori hypotheses were held regarding this correlational directionality, one-tailed analyses were conducted. Because our statistical analyses did not involve a null hypothesis or a large number of tests carried out without preplanned hypotheses and were instead based on a priori hypotheses and two groups, we did not perform an adjustment for multiple comparisons (Armstrong, Reference Armstrong2014; Perneger, Reference Perneger1998).
In addition to the Null-Hypothesis Testing (NHT), we also employed Bayesian analyses (using JASP 0.10.0; JASP Team, 2018) to estimate the relative odds of H1 and H0 given our data and a priori hypothesis. We report BF10, the relative odds of H1 compared to H0, which enables accepting the null hypothesis, H0 (BF H1/H0 < 0.33; Jeffreys, Reference Jeffreys1998; Rouder, Speckman, Sun, Morey, and Iverson, Reference Rouder, Speckman, Sun, Morey and Iverson2009). This was employed because it can potentially help reach conclusions not only regarding the manipulation or group effects but also regarding the lack of effect in a specific condition or group. Because Bayesian analyses are not limited by the risk of alpha inflation, we were able to examine our a priori hypothesis regarding the group effect under the incongruent condition.
Results
Behavioral results
For RTs, a repeated-measures ANOVA revealed, as expected, a significant congruency effect, such that shorter RTs were seen for the congruent condition, M = 380.38 ± 65.79, compared to the incongruent one, M = 418.16 ± 74.28; F 1, 74 = 247.888, p < 0.0001, η p2 = 0.770, 95% CI (0.674, 0.825). Further, no significant interaction effect was found between group (OCD v. control) and congruency (congruent v. incongruent), F 1, 74 = 0.112, p = 0.739, and no significant difference in RT was found between the two groups (OCD and control), F 1, 74 = 2.320, p = 0.132. For accuracy (ER), a significant congruency effect was observed, such that lower ERs were seen for the congruent condition, M = 1.734 ± 1.636, compared to the incongruent one, M = 6.291 ± 4.510; F 1, 74 = 127.070, p < 0.0001, η p2 = 0.632, 95% CI (0.492, 0.718). Further, no significant interaction effect was found between group (OCD v. control) and congruency (congruent v. incongruent), F 1, 74 = 2.111, p = 0.151, and no significant difference was found between the two groups in ER, F 1, 74 = 1.467, p = 0.230.
ERP results
LRP
ERP data revealed a strong LRP for the responding hand over bilateral parietal areas corresponding to the motor cortex, indicating preparation to perform an action. A repeated-measures ANOVA revealed a significant main effect of group (OCD v. control), F 1, 74 = 4.06, p = 0.047, η p2 = 0.051, 95% CI (0–0.173). As expected, participants in the OCD group showed a significantly higher amplitude for the LRP component, M = −1.208 ± 3.096, than did participants in the control group, M = 0.061 ± 3.865. No significant interaction effect was found between group (OCD v. control) and congruency (congruent v. incongruent) F 1, 74 = 0.552, p = 0.459, and no significant congruency effect was observed, F 1, 74 = 2.591, p = 0.112. Further analyses revealed that group differences in the LRP amplitude were apparent under the incongruent condition and not under the congruent condition. Under the incongruent condition, the OCD group presented with a significantly larger LRP, M = −1.930 ± 4.033, compared to the control group, M = −0.327 ± 2.750. This phenomenon was indicated by a significant effect for the incongruent trials, F 1, 74 = 4.099, p = 0.046, η p2 = 0.052, 95% CI (0, 0.174); under the congruent condition, no significant effect was found, F 1, 74 = 0.615, p = 0.436 (see Fig. 2).

Fig. 2. (a) Grand average LRP waveforms time locked to the stimulus; electrodes situated over bilateral motor cortex scalp sites for the OCD group (solid red line for congruent trials and dashed dark red line for incongruent trials) and the control group (dashed green line for congruent trials and dotted dark green line for incongruent trials). (b) Topo map illustrating left parietal negativity in right-hand response trials in the OCD group under the incongruent condition. (c) LRP amplitude group and congruency effects.
The Bayesian analysis results indicated decisive support for the predicted hypothesis of a larger LRP for the OCD group compared to the control group under the incongruent condition (BF10 = 8.729). Conversely, under the congruent condition, no such group effect was found, with a result that allows us to accept the null hypothesis, H0 (BF10 = 0.209). These results support and provide cumulative strength to our reported NHT.
No significant interaction effect was found for the nonresponding hand between group (OCD v. control) and congruency (congruent v. incongruent), F 1, 74 = 0.174, p = 0.678, and no effect was found for group, F 1, 74 = 2.399, p = 0.126 or congruency, F 1, 74 = 0.026, p = 0.871.
N2
ERP data further revealed a strong N2 over centrofrontal areas. A repeated-measures ANOVA revealed a significant interaction effect between group (OCD v. control) and congruency (congruent v. incongruent) as expected, F 1, 74 = 10.133, p = 0.002, η p2 = 0.121, 95% CI (0.017–0.262). No significant group or congruency effect was observed, respectively: F 1, 74 = 0.008, p = 0.931; F 1, 74 = 0.009, p = 0.923. Further analyses revealed significant simple effects for congruency in each of the groups. The OCD group presented with a significantly larger N2 under the congruent condition, M = −0.204 ± 0.310, compared to the incongruent condition, M = 0.101 ± 0.272. (F 1, 74 = 5.38, p = 0.023, η p2 = 0.068, 95% CI (0–0.196), whereas the control group presented with a significant yet reverse effect, such that a significantly larger N2 was observed under the incongruent condition, M = −0.161 ± 0.272, compared to the congruent condition, M = 0.126 ± 0.310 [F 1, 74 = 4.763, p = 0.032, η p2 = 0.061, 95% CI (0–0.186), see Fig. 3].
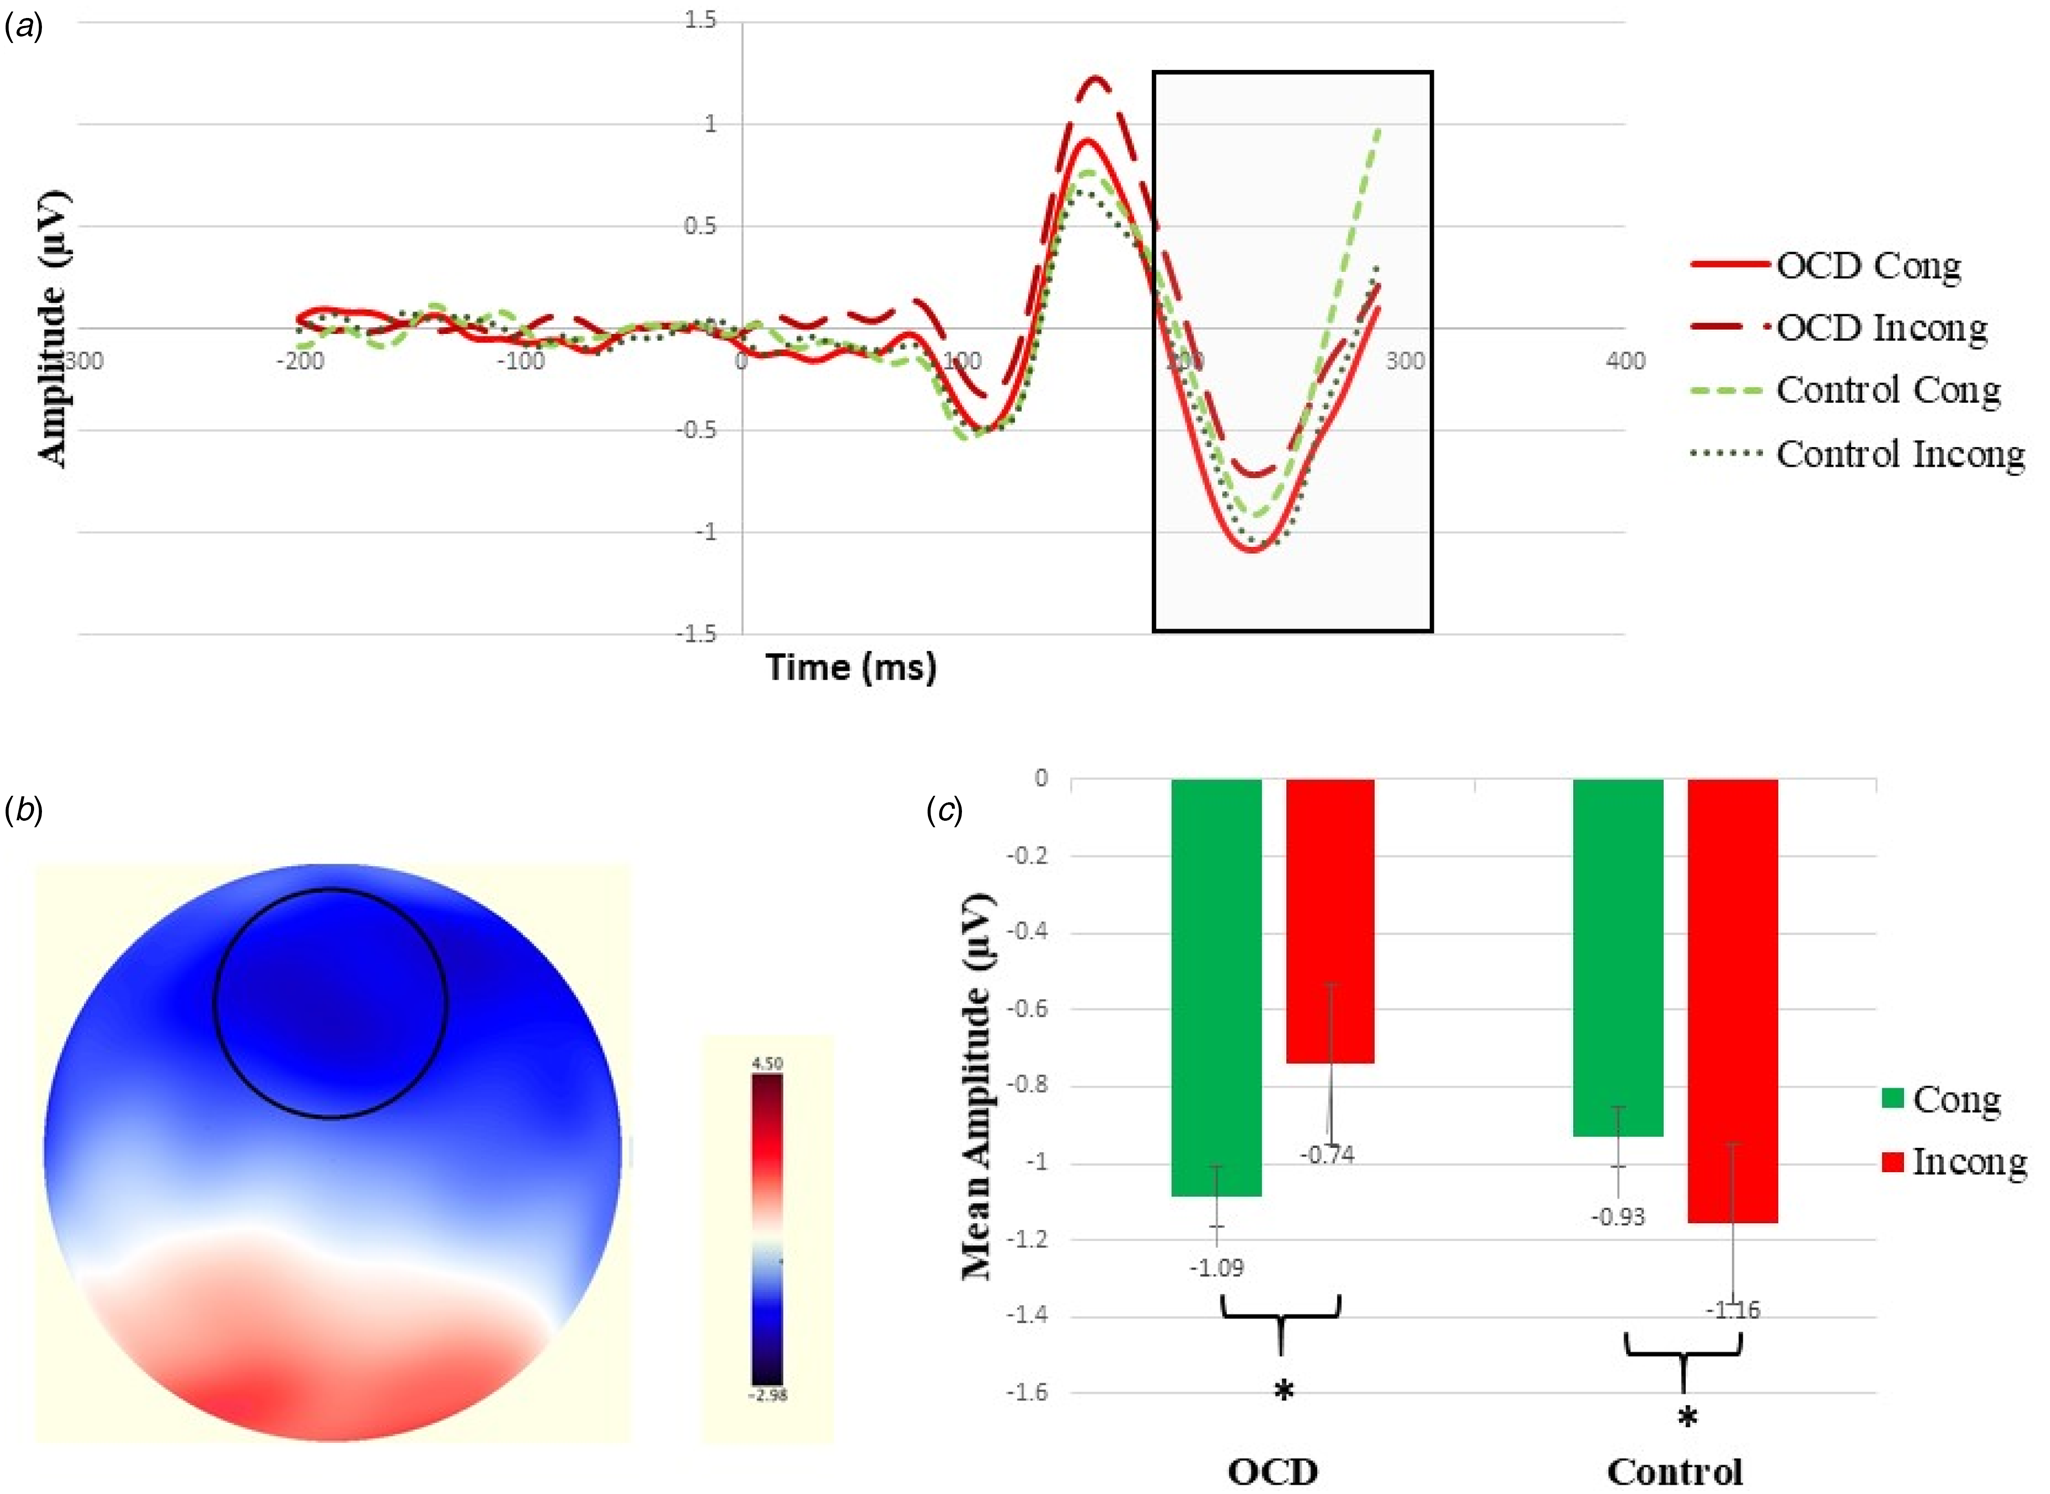
Fig. 3. (a) Grand average N2 waveforms time locked to the stimulus; electrodes situated over centrofrontal scalp sites for the OCD group (solid red line for congruent trials and dashed dark red line for incongruent trials) and the control group (dashed green line for congruent trials and dotted dark green line for incongruent trials). (b) Topo map illustrating centrofrontal negativity in the OCD group under the congruent condition. (c) N2 amplitude group and congruency effects.
Additional analyses
No significant interaction effect for latency was found between group (OCD v. control) and congruency (congruent v. incongruent) for the LRP or N2, respectively, F 1, 74 = 0.120, p = 0.725; F 1, 74 = 1.583, p = 0.212. Further, no significant group effect was observed for the LRP or N2, respectively, F 1, 74 = 0.230, p = 0.634; F 1, 74 = 0.121, p = 0.729, and no significant congruency effect was observed for the LRP and N2 respectively, F 1, 74 = 0.560, p = 0.455; F 1, 74 = 1.918, p = 0.170.
Further analysis regarding other commonly analyzed and relevant components, the P300 and P100, yielded no significant effects. No significant interaction effect for was found between group (OCD v. control) and congruency (congruent v. incongruent) for the P300 or P100, respectively, F 1, 74 = 0.506, p = 0.479; F 1, 74 = 0.166, p = 0.685. Further, no significant group effect was observed for the P300 or P100, respectively, F 1, 74 = 0.037, p = 0.848; F 1, 74 = 0.050, p = 0.824, and no significant congruency effect was observed for the P300 or P100 respectively, F 1, 74 = 1.648, p = 0.203; F 1, 74 = 0.880, p = 0.351.
Source localization
The segmented ERP data were computed into sLORETA time series of intracortical electrical activity in four regions of interest (ROI; three for the LRP component and one for the N2 component). The ROIs that were chosen correspond to cortical and subcortical areas relevant for the analyzed components based on current literature, and each ROI value consisted of the current source analysis from the ROI core coordinates and several voxels surrounding it averaged together. An a-parametric bootstrap t test analysis was then performed for each of the four ROIs, with significant CIs at p < 0.05 and marginal at p < 0.1.
The source analysis results revealed several cortical and subcortical source activations that likely contributed to the LRP differences. At the cortical level, strong activation was apparent in areas corresponding to the motor cortex (BA4) and pre- and supplementary motor cortex (pre-SMA, SMA; BA6) on the hemisphere contralateral to the responding hand. At the subcortical level, strong activation was apparent in basal ganglia areas, specifically the putamen and claustrum, on the hemisphere contralateral to the responding hand. The a-parametric bootstrap t test analysis showed activation in all three ROIs in these cortical and subcortical areas to be significantly stronger under the incongruent condition compared to the congruent one in the OCD group (see Fig. 4).

Fig. 4. (a) MRI images for the OCD group, showing the source activity, localized at the motor cortical areas at 600 ms, with coordinates set at 74, 95, 141. (b) Corresponding ROI activations (in nanoamperes) for the LRP plotted for scalp voltages estimated based on the sLORETA algorithm (Pascual-Marqui, Reference Pascual-Marqui2002), for cortical areas corresponding to BA4 (motor cortex) and BA6 (supplementary and premotor areas) for the OCD and control group. (c) MRI images for the OCD group, showing the source activity, localized at the basal ganglia areas at about 500 ms, with coordinates set at 59, 105, 80. (d) Corresponding ROI activations (in nanoamperes) for the LRP plotted for scalp voltages estimated based on the sLORETA algorithm (Pascual-Marqui, Reference Pascual-Marqui2002), for subcortical areas corresponding to the putamen and claustrum. ROIs for the MRI images are represented by the white circles. Colors represent power in (nanoamperes), with red being the lowest scale and yellow being the highest. L, left hemisphere; R, right hemisphere; BA, approximate Brodmann area; time points for which the differences are significant are plotted in purple (p < 0. 05) and green (p < 0.1) dots below the line graphs.
The source analysis results further revealed several cortical and subcortical source activations that likely contributed to the N2 differences. Strong activation was apparent in areas corresponding to the inferior frontal gyrus (BA45). The a-parametric bootstrap t test analysis was performed for the ROI, and revealed differential activation in these areas for the OCD and control groups; the OCD group presented with a significantly larger activation under the congruent condition compared to the incongruent condition, whereas the control group presented with a significant yet reverse effect such that a significantly larger activation was observed under the incongruent condition compared to the congruent condition (see Fig. 5). It should be noted that activation was also apparent in ocular areas, but this was not differential between groups or conditions and is attributed to ocular artifacts.
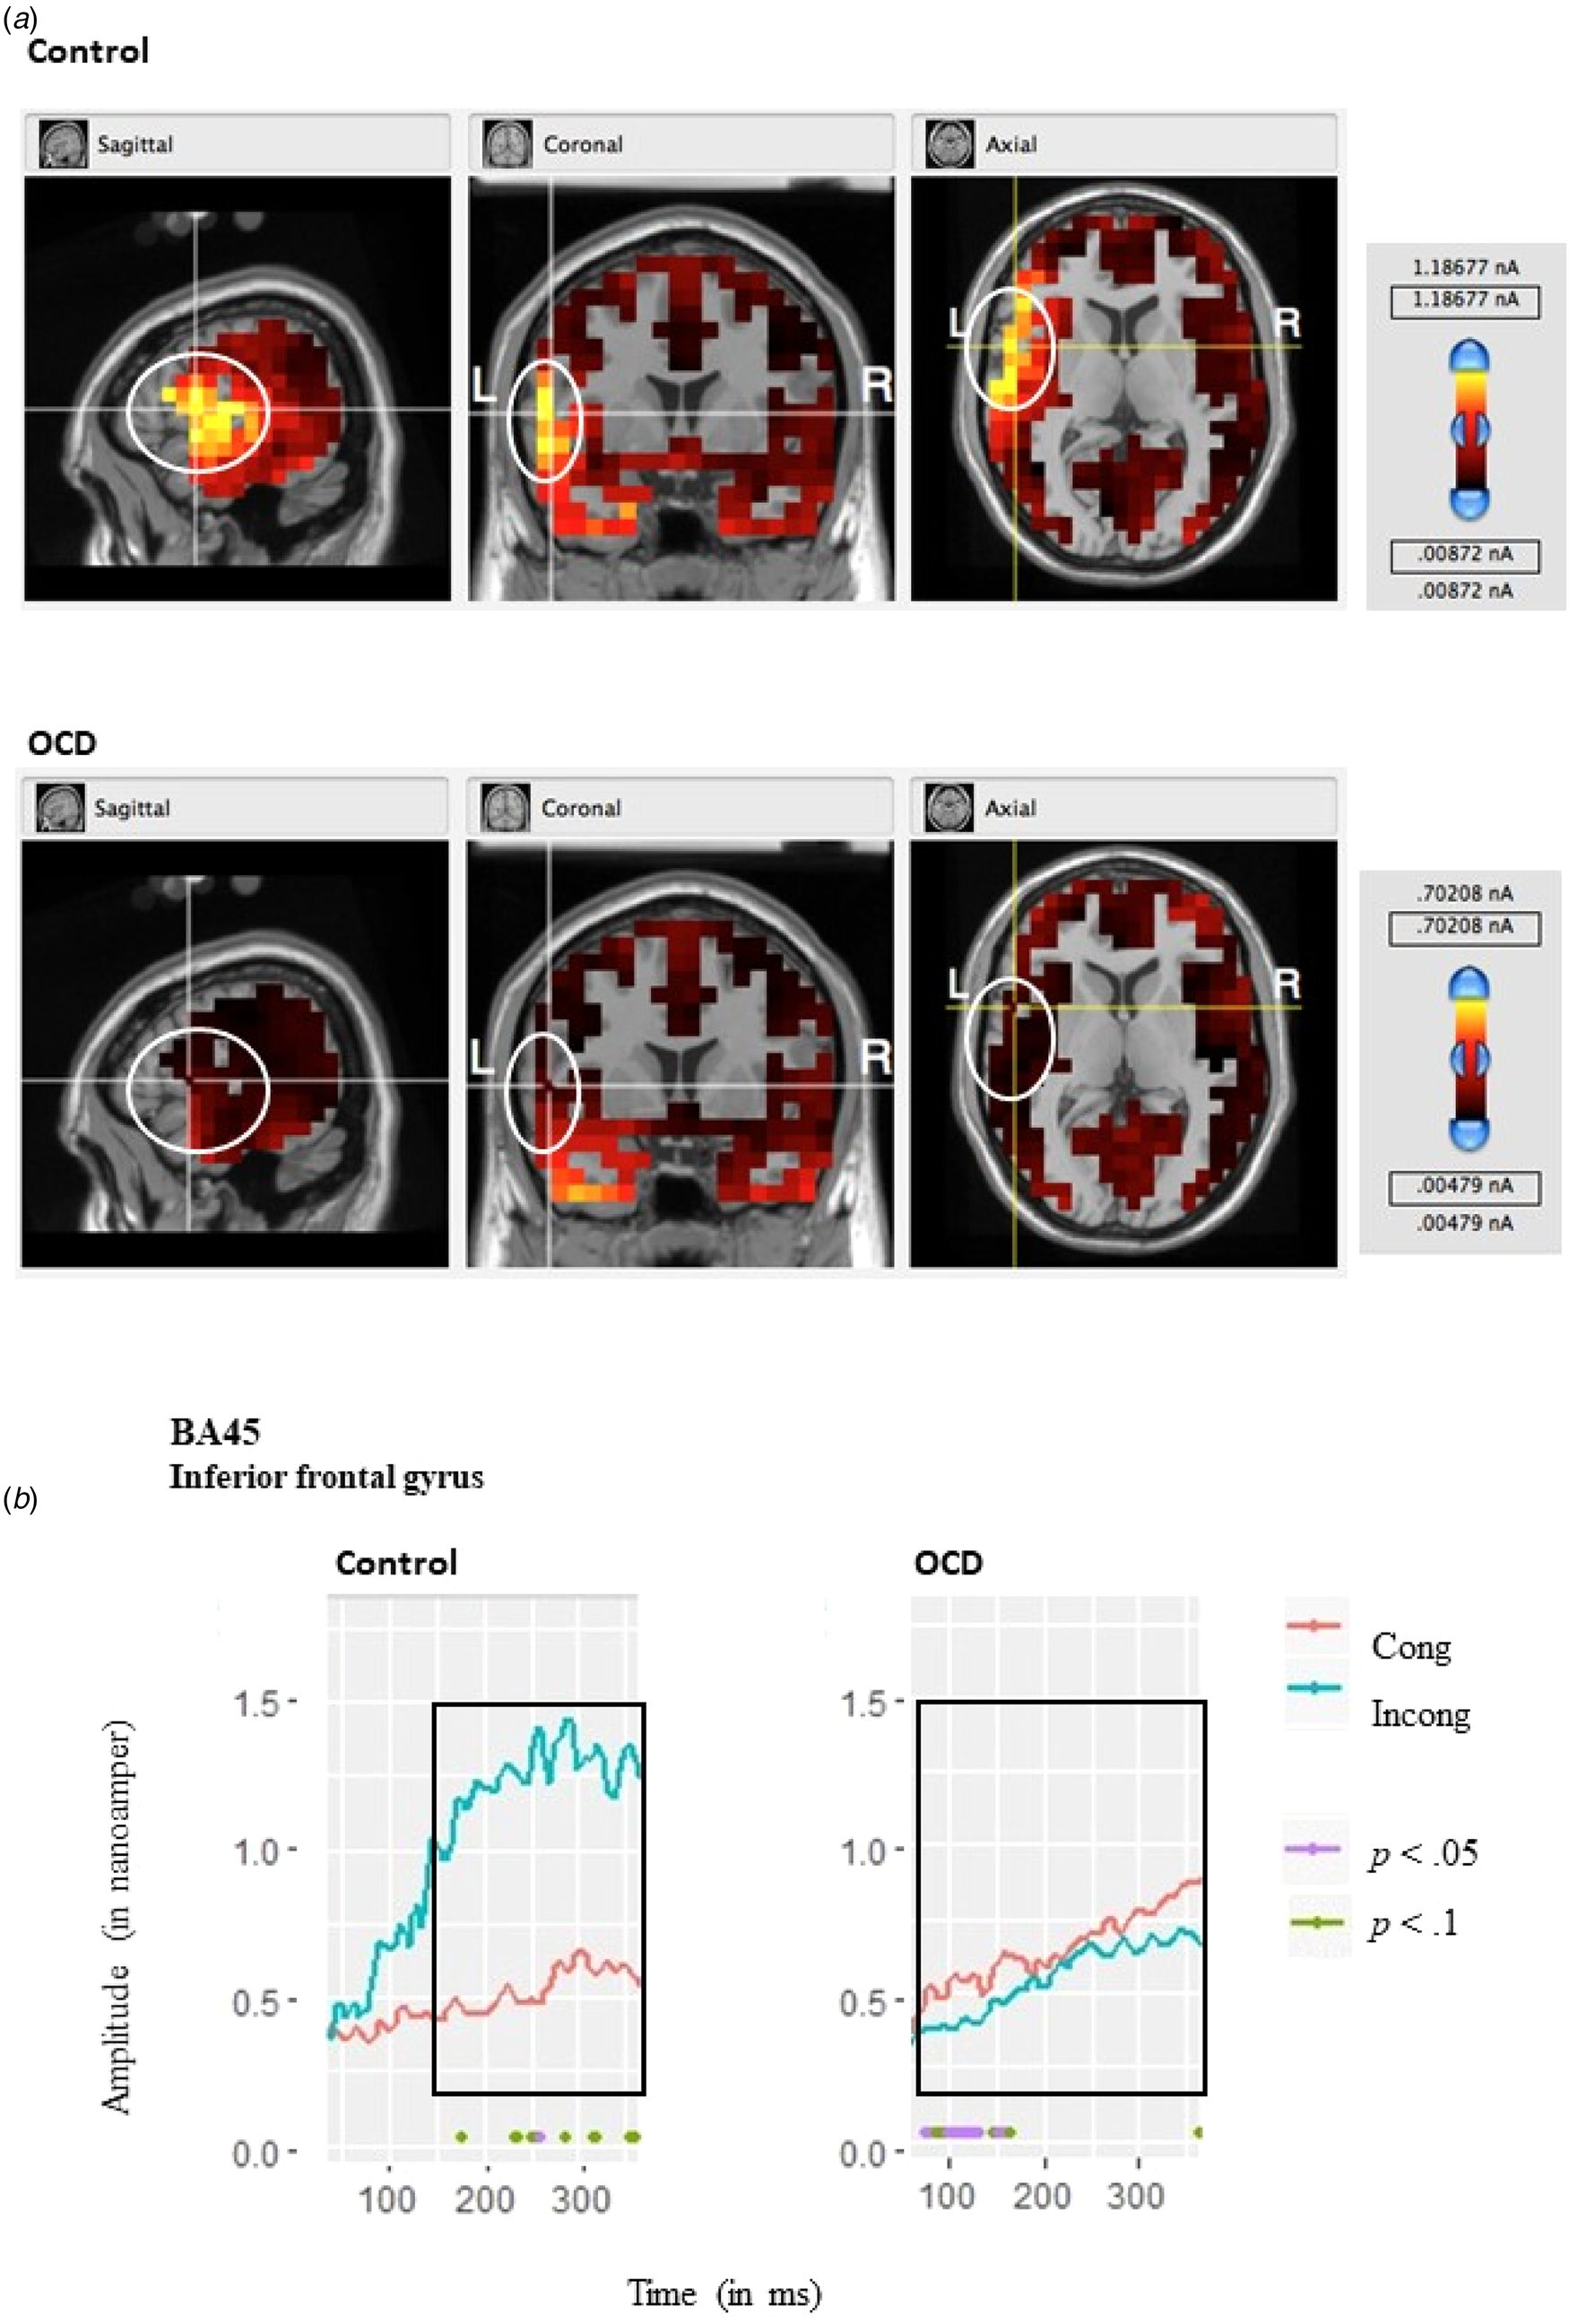
Fig. 5. (a) MRI images for each group, showing the source activity, localized at the inferior frontal gyrus area at 230 ms, with coordinates set at 35, 130, 80. (b) Corresponding ROI activations (in nanoamperes) for the N2 plotted for scalp voltages estimated based on the sLORETA algorithm (Pascual-Marqui, Reference Pascual-Marqui2002), for areas corresponding to BA45 (frontal inferior gyrus) for the OCD and control group. ROIs for the MRI images are represented by the white circles. Colors represent power in (nanoamperes), with red being the lowest scale and yellow being the highest. L, left hemisphere; R, right hemisphere, BA, approximate Brodmann area; time points for which the differences are significant are plotted in purple (p < 0. 05) and green (p < 0.1) dots below the line graphs.
Correlation analyses
A significant correlation was found between the OCI-R and LRP: r(76) = −0.204, p = 0.039, 95% CI (−0.41 to 0.022). Conversely, no significant correlations were found between the BDI or STAI scores and the LRP; BDI: r(76) = −0.107, p = 0.359; STAI: r(76) = −0.157, p = 0.177. Because there was a significant reverse interaction effect for group and congruency, correlations between clinical symptoms and the N2 component were calculated for the OCD group and not the entire participant sample. These correlations were calculated under the incongruent condition because this was our condition of interest regarding our hypothesis of inhibitory mechanisms during conflict. A significant correlation was found between the OCI-R and N2 component under the incongruent condition: r(38) = 0.306, p = 0.031, 95% CI (0.087–0.497). Further, no significant correlations were found between the BDI or STAI scores and the N2; BDI: r(38) = 0.048, p = 0.775; STAI: r(38) = 0.196, p = 0.239. A significant correlation was found between the N2 and LRP components for the OCD group under the incongruent condition: r(38) = −0.286, p = 0.041, 95% CI (−0.554 to 0.037).
Discussion
The goal of the present study was to test the hypothesis that participants with OCD have prepotent motor responses (i.e. increased action tendencies) and impaired response inhibition during conflict, when responses require disregarding stimuli associated with strong affordances. We tested this hypothesis using the LRP and N2 components and their source localization analyses.
Prepotent motor responses in OCD
In response to target stimuli that evoke a prepotent motor response, we found that participants with OCD had a larger LRP (in terms of amplitude) over bilateral frontoparietal areas corresponding to the motor cortex. The group differences in amplitude were found specifically in the incongruent trials. The specificity of the observed effects was further supported by the correlation analyses, which was found significant only for OCD symptoms and not trait anxiety or depression measures. Our results are consistent with those of our previous analog and clinical studies (Dayan et al., Reference Dayan, Berger and Anholt2014, 2017). The present study further expanded our previous studies by examining the effects of action-evoking stimuli on action tendencies in OCD patients compared with healthy controls. Our study examined the effects of such stimuli by measuring the LRP component while requiring the suppression of irrelevant responses that were strongly associated with presented stimuli, in order to employ a task-demand response. Our hypothesis of enhanced action tendencies in OCD patients compared to controls – in response to strongly associated action-evoking stimuli and during cognitive motor conflict – was supported.
Group differences in the LRP found in the present study suggest that the differences seen in OCD patients do not stem from a general cortical hyperarousal, which is claimed in some literature (Gilbert et al., Reference Gilbert, Bansal, Sethuraman, Sallee, Zhang, Lipps and Wassermann2004; Greenberg et al., Reference Greenberg, Ziemann, Cora-Locatelli, Harmon, Murphy, Keel and Wassermann2000; Radhu et al., Reference Radhu, de Jesus, Ravindran, Zanjani, Fitzgerald and Daskalakis2013; Richter et al., Reference Richter, de Jesus, Hoppenbrouwers, Daigle, Deluce, Ravindran and Daskalakis2012), but rather, are specific to the LRP component over motor cortices. Our results are also in accord with OCD models emphasizing the role of actions as potentially contributing factors to OCD symptoms (Anholt, Linkovski, Kalanthroff, & Henik, Reference Anholt, Linkovski, Kalanthroff and Henik2012; Kalanthroff, Anholt, Keren, & Henik, Reference Kalanthroff, Anholt, Keren and Henik2013a), and with research demonstrating compromised goal-directed behavior in OCD (Boulougouris, Chamberlain, & Robbins, Reference Boulougouris, Chamberlain and Robbins2009; Gillan et al., Reference Gillan, Papmeyer, Morein-Zamir, Sahakian, Fineberg, Robbins and de Wit2011). In terms of Gibson's Affordances Theory (Gibson, Reference Gibson1979), our results may reflect stronger affordances in OCD, resulting in more automatic and strongly activated actions in individuals with OCD. Several researchers have, indeed, suggested compromised goal-directed action in OCD patients as well as an overreliance on habitual behavior, leading to compulsions that may be driven by maladaptive habits (Boulougouris et al., Reference Boulougouris, Chamberlain and Robbins2009; Gillan et al., Reference Gillan, Papmeyer, Morein-Zamir, Sahakian, Fineberg, Robbins and de Wit2011).
Regarding the congruency effects, group differences between OCD and healthy participants were present only in the incongruent trials. The incongruent condition in our results may be viewed in terms of response competition or task conflict where subjects were required to perform a task in which two different aspects of the stimulus (the directionality and the color of the arrows), compete for the subject's response (Kalanthroff, Goldfarb, & Henik, Reference Kalanthroff, Goldfarb and Henik2013b). Enhanced action tendencies in OCD patients were greater under the incongruent condition, where there was a need to choose between two competing responses (task competition) compared to the congruent condition. Indeed, previous research has indicated that when some aspects of the stimuli contradict or are incompatible with the response required, a larger LRP (indicating action tendencies) is evoked (de Jong, Coles, Logan, & Gratton, Reference de Jong, Coles, Logan and Gratton1990; Keus, Jenks, & Schwarz, Reference Keus, Jenks and Schwarz2005; Spapé, Band, & Hommel, Reference Spapé, Band and Hommel2011; Yücel et al., Reference Yücel, Harrison, Wood, Fornito, Wellard, Pujol and Pantelis2007). The LRP apparent under incongruent or incompatible conditions can be considered to reflect response competition in which a prepotent stimulus response association competes with the required response (Kok, Reference Kok1999). Response competition can lead to response preparatory processes (as manifested in LRPs) when partial aspects of the stimuli are identified during early stages of the response mechanism activation, because some stimulus information has faster access to the response activation mechanism (Coles, Smid, Scheffers, & Otten, Reference Coles, Smid, Scheffers, Otten, Rugg and Coles1995; Kok, Reference Kok1999). Therefore, it may be that the incongruent stimuli used in our research led to response competition in which the spatial aspect of the stimuli was processed more quickly due to greater affordances in OCD rendering them unable to suppress irrelevant stimulus driven behavior, thus arousing a motor preparatory process and an action tendency (i.e. a larger LRP). Possibly, for OCD patients, symptom-related stimuli in the daily environment (e.g. gas stove, light switch, etc.) serve as a trigger in which the need to act upon the stimulus competes with the need to pursue a more effective and functional response (e.g. leaving the house, studying, etc.). This conflict paradoxically may enhance the action tendency leading to compulsive behavior.
The source analysis results supported our ERP ones as they revealed several cortical and subcortical source activations that have likely contributed to the LRP differences. At the cortical level, strong activation was apparent in areas corresponding to the motor cortex (BA 4) and PMA and SMA (BA6) on the hemisphere contralateral to the responding hand. Activation in these areas was found to be significantly stronger under the incongruent condition compared to the congruent one in the OCD group. These results are compatible with our ERP effects described above. Indeed, the LRP component may be the most relevant component in analyzing response processes because it directly reflects motor cortex activity (Coles, Reference Coles1989; Valt, Stürmer, Sommer, & Boehm, Reference Valt, Stürmer, Sommer and Boehm2017). The role of motor cortical areas in movement preparation and execution has been well established in research using various methodologies, such as magnetoencephalography (e.g. Praamstra, Schmitz, Freund, and Schnitzler, Reference Praamstra, Schmitz, Freund and Schnitzler1999, etc.), event-related optical signals (e.g. Leuthold and Jentzsch, Reference Leuthold and Jentzsch2002), and EEG dipole source analysis (e.g. van Schie, Mars, Coles, and Bekkering, Reference van Schie, Mars, Coles and Bekkering2004). It has been further suggested that task conditions requiring the inhibition of one response in favor of another activate the SMA and pre-SMA (Nachev, Kennard, & Husain, Reference Nachev, Kennard and Husain2008) and that these areas are specifically sensitive to conflict manipulation (Garavan, Ross, Kaufman, & Stein, Reference Garavan, Ross, Kaufman and Stein2003). These findings are aligned with the strong activation observed in our results under the incongruent condition.
At the subcortical level, strong activation was apparent in basal ganglia areas and, more specifically, the putamen and claustrum on the hemisphere contralateral to the responding hand. Activation in these areas was found to be significantly stronger under the incongruent condition compared to the congruent one in the OCD group. Indeed, the basal ganglia modify motor control and are involved in cognitive aspects of motor control and planning and execution of motor action (Leisman & Melillo, Reference Leisman and Melillo2013). The basal ganglia have also been extensively implicated in the neuronal system and physiology of OCD (Graybiel & Rauch, Reference Graybiel and Rauch2000; Harrison et al., Reference Harrison, Soriano-Mas, Pujol, Ortiz, López-Solà, Hernández-Ribas and Menchon2009; Modell, Mountz, Curtis, & Greden, Reference Modell, Mountz, Curtis and Greden1989). Cortical-basal ganglia circuits have been suggested to have a critical role in habitual behavior and in the acquisition of stereotypical motor behaviors (Howe, Atallah, McCool, Gibson, & Graybiel, Reference Howe, Atallah, McCool, Gibson and Graybiel2011; Leisman & Melillo, Reference Leisman and Melillo2013; Lingawi & Balleine, Reference Lingawi and Balleine2012). The cortical-basal ganglia loop seems to be impaired and altered in OCD, reflecting both motor and cognitive roles of the basal ganglia, leading to repetitive behavior (compulsions) and repetitive thought (obsessions; Leisman & Melillo, Reference Leisman and Melillo2013). Within the basal ganglia, the putamen is relevant because it appears to be primarily concerned with motor control, preparation, and execution (DeLong et al., Reference DeLong, Alexander, Georgopoulos, Crutcher, Mitchell and Richardson1984; Leisman & Melillo, Reference Leisman and Melillo2013). Neurobiological models and neuroimaging studies of OCD suggest that dysfunction in the putamen contributes to the pathogenesis of OCD (Menzies et al., Reference Menzies, Chamberlain, Laird, Thelen, Sahakian and Bullmore2008; Rauch et al., Reference Rauch, Savage, Alpert, Dougherty, Kendrick, Curran and Jenike1997) and is associated with symptom severity (Kwon et al., Reference Kwon, Kim, Lee, Lee, Lee, Kim and Lee2003; Rotge et al., Reference Rotge, Langbour, Guehl, Bioulac, Jaafari, Allard and Burbaud2010). The claustrum, adjacent to the putamen, has been found to have an essential role in motor processes because it combines sensory and motor modalities into one coherent action (Crick & Koch, Reference Crick and Koch2005; Smith, Liang, Watson, Alloway, & Zhang, Reference Smith, Liang, Watson, Alloway and Zhang2017; Stevens, Reference Stevens2005). Another proposed function of the claustrum is to differentiate between relevant and irrelevant aspects of the visual information so that the former can take priority over the latter (Brown et al., Reference Brown, Mathur, Olsen, Luppi, Bickford and Citri2017; Goll, Atlan, & Citri, Reference Goll, Atlan and Citri2015; Torgerson, Irimia, Goh, & Van Horn, Reference Torgerson, Irimia, Goh and Van Horn2015). This is coherent with the stronger activation apparent under the incongruent condition because it requires choosing one response as relevant over another, competing one. Results of source analyses should be interpreted with caution, however, particularly when performing analyses for subcortical levels (Luck, Reference Luck2014; Michel et al., Reference Michel, Murray, Lantz, Gonzalez, Spinelli and de Peralta2004).
Impaired response inhibition in OCD
Regarding the N2 component, the interaction effect seen in our results in the N2 supports our hypothesis for a differential pattern of inhibition in OCD compared to control participants. This is manifested in differential inhibitory activation between congruent and incongruent conditions. In the control group, an increase in the N2 component was observed under the incongruent condition compared to the congruent condition. It appears that the conflictual state represented in the incongruent condition evoked stronger frontal negativity in the control group. This pattern has been replicated in healthy participants in multiple studies employing different paradigms, indicating an increase in frontal negativity as the task difficulty or inhibitory demand are increased (e.g. Go-NoGo tasks: Thomas, Gonsalvez, & Johnstone, Reference Thomas, Gonsalvez and Johnstone2014; van Veen & Carter, Reference van Veen and Carter2002; Stroop tasks: Qiu et al., Reference Qiu, Luo, Wang, Zhang and Zhang2006; Zhu, Zhang, Wu, Luo, & Luo, Reference Zhu, Zhang, Wu, Luo and Luo2010).
For the OCD group, however, a reverse effect was observed: the N2 was significantly reduced for the incongruent condition, requiring response inhibition, compared to the congruent one. This observed reduction in N2, an inhibitory component, is in accordance with vast research indicating impaired response inhibition in OCD (Bannon et al., Reference Bannon, Gonsalvez, Croft and Boyce2002; Chamberlain, Blackwell, Fineberg, Robbins, & Sahakian, Reference Chamberlain, Blackwell, Fineberg, Robbins and Sahakian2005; Chamberlain et al., Reference Chamberlain, Fineberg, Blackwell, Robbins and Sahakian2006). Our results are in line with research using the Go-NoGo task showing reduced N2 in the NoGo condition (in which a response needs to be inhibited) for OCD patients (Herrmann, Jacob, Unterecker, & Fallgatter, Reference Herrmann, Jacob, Unterecker and Fallgatter2003; Kim et al., Reference Kim, Kim, Yoo and Kwon2007; Kim et al., Reference Kim, Lee, Choi, Kwak, Hwang, Kim and Kim2017). It should be noted that several studies have demonstrated an enhanced N2 in OCD patients; however, these have often used paradigms in which a trial-by-trial analysis was used, which is thought to represent conflict adaptation rather than conflict processing and perception per se (Ciesielski et al., Reference Ciesielski, Rowland, Harris, Kerwin, Reeve and Knight2011; Riesel et al., Reference Riesel, Klawohn, Kathmann and Endrass2017).
It was previously proposed that the N2 might occur at a premotor level and is perhaps related to general response selection processes (Falkenstein, Hoormann, & Hohnsbein, Reference Falkenstein, Hoormann and Hohnsbein1999; Fan et al., Reference Fan, Liu, Lei, Cai, Zhong, Dong and Zhu2016; Gajewski, Stoerig, & Falkenstein, Reference Gajewski, Stoerig and Falkenstein2008). These findings suggest a deficit in early inhibitory processes, whereas much of the inhibition research in OCD investigated later process of inhibition, such as those measured by the stop-signal task using stop signal RTs (Chamberlain et al., Reference Chamberlain, Blackwell, Fineberg, Robbins and Sahakian2005; Verbruggen & Logan, Reference Verbruggen and Logan2008). In such tasks, the N2 elicited during the stop-signal trials additionally involved the inhibition of a premature response plan or response tendencies of motor execution (Fan et al., Reference Fan, Liu, Lei, Cai, Zhong, Dong and Zhu2016). The temporal alignment of both the LRP and the N2 components (both commencing at approximately the same time post stimulus) might suggest that the N2 in the present study indeed represents perceptual inhibition rather than a motor one. The reduced N2 observed for the OCD group under the incongruent condition, may therefore represent processes of task conflict, triggered by the stimulus properties, requiring inhibition of one of the competing responses (Kalanthroff et al., Reference Kalanthroff, Anholt, Keren and Henik2013a). The ability to insert task control, inhibiting of one of the competing responses, has indeed been found to be impaired in OCD (Kalanthroff et al., Reference Kalanthroff, Henik, Simpson, Todder and Anholt2017).
The specificity of the observed N2 effects was further supported by the correlation analyses, which were found to be significant only for OCD symptoms and not trait anxiety or depression measures. This finding corroborates earlier findings showing N2 reduction in OCD patients to be negatively correlated with YBOCS scores for OCD patients (Kim et al., Reference Kim, Kim, Yoo and Kwon2007).
The source analysis results supported our ERP results because they revealed source activations that likely contributed to the N2 differences. Strong activation was apparent in areas corresponding to the inferior frontal gyrus (BA 45). Activation in these areas was found to be differential for the OCD and control group. The OCD group presented with a significantly larger activation under the congruent condition compared to the incongruent condition, whereas the control group presented with a significant yet reverse effect, such that a significantly larger activation was observed under the incongruent condition compared to the congruent condition. The results for the control group were mostly marginally significant due to increased variability in the control group. As such, future research should attempt to examine these effects closer, possibly using better spatial resolution tools such as functional magnetic resonance imaging (fMRI).
Our source localization results for the N2, nonetheless, are compatible with the effects described above. The sources for the frontal N2 component have indeed been previously reported in frontal cortical regions (Bekker, Kenemans, & Verbaten, Reference Bekker, Kenemans and Verbaten2005), and specifically in the inferior prefrontal cortex (Kiefer, Marzinzik, Weisbrod, Scherg, & Spitzer, Reference Kiefer, Marzinzik, Weisbrod, Scherg and Spitzer1998). The importance of the inferior frontal gyrus in inhibition has been implicated in several previous neuroimaging studies (Aron, Fletcher, Bullmore, Sahakian, & Robbins, Reference Aron, Fletcher, Bullmore, Sahakian and Robbins2003; Aron, Robbins, & Poldrack, Reference Aron, Robbins and Poldrack2004; Aron, Robbins, & Poldrack, Reference Aron, Robbins and Poldrack2014; Egner & Hirsch, Reference Egner and Hirsch2005; Garavan, Ross, & Stein, Reference Garavan, Ross and Stein1999; Konishi et al., Reference Konishi, Nakajima, Uchida, Kikyo, Kameyama and Miyashita1999; Langenecker, Nielson, & Rao, Reference Langenecker, Nielson and Rao2004). The activation of the inferior frontal gyrus has been specifically demonstrated in the Stroop task under the incongruent condition, as observed in the present research (Banich et al., Reference Banich, Milham, Atchley, Cohen, Webb, Wszalek and Shah2000; Bench et al., Reference Bench, Frith, Grasby, Friston, Paulesu, Frackowiak and Dolan1993; Brown et al., Reference Brown, Kindermann, Siegle, Granholm, Wong and Buxton1999; Langenecker et al., Reference Langenecker, Nielson and Rao2004; Mead et al., Reference Mead, Mayer, Bobholz, Woodley, Cunningham, Hammeke and Rao2002). These findings are aligned with the strong activation observed in our results under the incongruent condition compared to the congruent condition for the control group.
The N2 results observed for the OCD group in the present study, however, show a reduction in activation in the inferior frontal gyrus for the incongruent condition compared to the congruent condition. Decreased activation in prefrontal brain areas, and the inferior frontal gyrus specifically, has indeed been related in previous research to dysfunction during interference inhibition in OCD patients and negatively correlated with symptom severity (de Wit et al., Reference de Wit, de Vries, van der Werf, Cath, Heslenfeld, Veltman and van den Heuvel2012; Menzies et al., Reference Menzies, Chamberlain, Laird, Thelen, Sahakian and Bullmore2008; Rubia, Cubillo, Woolley, Brammer, & Smith, Reference Rubia, Cubillo, Woolley, Brammer and Smith2011; Verbruggen & Logan, Reference Verbruggen and Logan2008). A recent fMRI study with OCD patients found reduced inferior frontal activation specifically during successful inhibition, as in our results, but not during unsuccessful inhibition (Woolley et al., Reference Woolley, Heyman, Brammer, Frampton, McGuire and Rubia2008). The differential pattern of activation observed in our results is aligned with results from a study using the Go-NoGo task in which, during response inhibition, the control group showed increased activation in inferior frontal areas, whereas the OCD group showed a reduction in these areas, inversely correlated with symptom severity (Roth et al., Reference Roth, Saykin, Flashman, Pixley, West and Mamourian2007).
An integrative model for OCD: enhanced action tendencies and impaired inhibition
The correlations between enhanced action tendencies (manifested via the LRP component) and impaired inhibitory mechanisms (manifested via the N2 component) in OCD expand on our previous research by relating these two processes. The reduced inhibition observed in the OCD group in the incongruent condition, may be related to the activation of increased motor prepotent response plans manifested in larger LRP amplitudes. One possible interpretation of the finding of stronger LRP in the OCD group (compared to the control group) could be that participants with OCD present a superior ability to suppress task-irrelevant information. This interpretation is compatible with the view of compulsions as being primarily carefully planned, timed, and executed behaviors (Abramovitch & McKay, Reference Abramovitch and McKay2016). However, the N2 analysis supports an opposite interpretation: our results show that, in the incongruent condition, the OCD group demonstrated a reduction in the N2 amplitude, suggestive of a faulty inhibitory process in OCD. This suggests that increased action tendency in a conflictual state may be indicative of the activation of two action plans, resulting in a stronger need, yet a weaker ability to inhibit action tendencies. Such an interpretation is compatible with recent findings suggesting that intrusive thoughts and compulsive behaviors are related to attenuated goal-directed behavior (Gillan, Kosinski, Whelan, Phelps, & Daw, Reference Gillan, Kosinski, Whelan, Phelps and Daw2016). It therefore appears that in conflictual conditions, mimicking real life compulsion-evoking situations, OCD patients have a paradoxically impaired inhibitory mechanism on a primary, early, perceptual level. This may thus increase task conflict because stimuli evoke competing tasks (e.g. touching the light switch competes with the need to leave the house to avoid being late to work). This is accompanied by increased action tendencies, facilitating the execution of nonadaptive, nonefficient compulsions over goal-directed behavior, thereby maintaining or perhaps initiating a vicious obsession–compulsion cycle. In that respect, the current research provides the first evidence for a potential interaction between enhanced action tendencies and reduced inhibition, which might lead to an integrative model between the two processes. Future research should manipulate these processes, while measuring them simultaneously, to ascertain the relative influence of each, under different circumstances.
Mounting evidence suggests that obsessive intrusions are often accompanied and amplified by perceptual experiences of different modalities. Findings that neural representations of mental images evoke the same neural activity as real-life perceptions (e.g. imagining a fire truck's siren activates the auditory cortex; Pearson, Naselaris, Holmes, & Kosslyn, 2015) suggest that thoughts accompanied by sensory experiences are appraised as especially meaningful and important. Given that patients with OCD appear to weigh sensory information as more important than external criteria when terminating a compulsion (e.g. Salkovskis, Millar, Gregory, & Wahl, 2017), obsessional thoughts that involve multiple senses may be more likely to evoke prepotent compulsive actions. Sensory properties accompanying an intrusive thought may augment subjective reality of the obsessive preoccupation and thus make it harder for the individual to dismiss it as a mere thought. Consistent with this, in a study of 1001 patients with OCD, Ferrão et al. (2012) found that 65% of these reported strong sensory experiences that preceded or accompanied their repetitive actions.
Strengths and limitations
Although our results were mostly compatible with our hypotheses and previous findings of enhanced action tendencies in OCD, some differences observed in the ERP measure were not seen in the behavioral measures. Group and simple effects were found only in the ERP measures and not in the behavioral measures. However, this discrepancy may be reasonable because it has been suggested that the physical properties of objects rapidly and automatically activate a motor response, which may be observed only in subtle neurological measures (de Jong, Coles, & Logan, Reference de Jong, Coles and Logan1995; Gibson, Reference Gibson1979; Makris, Hadar, & Yarrow, Reference Makris, Hadar and Yarrow2011).
In the present results (and in line with our previous studies), enhanced action tendencies were related to OCD and not to depression and anxiety symptoms (Dayan et al., Reference Dayan, Berger and Anholt2014, 2017). Although this is an important finding, a limitation of the present study lies in the reduced range of OCD symptoms in our patient group, because our recruitment method involved noncomorbid, nontreatment-seeking, and nonmedicated OCD participants. Furthermore, no direct patient control group was used. Future research should include patient control groups of participants with anxiety or affective disorders, to better ascertain the specificity of increased action tendencies in OCD as a compulsive disorder involving repeated habitual behavior. The recruitment method in this study also decreases the generalizability of the present findings to highly impaired, comorbid, and medicated samples. Another limitation to the generalizability of our sample lies in the fact that all subjects were undergraduate students. Although our a priori hypotheses were verified, using Bayesian analysis and simple effect analysis, no interaction effects were observed via NHT, perhaps due to sample size and limitations of the strength of the paradigm. The sample size might have also limited potential findings regarding the nonresponsive hand resulting in no significant effects. Future research should examine the effects of action-evoking stimuli in larger samples, using manipulations with symptom-related stimuli and stimuli that evoke stronger action tendencies.
It should also be noted that, although all participants met the minimum criteria for OCD (as assessed by the MINI interview), the symptomology was indeed milder than in treatment-seeking samples. Although the recruitment method of the present study did limit the range of OCD symptoms in the patient group and the generalizability of our results to certain populations, it also serves as a notable strength. Recruitment of noncomorbid patients is an advantage because individuals with multiple diagnoses are often more functionally impaired (Galbaud du Fort, Newman, & Bland, Reference Galbaud du Fort, Newman and Bland1993). It has further been asserted that there is an overrepresentation of patients with more complex and severe clinical symptoms when recruited from specialized mental health facilities, as opposed to more representative samples from the general community (Abramovitch, Mittelman, Tankersley, Abramowitz, & Schweiger, Reference Abramovitch, Mittelman, Tankersley, Abramowitz and Schweiger2015; McConaughy & Achenbach, Reference McConaughy and Achenbach1994). This advantage also allowed for the use a well-matched control group in age, gender, and intelligence.
Because this research focused solely on the processes of response preparation, it would be important for future research to focus on earlier or perhaps parallel processes of perceptual and decision making in OCD. Gaining a better understanding of the nature of such processes could better specify the stage at which enhanced action tendencies begin and the way in which they may interact with earlier, more primary processes of stimulus-perception mechanisms. Our recently published article takes the first step in examining early visual perception processes in OCD via ERP, specifically the P300 component (Dayan-Riva, Berger, & Anholt, Reference Dayan-Riva, Berger and Anholt2019).
The present study used an Arrow Stroop Task, which presented the need to override or suppress a strong association between the stimulus color and the automatic response related to it and was therefore sufficient in examining the ability to suppress strong response tendencies in OCD. The arrow stimuli served to automatically activate the responses associated with them and elicit a motor activation due to a previously learned stimulus–response association (McBride et al., Reference McBride, Boy, Husain and Sumner2012). A limitation stemming from the paradigm used in the present experimental design is the lack of a neutral condition. Such a condition would have allowed for an examination of the congruency effect in a more traditional Stroop-like manner, and further research should take this under consideration. Moreover, future research could also elaborate on these results by employing OCD-relevant stimuli.
Conclusions
In conclusion, the present study examined the early cognitive process of response initiation in response to action-evoking stimuli using the ERP components of LRP and N2. The study further examined brain areas relevant to action tendencies and response conflict in OCD. The source analysis results supported our ERP results: they revealed several cortical and subcortical source activations that likely contributed to the LRP and N2 differences. Our findings suggest that OCD participants exhibit enhanced action tendencies and impaired inhibitory control under conditions of conflict. Future studies could use various experimental paradigms to further explore the cognitive processes involved in these early-response tendencies in OCD.
Acknowledgements
We would like to thank Mattan S. Ben-Shachar for his help with statistical analyses in the revision of the manuscript.
Financial support
This research was supported by the Israel Science Foundation (Grant no. 576/15 awarded to Gideon E. Anholt).


