
Introduction
Alkaline glazes were first used on clay-based ceramics in Mesopotamia around 1500 B.C., at the same time as the appearance of the first glass vessels, establishing a tradition of making glazes with plant ash which continued through to the early Islamic period (Freestone Reference Freestone and Bowman1991; Hedges and Moorey Reference Hedges and Moorey1975). By contrast, the Roman Empire used lead-based glazes (Hatcher et al. Reference Hatcher, Kaczmarczyk, Scherer and Symonds1994; Walton and Tite Reference Walton and Tite2010), with alkaline natron glass being used only to produce objects of glass (Freestone Reference Freestone and Bowman1991). Attempts to find chemical compositional groups have had some success for the relatively chemically homogenous Roman/Byzantine/early Islamic glasses because of the discovery of major production sites (Freestone Reference Freestone2013; Freestone and Gorin-Rosen Reference Freestone and Gorin-Rosen1999) and for medieval European glass-making, where raw materials were obtained locally to produce vessels of distinctive compositions (Freestone Reference Freestone2005). Parthian and Sasanian glass and glazed wares, however, have only been found in consumption rather than production assemblages which, in addition to the low amounts recovered, have so far failed to yield meaningful compositional groups from which to develop proposals on where and how they were made (Brill Reference Brill and Whitehouse2005).
Ain Sinu in northern Iraq, also known as Zagurae, was contested territory for both the Parthian (247 B.C.–A.D. 224) and Sasanian (A.D. 224–651) empires, being occupied by the Romans between A.D. 197–364 (Oates and Oates Reference Oates and Oates1959) (Figs. 1 and 2). As a frontier outpost on the main route between Singara and the Tigris, little Romanisation occurred apart from that required by the military. This lack of western influence extended to its material culture, with very few western imports being found (Oates and Oates Reference Oates and Oates1959; Oates Reference Oates1968). Glazed pottery, however, is common at Ain Sinu (Fig. 3), in contrast to the ornate but unglazed wares generally recovered in northern Mesopotamia (Oates Reference Oates1968). This suggests that this remote outpost may have had its own glaze tradition, influenced by the presence of the Roman military. Against this background we present an approach to examine chemical compositional signatures of Mesopotamian glazed wares (Fig. 3) from which to investigate a sample of glazed sherds recovered at Ain Sinu by Professor David Oates and Dr. Joan Oates.

Fig. 1 Map showing the location of Ain Sinu and other sites mentioned in the text

Fig. 2 Aerial photograph of Ain Sinu from the British Academy, Sir M. Aurel Stein Collection (item: ASA/3/35; Obverse: 15098). Use of photograph permitted by British Academy.
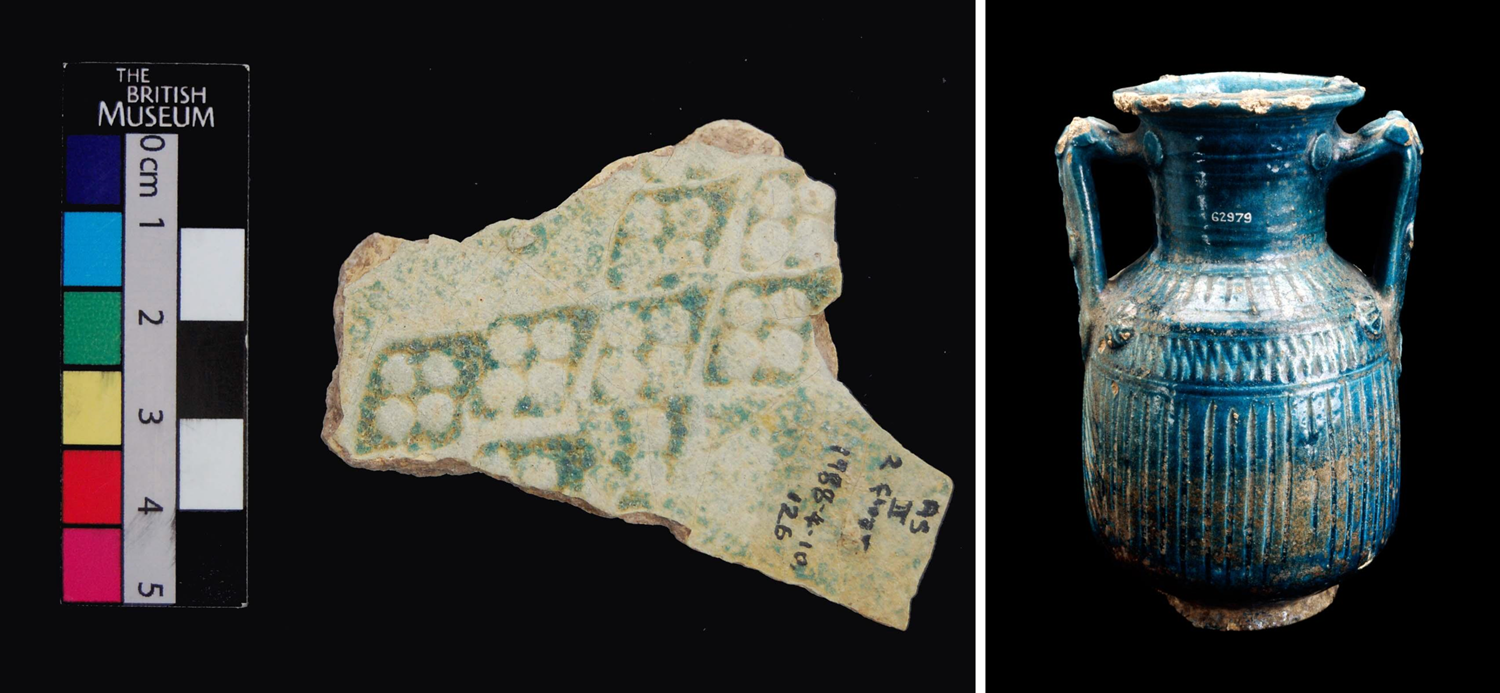
Fig. 3 Left: Glazed sherd from Ain Sinu held at the British Museum (item: 1988, 0410.126) showing the diagnostic Parthian diamond-stamp pattern. Right: Parthian blue-glazed pottery jar (second-third century A.D.) recovered in North Syria (item: 1915, 1218.1). Use of photographs permitted by British Museum.
Re-analyses of Parthian and Sasanian glaze legacy data
The approach applied was first to examine legacy data from chemical studies of glazed pottery from the Parthian and Sasanian periods, in order to identify compositional signatures (i.e., meaningful patterns in the data which could inform on production practice that may have, so far, been overlooked), and to present new compositional data from glazed sherds recovered at Ain Sinu.
The following criteria were used to select glazes in the archaeological record to determine representative Parthian and Sasanian compositional signatures:
• Samples classified as Parthian, Sasanian or Parthian-Sasanian were included in the analyses. Those classified as Sasanian/Early Islamic, or similar, were not included.
• Gravimetric methods, e.g., Matson (Reference Matson and Toll1943), or semi-quantitative techniques which could not measure the full suite of major element oxides, e.g. portable X-ray fluorescence (pXRF) were excluded. The glaze compositions reanalysed were generated from two analytical techniques: energy dispersive spectroscopy (EDS) or wavelength dispersive spectroscopy (WDS).
• Glazes of all colours were included on the assumption that additives that modified the glaze colour were added to the same base glaze and reflected variations in oxidising conditions in the kiln, rather than variations in the base compositional ‘recipes’ of the glazes.
The main components of Mesopotamian glazes derive from silica and plant ash (Brill Reference Brill and Whitehouse2005; Freestone Reference Freestone2013; Hedges and Morrey Reference Hedges and Moorey1975; Simpson Reference Simpson, Freestone and Gaimster1997a) and contain oxides of silicon, aluminium, iron, magnesium, calcium, potassium and sodium (SiO2, Al2O3, FeO, MgO, CaO, K2O and Na2O, respectively). Levels of these major element oxides for 53 Parthian and Sasanian glazed wares (Table 1) were found to overlap between sites, thereby limiting the application of compositional averages or bivariate plots to determine discriminators regarding the grouping of sites, glaze production practices or chronologies.
Table 1 Sites, data sources and techniques and chronologies of the legacy data. All concentrations are in normalised compound percent (wt% oxide). Note that additional oxides were measured in some studies.

Essentially, one of the main problems in comparing percentages of each chemical component which make up a glaze (or any multicomponent system) is that compositions are fundamentally multivariate in nature. That is, even if one part of a composition is reported, it is implicitly related to the other components. By this rationale, an individual variable, such as the percentage of silica in a glaze, has no meaning unless it is related to the whole compositional data set. On first inspection, this would appear to be resolved by normalising raw data to 100%. However, it must be noted that this mathematical operation does not circumvent the fact that the whole data set is rarely (if ever) measured. For example, portable x-ray fluorescence spectrometry (pXRF) cannot generally detect many of the lighter elements found in glass, glazes and pottery. In other words, the amounts that are measured do not add up to the real total. This makes comparisons difficult, as different data sets will have been measured in different ways, often focussing on different parts of the composition.
In effect, most compositional approaches treat compositional data as if they were just multivariate real datasets that incidentally happen to be positive and sum to 1 (or 100%). This is because these methods focus on representing transfer of ‘mass’ between parts. However, the total mass in each observation is not so relevant (i.e. it is not necessarily useful to know there is 5g of SiO2 in the sample). It is more appropriate to consider that all compositional data are actually sub-compositional (Aitchison Reference Aitchison1986, Reference Aitchison2005), e.g., silica is part of a sub-composition of the glaze components measured. An example of this problem comes from Hedges and Moorey's paper (1975), where the percentages of silica present in the Sasanian glazes were not measured directly but calculated by subtracting the sum of the other components from 100%. Although this provides a useful approximation of the amount of silica expected in these glazes, it is clearly difficult to compare accurately with other studies which have measured additional (or fewer) components.
The re-analysis conducted here treats the system as a series of sub-compositional components, by transforming the data to a log-ratio scale (Aitchison Reference Aitchison1986, Reference Aitchison2005; Wood and Hsu Reference Wood and Hsu2019). This method was first proposed by Aitchison (Reference Aitchison1986) who defined a relative geometry where only the ratios of the different components were considered. A few years later it was realised that the mathematical structure Aitchison had defined was a vector space structure in its own right, which allowed compositions consisting of D parts to be converted to a classic multivariate problem involving real vectors of (D-1) co-ordinates, i.e., the principle of working in coordinates (Pawlowsky-Glahn Reference Pawlowsky-Glahn2004). Although ratios have been applied to compositional data to distinguish between different types of natron glass (e.g., Phelps et al. Reference Phelps, Freestone, Gorin-Rosen and Gratuze2016), a log-ratio approach is robust as it removes the effects of the constant sum constraint (which compels the data to lay between 0 and 100%) in order to eliminate any ‘spurious correlations’ (Chayes 1949). In essence, the log-ratio approach considers from the outset that the interest lies in the relative magnitudes and variations of components, instead of in their absolute values, and that the data is unconstrained (thereby retaining the proper covariance structure of any compositional data) before using the full range of standard methods available for statistical inference to identify groups or patterns.
Multivariate analyses were performed using the ‘Compositions’ package in R created by van den Boogaart (Reference van den Boogaart2013), applying Aitchison's geometry (i.e., centred log-ratio transformation) to the raw compositional data (Aitchison Reference Aitchison1986, Reference Aitchison2005). We believe that this is a more consistent way of dealing with compositional data, especially when it is highly unlikely that the amounts of all components are known.
The spread of the compositional data was determined from the variation in the log-ratios (Aitchison Reference Aitchison1986). The variation matrix (Table 2) identifies co-dependence between SiO2 and MgO (0.071), CaO (0.044), K2O (0.036) and Na2O (0.064) and between MgO and CaO (0.026), and K2O and CaO (0.084), i.e., low values in the variation matrix. As these components are generally prerequisite to produce stable glasses and glazes, these co-dependencies were expected; that is, there are physico-chemical limits to how much these components can vary in order to successfully make a glaze. However, there is relatively low co-dependence between K2O and MgO (0.124) - an unexpected result for the main components of plant ash that would have been added together as part of the glaze recipe. This is discussed below. Furthermore, there is very little co-dependence between FeO and Al2O3 (0.386), or between either of these components and the other oxides in the table. This suggests variation in the silica source for the production of the glazes or during application of the glazes.
Table 2 Variation matrix showing the co-dependence of the major oxides in the legacy data.

Common links derived from the variation matrix suggest that a projection of selected variables onto a particular direction is quasi-constant for the following sub-compositions: a) Na2O-SiO2-FeO; b) Al2O3-MgO-CaO; c) Na2O-MgO-CaO and d) FeO-MgO-CaO. These sub-compositions were used to determine compositional signatures for Parthian and Sasanian glazes and produced legacy data bands on log-ratio plots (Fig. 4a–d).

Fig. 4 Log-ratio plots of the glaze compositions for the legacy data and the Ain Sinu glazed sherds: a) log(Na2O/FeO) vs log(SiO2/FeO); b) log(MgO/Al2O3) vs log(CaO/Al2O3); c) log(MgO/Na2O) vs log(CaO/Na2O); and d) log(MgO/FeO) vs log(CaO/FeO). Open circles are from the legacy data (Table 1). Triangles show the samples from Ain Sinu (Table 4). Open (red in online version) triangles are those glazes from Ain Sinu which appear to have been fluxed using natron (highlighted in Table 4), i.e., Roman glass.
Experimental methods and materials
Sample selection was carried out at the Department of the Middle East: Ancient Iran and Arabia of the British Museum (BM) for Parthian glazed wares. It should be noted that although the BM collection has ceramic sherds and artefacts from the Parthian and Sasanian periods (Fig. 3), it has very few glazed ceramics, with an estimate of around 15% of the total collection. Eight glazed sherds were selected from Ain Sinu in Iraq (BM codes: 1988,0410.126, 156, 157, 163, 169-171, 176), which had been excavated at the Roman Legionary fort by Professor David Oates and Dr Joan Oates and were described as late Parthian (c. early third century A.D.) (Oates and Oates Reference Oates and Oates1959).
The body fabrics of the eight Ain Sinu samples and 18 Mesopotamian pottery fabrics from Nineveh (2), Babneet (1), Siraf (6) and Uqair (9) held at the British Museum were measured alongside standards JGb1 and NIM-G and a clay sample of known composition, using inductively coupled plasma optical emission spectroscopy (ICP-OES) and mass spectrometry (ICP-MS) (conducted on a Thermo X Series 2 Inductively-Coupled Plasma Mass Spectrometer at the School of Earth & Ocean Sciences, Cardiff University).
Glazes were measured using a Hitachi S-3400N SEM with an attached energy dispersive x-ray spectrometer (EDS) (Oxford Instruments, UK) as this was the preferred technique used in much of the legacy data for analysing glaze compositions. Furthermore, it allowed representative glaze compositions to be measured, i.e. focussing on areas over 150μm from the interface of the body of the sherd and also away from weathered outer edges. A conductive carbon-coating was applied to the sample, which was examined at working distance of 10mm using a voltage of 20keV. An acquisition time of 100 seconds was used with a dead time between 35-40%. The SEM-EDS was optimised using cobalt prior to any analytical work, and approximately every 90 minutes during scanning. Relative accuracy values determined from archaeological glass standards (Corning A and B) were better than 10% for all the major element oxides. Antimony concentrations were measured on the Ain Sinu glazes using a JEOL JXA-8100 electron probe microanalyser (EPMA) with a wavelength dispersive X-ray spectrometer (WDS), run with a 20kV accelerating voltage and a probe current of 5×10⁻⁸ nA. Samples were examined at a working distance of 11 mm. The analyses were done at full screen scans at x800 magnification (equivalent of about 50 x 80 μm). The accuracy of the calibration and the validity of the ZAF correction procedures were tested by repeat analyses of Corning A and B glass standards.
Ain Sinu pottery fabric and glaze compositions
No significant differences in the major, minor or trace element concentrations were found between these Mesopotamian fabrics and the fabrics from the Ain Sinu samples, with the major element oxides being consistent with average values for Mesopotamian body fabrics (Simpson Reference Simpson, Freestone and Gaimster1997b) (Table 3). This strongly indicates that the Ain Sinu sherd fabrics are of Mesopotamian origin.
Table 3 Compositional analyses of body fabrics for the major element oxides in the experimental study compared with literature values for Mesopotamian pottery (Simpson Reference Simpson, Freestone and Gaimster1997b). Numbers of samples tested are in italics. Standard deviations are in parentheses below the mean compositional values. All samples analysed are presented in normalised compound percent (wt% oxide).

*ICP-MS was used for minor and trace levels of oxides. ICP-OES was used for all other oxides.
The Ain Sinu glaze compositions (Table 4) were plotted on the log-ratio plots with the legacy data (Fig. 4). The Ain Sinu glazes lie within the Parthian/Sasanian legacy data band in Fig. 4a, indicating that ratios involving Na2O, SiO2 and FeO are relatively inflexible for glaze production irrespective of the find location, chronology or colour. Similarly, the majority of the Ain Sinu glazes fall within the Parthian/Sasanian legacy data bands for the other plots (Fig. 4b-d) suggesting that these glazed wares are from the same tradition as the legacy data. However, it is apparent that three sherds from Ain Sinu do not fall with the legacy data bands. The MgO concentrations for these glazes (MgO: 0.77wt% for 1988,410.156; 0.86wt% for 1988,410.163; 1.14wt% for 1988,410.171) are considerably lower than the remaining Ain Sinu samples (MgO: mean=3.08wt%; s=0.56; n=5) and those of the legacy data (MgO: mean=3.84wt%; s=0.89; n=53). These low concentrations of MgO are not considered to be the result of post-depositional leaching, as the level of Na2O (which is more susceptible to post-deposition loss) is not depleted in these three samples with respect to the other samples (Table 4). In fact, the low MgO concentrations for these three samples are more comparable with alkali glazes based on the evaporite natron, a form of hydrated sodium carbonate found as efflorescence around soda lakes (e.g., Wadi Natrun in Lower Egypt), rather than plant ash.
Table 4 Normalised mean glaze compositions of oxides for the Parthian samples from Ain Sinu in wt% oxide (i.e., compound %), apart from chlorine which is measured in wt%, measured using SEM-EDS. All absolute totals for the glazes were over 90%. Numbers of analyses per sample are in italics. All EDS measurements were made over 150μm from the ceramic body to avoid any interaction layers and also away from weathered edges. Standard deviations are in parentheses below the mean compositional values. BDL indicates that the element oxide was not detected. NA denotes that there are an insufficient number of values to determine the standard deviation. EPMA was used to measure Sb2O5 concentrations in the glazes. The samples highlighted in bold (red in online version) are the three samples which were found to lie outside the legacy data bands in Fig. 4 (a-d).

Roman glass
Table 5 shows that the typical composition of Roman glass, which was based on natron and is often classified as ‘Low Magnesia’ (Freestone Reference Freestone and Bowman1991), is similar to the glaze compositions for the three Ain Sinu glazes with low magnesia levels. This would suggest that Roman glass was applied to Parthian fabrics to produce these glazes. Since Roman glaze production used lead-based glazes (Hatcher et al. Reference Hatcher, Kaczmarczyk, Scherer and Symonds1994; Walton and Tite Reference Walton and Tite2010), this would indicate that Roman natron glass was recycled to glaze Parthian pottery.
Table 5 Composition of typical Roman glass (Freestone Reference Freestone and Bowman1991) with Sb205 values from Jackson and Paynter (Reference Jackson and Paynter2016) and the mean compositions of the three ‘natron’ samples (1988,410.156; 1988,410.163; and 1988,410.171) which fall outside the legacy data bands and the remaining five samples from Ain Sinu. n denotes the number of sherds. BDL denotes levels below the detection limit. Note the similarity between the Ainu Sinu ‘natron’ glazes and the typical composition of Roman glass for these oxides, apart from K2O.

There are some differences between these three ‘natron’ glazes and Roman glass (Table 5). The K2O concentration is several times higher in these glazes (K2O: 2.74wt% for 1988,410.156; 1.80wt% for 1988,410.163; 3.49wt% for 1988,410.171) than for Roman glass (K2O: 0.5wt%). A possible explanation for these concentrations is evident from the low co-dependence between K2O and MgO (0.124 from the variation matrix) in the Parthian-Sasanian legacy data (Table 2), which had been anticipated to have higher co-dependence, as both potash and magnesia are components of the added plant ash. This could indicate that another source of potash entered the glaze systems, other than that associated with plant ash, i.e., a source unrelated to the initial composition of the glaze. Paynter (Reference Paynter, Shortland, Freestone and Rehren2009) suggests that differences between Mesopotamian glasses and glazes could be a consequence of contamination from fuel ash or vapour, especially hard-wood fuel. Since glazes have a higher surface area to volume ratio compared to glass heated in a crucible, ash or vaporised potassium compounds are more likely to affect the composition of a glaze by adhering to the molten surface. This would suggest that levels of K2O in the glazes investigated in this study (legacy and Ain Sinu glazes) could be a consequence of potassium compounds from the plant ash flux and the type of fuel used in Parthian and Sasanian kilns, thereby diminishing any co-dependence between K2O and MgO from the plant ash. This is supported by the invariance of K2O with increasing concentrations of MgO on a bivariate plot for the legacy data and the majority of the Ain Sinu glazes (Fig. 5). Moreover, the contamination argument outlined above could suggest that the three ‘natron’ samples (open triangles in Fig. 5) were produced in the same tradition as the other glazes, but that the starting composition of the glass was different to the other glazes tested here, and to those of the legacy data. It is therefore proposed that these three samples from Ain Sinu started out with lower concentrations of K2O (because they are Roman glass, fluxed using natron) but were contaminated with K2O because they were produced in the same tradition as the other glazes.

Fig. 5 A bivariate plot of K2O (potash) vs. MgO (magnesia). Open circles are from the legacy data (Table 1). Triangles show the samples from Ain Sinu (Table 4). Open (red in online version) triangles are those glazes from Ain Sinu which appear to have been fluxed using natron (highlighted in Table 4) which do not fall within the legacy data on the log-ratio plots (Fig. 4a-d), i.e., Roman glass.
A further indication that these ‘natron’ glazes derive from Roman glass is evident from their antimony and manganese concentrations. Roman colourless glass from the first to third centuries A.D. was often decolourised using antimony (Jackson and Paynter Reference Jackson and Paynter2016) (mean = 0.54wt% Sb2O5 - Table 5). The average results of the EPMA for Sb2O5 of the Ain Sinu samples are shown in Table 4 for the three ‘natron’ Ain Sinu glazes (Sb2O5: 0.39wt% for 1988,410.156; 0.47wt% for 1988,410.163; 0.37wt% for 1988,410.171). Furthermore, two of the three ‘natron’ glazes have significant MnO levels (MnO: 0.22wt% for 1988,410.163; 0.23wt% for 1988,410.171). All other sherds from Ain Sinu were below the detection limit for both antimony and manganese (Table 4). This could suggest that the Roman glass found on these two glaze samples had already been recycled, resulting in a mixture of decolourising agents, i.e., Sb2O5 and MnO. In fact, at the extremes of the Roman world in the second and third centuries A.D., this recycled mixture appears to have become more readily available than the raw low-Mn blue–green glass (Jackson and Paynter Reference Jackson and Paynter2016). The presence of mixed Roman glass, here reapplied as glaze on Parthian pottery, could reflect the potential difficulties experienced by this Roman outpost to acquire raw and ‘pure’ decolourised glass.
Applying glass to glaze Parthian pottery
The presence of Roman glass reapplied as a glaze on Parthian pottery suggests that the practice of glazing pottery in the Parthian Empire was to use a glass precursor in the form of a crushed glass frit, rather than applying a fluxing mineral to react directly with the silica-rich clay surface during firing. The low co-dependences of FeO and Al2O3 with the other oxides in the variation matrix (Table 2) could suggest that this frit was applied as a slurry of clay/mud, thereby introducing additional variability for these components above that associated with the production of the glass frit. For the three glazes which fail to lie within the legacy data bands in Fig. 4, this frit potentially derived from recycled Roman glass followed by typical Parthian methods of practice to fire a kiln and apply a glaze on a ceramic body. This practice indicates that glass and glaze were regarded as the same material in Mesopotamian production and that potters made their own frit specifically to glaze pottery and/or there are yet undiscovered glass production sites in Mesopotamia.
Extending recycling to indigenous glass production would provide an additional reason to weathering of glass as to the relatively low numbers of Parthian and Sasanian glass artefacts in the archaeological record, i.e., each glass vessel could have been recycled to glaze two or three pots of equivalent size. Furthermore, the fact that none of the Sasanian legacy glazes appears to be made from Roman glass could suggest that the Parthian glass/glaze industry was less developed than its Sasanian successors, with Parthian potters, in some instances, having to recycle imported material.
Acknowledgements
The authors would like to thank Dr Roberta Tomber, Dr St John Simpson and Dr Duncan Hook for access to the British Museum collection, and Professor Ian Freestone at the Institute of Archaeology, UCL.


