


1. Introduction
Over the last few decades, many studies of fundamental and practical significance have been conducted concerning the interfacial instabilities of two-layer fluids in different flow configurations (Joseph & Renardy Reference Joseph and Renardy1992; Govindarajan & Sahu Reference Govindarajan and Sahu2014). For example, the stability of two superposed fluids in a pressure-driven channel flow (Valluri et al. Reference Valluri, Náraigh, Ding and Spelt2010), core–annular Poisuille flow (Preziosi, Chen & Joseph Reference Preziosi, Chen and Joseph1989) and plane Couette flow (Yih Reference Yih1967; Charru & Hinch Reference Charru and Hinch2000) has been of scientific interest. The instability of the interface between a Newtonian fluid and a non-Newtonian fluid is also an interesting problem (Sahu et al. Reference Sahu, Valluri, Spelt and Matar2007; Usha & Sahu Reference Usha and Sahu2019). However, compared with other configurations, a detailed understanding of interfacial instability in two-layer oscillatory flow configurations due to vibrations is lacking. Owing to the potential for controlling the Rayleigh–Taylor instability, flow instabilities governing the interface dynamics of two-layer fluids, exposed to an external disturbance, that is, a horizontal vibration, have received more attention (Wolf Reference Wolf2018). The horizontal vibration applied to a liquid–liquid interface has effects on the fluids, as opposed to the vertical vibration that causes a parametric excitation by modulating the effective gravity, known as Faraday instability (Douady Reference Douady1990). When two immiscible fluids with different densities stacked vertically in a container are periodically excited along the horizontal direction, pressure gradients form inside each layer because the two fluids are accelerated differently, and the resulting oscillatory shear flow promotes interfacial instability (Talib & Juel Reference Talib and Juel2007; Yoshikawa & Wesfreid Reference Yoshikawa and Wesfreid2011a). This instability is also known to cause a substantial change in heat and mass transfer across the interface (Roberts et al. Reference Roberts, Ye, Demekhin and Chang2000; Puthenveettil & Hopfinger Reference Puthenveettil and Hopfinger2009); thus, its prediction and control have significant potential in the areas of chemical mixing, liquid–liquid extraction, emulsification and oil recovery (separation) (Gaponenko et al. Reference Gaponenko, Torregrosa, Yasnou, Mialdun and Shevtsova2015; Piao, Kim & Park Reference Piao, Kim and Park2017; Piao & Park Reference Piao and Park2019; Sánchez et al. Reference Sánchez, Gaponenko, Yasnou, Mialdun, Porter and Shevtsova2020).
One of the main concerns of previous studies was the measurement and characterization of the onset condition of interfacial instability (wavy interface), with the horizontal forcing to a two-fluid system being accomplished through sinusoidally alternating translation or rotation. With translational oscillation, Wolf (Reference Wolf1969) first observed a sawtooth-like interfacial wave pattern between two superposed immiscible liquids contained in a cylinder. The stability condition for this phenomenon was derived while neglecting the viscous effect, i.e. for high frequency  $\omega \gg \nu /L^{2}$, where
  $\omega$ is the angular frequency,
  $L$ is the characteristic length and
  $\nu$ is the kinematic viscosity of the more viscous upper liquid (Lyubimov & Cherepanov Reference Lyubimov and Cherepanov1987). Also considered was a small forcing amplitude (
 $A \ll L$) in the analysis. The critical condition (dimensionless parameter of vibrational Froude number,
  $Fr = A\omega /\sqrt {gH}$ (
 $g$, gravitational acceleration;
  $H$, liquid height)) for this instability is given as a function of the densities of the upper
  $(\rho _{u})$ and lower
  $(\rho _{l})$ liquids and the wavenumber (
 $k$) of the formed wave patterns:
 \begin{equation} Fr_{cr}^{2} = \frac{(\rho_{u}+\rho_{l})^{3}}{\rho_{u}\rho_{l}(\rho_{l}-\rho_{u})}\left(k_{cr}H\right)^{{-}1},\quad k_{cr}=\frac{2{\rm \pi}}{\lambda_{cap}}. \end{equation}
Here,  $k_{cr}$ is the critical wavenumber for the most unstable wave and
  $\lambda _{cap} = 2{\rm \pi} \sqrt {\sigma /(\rho _{l}-\rho _{u})g}$ (where
  $\sigma$ is the interfacial tension) is the capillary wavelength. The subscripts
  $u$ and
  $l$ denote the upper and lower liquids, respectively. According to these criteria, it is understood that the interfacial wave pattern results from the Kelvin–Helmholtz (K–H) type of instability (Khenner et al. Reference Khenner, Lyubimov, Belozerova and Roux1999). Later, the wave patterns developing on the interface were experimentally observed when two-layer immiscible liquids contained in a rectangular container were exposed to a back-and-forth periodic translation (Beysens et al. Reference Beysens, Wunenburger, Chabot and Garrabos1998; Ivanova, Kozlov & Evesque Reference Ivanova, Kozlov and Evesque2001; Talib, Jalikop & Juel Reference Talib, Jalikop and Juel2007). It was observed that the waves appear stationary in the oscillating reference frame such that they are often referred to as ‘frozen waves’. Talib et al. (Reference Talib, Jalikop and Juel2007) numerically examined the effect of viscosity
  $(1 \le \nu _{u}/\nu _{l} \le 6 \times 10^{4})$ on the onset of frozen waves, and claimed that the inviscid model (1.1) underestimates the threshold for fluids with the same viscosity contrast (i.e.
  $\nu _{u}/\nu _{l} = 1.0$), but overestimates it for cases with a large viscosity contrast.
On the other hand, when the forcing level increases above the critical value for the onset of the wavy pattern, the interface deformation becomes larger, and nonlinear effects prevail owing to the complex interactions among viscous, gravitational and surface tension forces, beyond the previous inviscid analysis (Jalikop & Juel Reference Jalikop and Juel2009; Sánchez et al. Reference Sánchez, Yasnou, Gaponenko, Mialdun, Porter and Shevtsova2019); however, our understanding is insufficient. Jalikop & Juel (Reference Jalikop and Juel2009) investigated the steep capillary-gravity waves formed at the interface of immiscible liquids ( $\nu _{u}/\nu _{l} \sim 10^{2}$) in a horizontally oscillating rectangular container. They reported that the height and wavelength of the formed waves are dependent on a modified vibrational Froude number (
 $Fr^{*} = A\omega /\sqrt {g\lambda _{cap}/2{\rm \pi} }$) characterized by the capillary wavelength. Particularly at
  $Fr^{*} < Fr_{cr}^{*}\ (\simeq 4.2 - 4.3)$, the wavelength exhibited an explicit dependence on the forcing frequency owing to the enhanced viscous effect, and the gravitational effect determined the interface shape. Recently, Sánchez et al. (Reference Sánchez, Yasnou, Gaponenko, Mialdun, Porter and Shevtsova2019) examined the response of an interface between two immiscible fluids (
 $\nu _{u}/\nu _{l} \simeq 1.0$ and
  $10$) to translational oscillation under microgravity conditions. In addition to the frozen waves, drop ejection instability was observed in their configuration. They attempted to predict the onset of corresponding instability based on scaling analysis (Goodridge, Shi & Lathrop Reference Goodridge, Shi and Lathrop1996) and inviscid model (1.1) (Lyubimov & Cherepanov Reference Lyubimov and Cherepanov1987). Drop ejection has been investigated by a number of scholars in vertically vibrating liquid layers (e.g. Goodridge et al. Reference Goodridge, Shi, Hentschel and Lathrop1997; Li & Umemura Reference Li and Umemura2014) or sessile/pendant droplet systems (e.g. Wilkes & Basaran Reference Wilkes and Basaran1997, Reference Wilkes and Basaran2001; Wilkes, Phillips & Basaran Reference Wilkes, Phillips and Basaran1999; James, Smith & Glezer Reference James, Smith and Glezer2003).
The external effect of horizontal forcing by rotational oscillation instead of translational oscillation has also been investigated (Shyh & Munson Reference Shyh and Munson1986; Yoshikawa & Wesfreid Reference Yoshikawa and Wesfreid2011b), but there is still much more to be understood. Inside a cylindrical container turning periodically around its centre axis, a relative motion between two fluids is induced along the azimuthal direction, primarily owing to the shear force exerted by the sidewall of the container. Interestingly, the shear flow produces different trends in the interfacial waves from those of translational oscillation. For example, Yoshikawa & Wesfreid (Reference Yoshikawa and Wesfreid2011b) have observed the evolution of wave patterns at the interface of silicone oil (upper) and water (lower) with a viscosity contrast as high as  $10^{4}$. Unlike the waves – typically, small and sinusoidal – observed in a rectangular container under translational oscillation, the waves have deep thin fingers along the container periphery. They explained that this difference could be attributed to the fact that the time scale of viscous relaxation
  $(L^{2}/\nu _{u})$ of the upper oil is shorter than that of oscillation
  $(\omega ^{-1})$. In addition, Yoshikawa & Wesfreid (Reference Yoshikawa and Wesfreid2011a) also emphasized the importance of the capillary wavelength
  $(\lambda _{cap})$ and thickness (
 $\delta _{i}=\sqrt {2\nu _{i}/\omega }$, where subscript ‘
 $i$’ can be ‘
 $o$’ or ‘
 $w$’, representing oil and water, respectively) of the Stokes boundary layer, which may affect the triggering of the interfacial wave pattern.
In summary, it is necessary to investigate the interfacial instabilities beyond the occurrence of interfacial waves, when two immiscible fluids in a vertical stack are exposed to a horizontal vibration. Given the practical difficulty of imposing large-amplitude translational oscillations (Jalikop & Juel Reference Jalikop and Juel2009), we conducted experiments with rotational oscillations, an acceptable condition for investigating the contributions of various sources, such as the viscous effect. The focus of the present study is to experimentally characterize the different types of interfacial instabilities that occur in vertically stacked layers of silicone oil and water over a range of rotational oscillations, the frequency and angular amplitude of which are as varied as 0.1–3.5 Hz and  $120^{\circ } - 180^{\circ }$, respectively. We further develop a theoretical basis to predict the thresholds for each regime of instabilities and provide a physical explanation. We believe that our findings would be useful in understanding the emulsification in two-layer immiscible fluid flow subject to external forcing.
2. Experimental set-up and process
The response to rotational oscillation of an oil–water interface was measured in a cylindrical glass container with an inner radius  $R$ of
  $50$ mm, as shown in figure 1(a). The container was vertically mounted on a circular turntable that was able to execute an azimuthal oscillation following a prescribed sinusoidal function
  $\varPhi _{o}\sin ({\omega t})$ with an angular amplitude (
 $\varPhi _{o}$) and frequency (
 $\,f_{\omega } = \omega /2{\rm \pi}$, where
  $\omega$ is the angular frequency). This sinusoidal motion was executed by a servo motor (XML-FCL08AMK; capacity of
  $2.39$ N m torque and
  $3000$ r.p.m.) connected to a
  $10:1$ gearbox. We consider the ranges of frequency and angular amplitude as 0.1–3.5 Hz and
  $120^{\circ } - 180^{\circ }$, respectively, for detecting various types of interfacial instabilities including droplet formation, with combinations of frequency and amplitude of rotation. To avoid undesired perturbations caused by off-centre alignment, the centre of the cylindrical container should be aligned with the centre of rotation. When the container rotated, the average and maximum ratios of the radial deviation of the centre position were measured to be
  $0.43\,\%$ and
  $0.93\,\%$ of
  $R$, respectively, at the harshest condition of rotation (
 $\,f_{\omega } = 3.5\ \textrm {Hz}$ and
  $\varPhi _{o} = 180^{\circ }$), which are acceptable. In the container, silicone oil with a kinematic viscosity of
  $100\ \textrm {mm}^{2}\ \textrm {s}^{-1}$ at
  $25\,^{\circ }\textrm {C}$ (KF-96-100CS, Shin-Etsu Chemical Co. Ltd) and deionized (DI) water were stably superposed in the upper and lower layers, respectively. Thus, the viscosity and density contrasts were
  $100$ and
  $0.968$, respectively, and the interfacial tension (
 $\sigma$) was approximately
  $40\ \textrm {mN}\ \textrm {m}^{-1}$ (Sengupta, Khair & Walker Reference Sengupta, Khair and Walker2020). The thickness of each layer (
 $H$) was
  $50$ mm (figure 1a).

Figure 1. (a) Schematic diagram of the experimental set-up to visualize oil–water interface dynamics on the top ( $r$–
$r$– $\theta$) and side (
 $r$–
$r$– $z$) planes using two high-speed cameras. (b) Definitions of disturbed interface shape (top) and example of the time history of centre rise (
 $h$) of the interface (bottom). (c) Wave pattern visualization along the azimuthal direction from a top view (left) and the quantified radial deviations (right) for the case of
  $\,f_{\omega } = \omega /2{\rm \pi} = 1.3$ Hz and
  $\varPhi _{o}=180^{\circ }$.
To avoid contact line distortions at the solid boundary (possibly owing to surface contamination), which would influence the characteristics of interfacial waves (Jalikop & Juel Reference Jalikop and Juel2009), the inner-wall surface of the container was treated with plasma before each run of the experiment. We find that the wall of the present container is hydrophilic, with an equilibrium contact angle of approximately  $5^{\circ } - 10^{\circ }$ (Kim, Moon & Kim Reference Kim, Moon and Kim2020). This is critical to ensuring the reproducibility of the onset of interfacial instabilities, such as the appearance of wavy patterns and droplet formation. This was confirmed by measurements repeated more than three times. Furthermore, as the vertical motion of the oil–water interface is induced alternately, the effect of capillary waves emanating from the meniscus (i.e. the curved oil–water interface at the wall observed in the current study) on the interfacial instabilities may be insignificant because the driving frequency is less than that (
 $\sim \boldsymbol {O}(10^{1}$)) for the resonant condition of such capillary waves (Shao et al. Reference Shao, Gabbard, Bostwick and Saylor2021). Meanwhile, we discovered that the measured difference in maximum rise of the interface is less than
  $1\,\%$, and the differences in critical frequencies for interfacial waves and single-droplet formation were approximately
  $6\,\%$ and
  $3.8\,\%$, respectively (for details, see supplementary material available at https://doi.org/10.1017/jfm.2021.628).
A series of measurements were systematically taken by gradually increasing the frequency in increments of 0.01–0.2 Hz at a fixed angular amplitude. We used the high-speed shadowgraphy imaging technique with two high-speed cameras (NX5, IDT) to detect the onset of interfacial instabilities in the top and side views (figure 1a). The side-view visualization (camera no.  $1$, resolution of
  $1920 \times 1440$ pixels) is focused on the centre plane to track the trajectory of the position of the interface centre (marked with red point in figure 1b). A
  $750$ W tungsten lamp (ARRILITE 750 Plus) was used to uniformly illuminate the oil–water system while highlighting the interface. By processing the collected raw images (more than
  $2000$ for each case) with in-house MATLAB codes, we obtained statistical data including the maximum rise of the interface at the centre (
 $h$) measured from the initial position (an example is shown in figure 1b), and the identification of a single droplet (highlighted with a dashed arrow in figure 1b). The images were captured at a speed of 100–350 f.p.s. (
 $100$ times the driving frequency), and the recording time was set to tens of periods of oscillation (up to
  $90$ s depending on the regime of instability), which was found to be sufficient to achieve the converged behaviour of interface deformation or breakage. It should be noted that accurate visualization of the interface is not possible in the zone directly below the contact line, which is obstructed by the meniscus (the blurred zone in figure 1b). Camera no.
  $2$ (
$2$ ( $1630 \times 1720$ pixels) visualizing the top view was synchronized with camera no.
  $1$ to capture the concentric circles printed on the bottom of the container (figure 1a). We can measure the refraction of circles on the deformed oil–water interface (i.e. wave pattern; denoted by the blue arrow in figure 1c, for example), that is, the radial displacement of the concentric circles in the
  $r$–
$r$– $\theta$ plane. The variation in this displacement was further quantified using the image processing technique (figure 1c). To evaluate the number of oscillating waves along the azimuthal direction, we applied the fast Fourier transform to the data shown in figure 1(c). In addition, the radial positions at which the droplets were formed can be identified from the top-view images (see the dashed arrow in figure 1c).
3. Results and discussion
3.1. Interfacial pattern regime classification in terms of forcing parameters
We first identified the different regimes of disturbed interfacial patterns depending on the driving frequency ( $\,f_{\omega }$) and angular amplitude (
 $\varPhi _{o}$) of the applied rotational oscillation. Figure 2 shows the sequential evolution of the oil–water interface into different regimes of instabilities. The non-dimensionalized time is defined as
  $t^{*} = t\,f_{\omega }$, reflecting the number of cycles (i.e. the period of oscillations). As shown, regardless of the later status of interface perturbation, the oil–water interface rises significantly in the core region at the initial stage (
 $t^{*} < 1.1$) of the rotary oscillation. This is caused by the faster transfer of momentum from the container wall in the more viscous upper liquid (oil) than in the lower liquid (water). As a result, a large positive radial pressure gradient (pressure increases towards the wall) is set up in the upper oil earlier than in the lower water. Thus, water tends to bulge up with a convex curvature in the centre of the container (Berman, Bradford & Lundgren Reference Berman, Bradford and Lundgren1978). The oil–water interface exhibits oscillating motions (with convex and concave interface curvatures, respectively) in the centre area, driven by the oscillating pressure gradient caused by the periodically induced accelerating–decelerating (oscillatory) flow. Except in the case of massive emulsion formation, the maximum rise of the interface (at
  $r = 0$) decays for the next one to three cycles (transient stage) and reaches a converged state (with a constant
  $h$) during this periodic motion (see supplementary movies S1–S4). Following this transition, the oscillating frequency of the interface (based on the time history of
  $h$) also changes: the interface oscillates at the driving frequency in the transient stage, but it is doubled to
  $2\,f_{\omega }$ in the converged stage. The process is explained well in the time history of
  $h$ (for the case of
  $\,f_{\omega } = 0.94$ Hz and
  $\varPhi _{o} = 180^{\circ }$) (figure 1b).

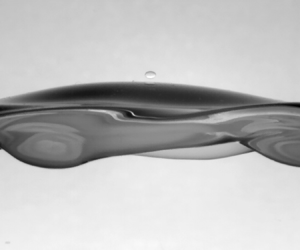
Figure 2. Representative spatio-temporal evolution of the disturbed interface in a side view: (a) interfacial wave ( $\varPhi _{o} = 180^{\circ }$ and
  $\,f_{\omega } = 1.2$ Hz); (b) single-droplet formation (
 $\varPhi _{o} = 175^{\circ }$ and
  $\,f_{\omega } = 1.44$ Hz); (c) multiple-droplet formation (
 $\varPhi _{o} = 160^{\circ }$ and
  $\,f_{\omega } = 2.3$ Hz); (d) emulsion state (
 $\varPhi _{o} = 175^{\circ }$ and
  $\,f_{\omega } = 2.26$ Hz). Here, the dimensionless time
  $t^{*}=t\,f_{\omega }$ is used to reflect the number of the periods of oscillation.
When the external rotary oscillations exceed (increase in  $\,f_{\omega }$ or
  $\varPhi _{o}$) the threshold for breaking the flat interface, the first phenomenon we observe is the growth of interfacial waves (highlighted with the blue arrows in figure 2a) at the near-wall region where the relative motion (velocity) between the oil and water layers is the strongest (Yoshikawa & Wesfreid Reference Yoshikawa and Wesfreid2011b). Unlike the deformation at the core, these wave patterns near the wall exhibit the structures of oil penetrating into water and tend to fade away owing to the reduction of relative velocity between oil and water over
  $0.1R$–
 $0.4R$ towards the core (figure 1c). Similar phenomena were reported by Yoshikawa & Wesfreid (Reference Yoshikawa and Wesfreid2011b). On the other hand, we find that the present wave patterns are not stationary (so-called ‘frozen’) in the frame of the oscillating container but fluctuate at the driving frequency (for the complete phenomena, see supplementary movie S1). This is because the relative oscillatory motion between oil and water is induced by the viscous shear force exerted by the container sidewall, and the resulting combination of velocity-induced (or the term ‘viscosity-induced’ used by Yih (Reference Yih1967)) and K–H type of instabilities causes the formation of oscillating waves (details are discussed in § 3.2); however, the frozen waves were induced through the velocity-driven instability of steady Couette flow in two-layer fluids with a large viscosity contrast of
  $10^{4}$ (Yoshikawa & Wesfreid Reference Yoshikawa and Wesfreid2011a,Reference Yoshikawa and Wesfreidb). As we measured the velocity distributions during the oscillation (see supplementary material), the velocity field in the oil layer exhibited oscillatory behaviour (see figure S4a in the supplementary material). At the transient stage (
 $t^{*} \lesssim 1.53$), the wave height (defined as the vertical distance between crest and trough) was relatively small but was amplified gradually until it was in a saturated state at the converged stage (
 $t^{*} > 3.65$) (figure 2a).
When the rotational disturbances are increased further, exceeding the thresholds for the wavy deformation of the interface near the wall, there occurs a fascinating phenomenon of the formation of a single (water) droplet at the core region, as shown in figure 2(b) and supplementary movie S2. To the best of our knowledge, this type of instability has not been found and analysed in the present configuration of an oil–water interface. As the centre rise of the interface reaches the first maximum ( $h_{1}$) (at
  $t^{*} = 1.2$), the interface exhibits a dome-like shape, different from the rounded parabolic shape observed in the regime of interfacial wave formation (at
  $t^{*} = 1.1$ in figure 2a). It is quantitatively distinguished in such a way that the inclination angle of the dome-like profile (
 $58.7^{\circ }$) is greater than that of the rounded parabolic profile (
 $49.9^{\circ }$) (see figure 3 for the definition of inclination angle
  $\alpha$). A more detailed analysis of the geometrical features of the interface in the context of droplet formation is given in § 3.3. A single droplet (highlighted with dashed arrows in figure 2b) is generated during the downward motion of this bulge-up interface, and is detected near the lowest point of the interface (at
  $t^{*} \simeq 1.58$). Once it is formed, it does not disappear (merge into bulk liquid) immediately, and bounces in synchronization with the periodic oscillation of the interface while remaining above the centre area (figure 2b); in fact, we did not observe the droplet being extinguished during the entire experiment, and thus the study of the dynamic interaction between the droplet and interface would be very interesting, which we propose to take up in our future work. In § 3.3, we present a theoretical discussion of this interesting phenomenon in terms of the underlying mechanism and droplet size estimation. The wave patterns at the near-wall area are still observed in this regime (marked by a solid arrow), and the wave height at the converged stage (
 $t^{*} > 1.58$) also increased owing to the enhanced forcing (frequency and amplitude).

Figure 3. Definitions of the interface curvature ( $\kappa$) against the central axis and the inclination angle (
 $\alpha$) of the interface: (a) raw image and (b) binarization.
Figure 2(c) shows the sequential process of multiple-droplet formation near the container wall (it was noted that a single droplet formed at the core region), for the case of  $\varPhi _{o} = 160^{\circ }$ and
  $\,f_{\omega } = 2.3$ Hz (see also supplementary movie S3). During the initial upward movement of the interface (
 $t^{*} \simeq 1.77$), the finger-like patterns (number of fingers increases with increasing strength of oscillatory rotation, denoted by solid arrows) are captured along the azimuthal direction. In this case, single-droplet formation was not detected during subsequent sagging of the interface. With time, the interfacial waves evolve into elongated finger-like troughs and narrower crests, and water droplets are formed near the wall in the oil layer, the number of which increases (confirmed from the top-view visualization). If the driving frequency is relatively high, the number of fingers in the initial cycle (
 $t^{*} \simeq 1.8$, highlighted with solid arrows in figure 2d) is already higher, and the population of the oil droplets in water (indicated by dashed arrows) increases explosively at the transient stage of
  $t^{*} > 5.0$ (figure 2d). Similar to the case of multiple-droplet formation, the droplets initially form in the near-wall region, but at a later time (
 $t^{*} > 99.4$, for example, in the figure), a distinct separation of oil and water is unclear, and droplets occupy the entire container, resulting in an oil-in-water emulsion state (water droplets may coexist; see supplementary movie S4). For the cases of multiple-droplet and emulsion formation, in § 3.4 we mainly focus on elucidating their mechanisms and predicting their thresholds.
Collecting all the data tested on a range of  $\,f_{\omega } = 0.1 - 3.5$ Hz and
  $\varPhi _{o} = 120^{\circ } - 180^{\circ }$, we were able to produce a regime map for different interfacial patterns on the amplitude–frequency plane (figure 4). In the figure, the rotational (angular) amplitude is further converted to
  $A = R\varPhi _{o}$, representing the azimuthal displacement of the container wall. First, the stable and unstable regions are classified across the boundary of the wave appearance on the interface, denoted by filled circles. As the frequency (
 $\,f_{\omega }$) increases, the interfacial wave regime transitions to multiple-droplet formation and the emulsion state, and the single-droplet formation regime appears before multiple-droplet formation when the amplitude (
 $A$) is larger than
  $0.14$ m. It is noted that the amplitude threshold for the regime transition decreases with increasing
  $\,f_{\omega }$, indicating that there is a critical forcing velocity (
 $A\omega$) to determine the interfacial instabilities, which is characterized by the vibrational Froude number in the following analysis. Compared with the thresholds for the onset of the interfacial waves reported previously (Shyh & Munson Reference Shyh and Munson1986; Yoshikawa & Wesfreid Reference Yoshikawa and Wesfreid2011b), the current ones are larger owing to the smaller viscosity contrast (
 $10^{2}$ and
  $10^{4}$ in the present and previous studies, respectively). In figure 4, the amplitude and frequency are further non-dimensionalized as
  $A^{*} = A/R$ and
  $\varOmega = \omega R^{2}/\nu _{o}$, respectively (Yoshikawa & Wesfreid Reference Yoshikawa and Wesfreid2011a). The rationale behind this normalization is the fact that the destabilizing forces related to convective acceleration (
 $u_{r}\partial u_{\theta }/\partial r$, where
  $u_{r}$ and
  $u_{\theta }$ are velocities in the radial and azimuthal directions, respectively) and local acceleration (
 $\partial u_{\theta }/\partial t$) in the azimuthal direction are scaled as
  $(A\omega )^{2}/R$ and
  $A\omega ^{2}$, respectively (Shyh & Munson Reference Shyh and Munson1986). Both are the major driving forces for determining each regime in the map. Thus, the dimensionless amplitude (
 $A^{*}$) measures the forced convective acceleration relative to the local acceleration, which is the Keulegan–Carpenter number (Yoshikawa & Wesfreid Reference Yoshikawa and Wesfreid2011a). On the other hand, the dimensionless frequency (
 $\varOmega$) is defined to reflect the relative influences of the vibrational inertia and viscosity (Talib et al. Reference Talib, Jalikop and Juel2007). The question here is why a single droplet does not appear at
  $A \lesssim 0.14$ m (indicating that the ratio of convective acceleration to local acceleration is less than
  $\sim 2.8$); together, the boundary of multiple-droplet formation changes its slope significantly across the same value of amplitude (
 $A \simeq 0.14$ m). To address these concerns, we will look at the mechanisms that underpin each regime transition.

Figure 4. Regime map of oil–water interface stability on the amplitude ( $A$ or
  $A^{*}$)–frequency (
 $\,f_{\omega }$ or
  $\varOmega$) plane:
  $\circ$, interfacial wave;
  $\square$, single-droplet formation;
  $\vartriangle$, multiple-droplet formation;
  $\star$, emulsion state. It is noted that all symbols denote the actually tested cases and filled ones are used to show the threshold (boundary) between each regime. Solid and dashed lines denote the onsets of each instability, theoretically derived in the present study.
3.2. Trigger of interfacial waves
The interfacial waves that develop near the wall oscillate at the driving frequency owing to the relative oscillatory motion between the two immiscible liquid layers under rotational oscillations, which is different from the frozen waves observed previously (Shyh & Munson Reference Shyh and Munson1986; Yoshikawa & Wesfreid Reference Yoshikawa and Wesfreid2011b). To understand this difference, we need an insight into the key driving mechanism of interfacial waves in our system. The small-amplitude models based on the semi-infinite fluid layers in the plane geometry suggested by Yoshikawa & Wesfreid (Reference Yoshikawa and Wesfreid2011a) apply to the oscillatory flows in a horizontally vibrated system (where  $H_{i} \gg \delta _{i}$). We have
  $H/\delta _{o} \sim \boldsymbol {O}(10^{2})$ and
  $H/\delta _{w} \sim \boldsymbol {O}(10^{3})$ in the current study, and given their similarity to validated conditions of Yoshikawa & Wesfreid (Reference Yoshikawa and Wesfreid2011a,Reference Yoshikawa and Wesfreidb), it is reasonable to compare their model with our experiments (figure 5). Figure 5 also shows the characteristics of the present wave in terms of its wavenumber measured for the threshold cases (denoted by filled circles in figure 4). The wavenumber is defined as
  $k = N/R$, where the number (
 $N$) of the formed wave can be counted from the top-view visualization. The normalized wavenumber (
 $k/k_{cr}$) is dependent on the dimensionless frequency (
 $\varOmega _{cap} = \omega \lambda _{cap}^{2}/2\nu _{o}$), which is characterized by the capillary wavelength (
 $\lambda _{cap}$) (see (1.1) for the definitions of
  $k_{cr}$ and
  $\lambda _{cap}$). This trend roughly follows the small-amplitude theory, which assumes that the oscillating amplitude is smaller than the perturbation wavelength (Yoshikawa & Wesfreid Reference Yoshikawa and Wesfreid2011a). Following the approach of Yoshikawa & Wesfreid (Reference Yoshikawa and Wesfreid2011a) to distinguish components for driving instabilities, the oscillating wave observed in this configuration is a combination of velocity-induced and K–H type of instabilities rather than a pure velocity-induced instability. On the other hand, the basic driving mechanisms for interfacial waves can be derived from energy analysis (Hooper & Boyd Reference Hooper and Boyd1983; Hu & Joseph Reference Hu and Joseph1989; Boomkamp & Miesen Reference Boomkamp and Miesen1996). According to Boomkamp & Miesen (Reference Boomkamp and Miesen1996), the competition between energy
  $TAN$ (rate of work done by the interface in the tangential direction) and
  $REY$ (rate of energy transfer through Reynolds stress) is given as
  $TAN/REY = \nu _{o}/(R\omega \delta _{w})$ (see supplementary material for details), which implies that the dominant component of the instability depends on the frequency (
 $\omega$) and viscosity contrast (Yoshikawa & Wesfreid Reference Yoshikawa and Wesfreid2011a). Here, the energy ratio
  $TAN/REY \gg 1.0$ means that the velocity-induced mechanism is dominant, otherwise the K–H type of instability becomes dominant. We find that this energy ratio decreases as the frequency increases. Especially, for our frequencies of 0.5–3.5 Hz, the energy ratio is in the range 0.3–0.7. This also enables us to confirm that the combination of velocity-driven and K–H instabilities is the key driving mechanism for interfacial waves in our study. At a relatively high frequency, the K–H type of instability becomes more significant, which agrees well with Yoshikawa & Wesfreid (Reference Yoshikawa and Wesfreid2011a). Thus, it seems probable that in some parameter regimes, the threshold of classical K–H type of instability can be used to predict the onset of waves in the present configuration.

Figure 5. Wavenumber at the onset of interfacial wave ( $\circ$) with dimensionless frequency
  $\varOmega _{cap}$ (
 $= \lambda _{cap}^{2}\omega /2\nu _{o}$), together with the predictions by the small-amplitude theory (solid line) (Yoshikawa & Wesfreid Reference Yoshikawa and Wesfreid2011a) and the inviscid theory (dashed line) (Lyubimov & Cherepanov Reference Lyubimov and Cherepanov1987).
Recall that the marginal stability criterion (1.1) was introduced to explain the onset of this instability, which is valid for a high frequency (i.e.  $\varOmega = \omega R^{2}/\nu _{o} \gg 1.0$). It also indicates that there exists a vibrational Froude number (
 $Fr=A\omega /\sqrt {gH}$) for the onset of the interfacial wave. The inviscid criterion (1.1) has been used to validate the experiments (Wunenburger et al. Reference Wunenburger, Evesque, Chabot, Garrabos, Fauve and Beysens1999; Ivanova et al. Reference Ivanova, Kozlov and Evesque2001; Gaponenko et al. Reference Gaponenko, Torregrosa, Yasnou, Mialdun and Shevtsova2015; Sánchez et al. Reference Sánchez, Yasnou, Gaponenko, Mialdun, Porter and Shevtsova2019). Gaponenko et al. (Reference Gaponenko, Torregrosa, Yasnou, Mialdun and Shevtsova2015) examined the minimum vibrational Froude number at which the interfacial stability was triggered. Following this, we measured that the minimum (critical) vibrational Froude number for the transition to the interfacial wave regime is
  $Fr_{cr}^{IW}=A\omega |_{cr}^{Fr}/\sqrt {gH}=1.33\pm 0.02$, where
  $\omega |_{cr}^{Fr}$ is the critical frequency based on the minimum
  $Fr$ when the amplitude
  $A$ is given. This is smaller than the value of
  $7.44$, obtained by the inviscid prediction (1.1). It also follows that the inviscid theory generally overestimates the threshold owing to the viscosity contrast between liquids (Talib et al. Reference Talib, Jalikop and Juel2007). Taking the critical
  $Fr$ of
  $1.33$, the corresponding forcing velocity (i.e. boundary of the instability to interfacial wave) can be obtained as follows:
 \begin{equation} A\omega|_{cr}^{Fr} = 1.33\sqrt{gH} = 0.93\quad \text{or}\quad A|_{cr, IW}^{Fr} = 0.93\omega^{{-}1}. \end{equation}
 In figure 4, we have plotted the curve (3.1), without any fitting coefficients, and it shows a good agreement with the measured thresholds (filled circles). It is noted that at  $\varOmega > 180$ (or
  $A^{*} \le 2.8$), there is a slight deviation (underestimation) of
  $A_{cr}$ by (3.1). This is because the viscous effect plays a role in the present onset of interfacial waves, as shown in figure 5; that is, the critical
  $Fr$ increases and reaches that of the inviscid theory as
  $\varOmega$ increases. Similarly, Talib et al. (Reference Talib, Jalikop and Juel2007) showed that
  $Fr_{cr}$ begins to increase with
  $\varOmega$ when
  $\varOmega > 200$.
3.3. Mechanism of single-droplet formation
As the vibrational Froude number  $Fr$, being proportional to both
  $\omega$ and
  $A$, increases beyond the threshold of (3.1), droplet formation is stimulated at certain thresholds. As shown in figure 2(b), instead of the phenomenon of complete or partial coalescence (Ray, Biswas & Sharma Reference Ray, Biswas and Sharma2010), the observed single droplet keeps bouncing on the vibrating interface where peak acceleration (i.e.
  $A(2\omega )^{2}=4.0g$–
 $8.2g$) is larger than gravitational acceleration (Couder et al. Reference Couder, Fort, Gautier and Boudaoud2005). Since this has not been experimentally observed in rotational oscillation, we focus on its mechanism in more detail. To understand the characteristics of single-droplet formation, the interface dynamics at the core area was visualized for the case of
  $\varPhi _{o} = 165^{\circ }$ and
  $\,f_{\omega } = 1.75$ Hz (figure 6a). We find that the curvature of the interface during downward motion is much greater than that of upward motion (refer to the blue curve for the case of single-droplet formation in figure 6b), implying that the profile of the interface becomes steeper on the downward path (see
  $t^{*}=1.79$, figure 6a). Later, a falling jet was induced at the centre area (
 $t^{*}=2.24$ in figure 6a). As the interface sags towards the lowest point, a droplet breaks off from the falling jet. We believe that the variation in the interface curvature is related to the single-droplet formation, and the related instability mechanism is analogous to the breakage of a gravity wave on a surface into droplets because of the destabilization caused by a falling jet (Longuet-Higgins & Dommermuth Reference Longuet-Higgins and Dommermuth2001). By post-processing the visualized interface profiles, we measured the inclination angle (
 $\alpha$) of the interface associated with its curvature (
 $\kappa$) against the central axis and width (
 $x$) between the inflection point and central axis (Longuet-Higgins Reference Longuet-Higgins2001), as shown in figure 3. Figure 6(b) compares the variation of
  $\alpha$ against the dimensionless interface curvature (
 $\kappa R$) for representative cases with and without single-droplet formation. The data were obtained for the time duration of
  $t^{*} = 0 - 2.0$, that is, from the initial upward rise of the interface to the subsequent downward motion. The polar plots of (
 $\kappa R, \alpha$) (direction of time advance is shown by the dashed arrow) are very different from each other:
  $\alpha$ increases sharply and reaches the maximum value with increasing curvature when the single droplet forms, but the initially high
  $\alpha$ returns to the value for the case where a single droplet is not formed, as the interface moves upward and downward. To comprehensively understand the dynamics of the interface, we used particle image velocimetry to measure the velocity field around the interface in the oil layer (detailed in the supplementary material) to analyse the forces acting on the interface. Longuet-Higgins & Dommermuth (Reference Longuet-Higgins and Dommermuth2001) explained that the initial rise velocity of the interface determines the differences in the subsequent interface kinematics. We find that there is a critical rise velocity of the oil–water interface that causes the angle of inclination beyond the critical value of
  $\alpha \simeq 60^{\circ }$ (figure 6b), which leads to the formation of a single droplet. To estimate the rise velocity, we measured the maximum rise of the interface (
 $h_{1}$) and time (
 $t_{1}$) taken to reach it (see the bottom of figure 1b). According to Yoshikawa & Wesfreid (Reference Yoshikawa and Wesfreid2011b), the balance between the hydrostatic pressure (
 $\Delta \rho gh$) and the pressure difference induced by the centrifugal force (
 $\Delta P_{cen} = \int \rho _{o}u_{\theta }^{2}/r\textrm {d}r \sim \rho _{o}(A\omega )^{2}$) in the oil layer leads to the vertical movement of the interface at the centre of the container. This indicates that the maximum rise is dependent on the vibrational Froude number. To verify this, the maximum interface rise at the first cycle (
 $h_{1}/A$) is plotted against the vibrational Froude number in figure 7(a). The data from different angular amplitudes (
 $\varPhi _{o} = 120^{\circ } - 180^{\circ }$) collapse onto a single curve, which fits well with the power-law equation of
  $h_{1}/A=c_{1} Fr^{n_{1}}$, where the prefactors
  $c_{1}$ and
  $n_{1}$ are
  $0.074$ and
  $2/3$, respectively, which corroborates our understanding. It is noted that the value of the prefactor changes depending on the density difference. While the maximum rise of the interface at a given amplitude of oscillation is determined by
  $Fr$, it is found that the data show a deviation from the expected at
  $Fr \gtrsim 2.2$, corresponding to
  $\,f_{\omega } \gtrsim 1.9$ Hz. This is because the oscillation (inertial) time scale (
 $\omega ^{-1} \sim O(10^{-2}$) s) becomes comparable to the viscosity time scale (
 $L^{2}/\nu _{o} \sim O(10^{-2}$) s) as
  $Fr$ becomes larger. Here, the characteristic length
  $L$ is the length scale of the invading part of the oil into water in the near-wall region, which is
  $O(1)$ mm. On the other hand, the time (
 $t_{1}\omega$) taken to reach
  $h_{1}$ is fully dependent on the dimensionless frequency
  $\varOmega$, which can also be rewritten as
  $2 R^{2}/\delta _{o}^{2}$ (figure 7b), which includes the thickness of the Stokes boundary layer (
 $\delta _{o}=\sqrt {(2\nu _{o})/\omega }$) developing from the wall (i.e. viscous effect) towards the centre of the container in the oil layer. Again, this relation fits well with the power-law equation as
  $t_{1}\omega = c_{2}\varOmega ^{n_{2}}$ (
 $c_{2} = 0.146$ and
  $n_{2} = 0.73$). Thus, the time for the first maximum rise of the interface is solely determined by the driving frequency and is not affected by the amplitude. Based on the relationship shown in figure 7(a,b), we can derive the dimensionless rise velocity of the interface as follows:
 \begin{equation} V_{rs}/(A\omega) = c_{1}/c_{2} Fr^{2/3} \varOmega^{{-}0.73}. \end{equation}
Here,  $V_{rs}$ represents the mean rise velocity (
 $(1/t_{1})\int _{0}^{t_{1}}v(t,0)\,\textrm {d}t$) of the interface centre during
  $t_{1}$.

Figure 6. (a) Sequential visualization of oil–water interface in the core region during upward and downward motions (single-droplet formation case of  $\varPhi _{o} = 165^{\circ }$ and
  $\,f_{\omega } = 1.75$ Hz). Arrows indicate the direction of interface deformation. (b) Variations of
  $\alpha$ with dimensionless curvature (
 $\kappa R$) for the cases without (
 $\circ$,
  $\varPhi _{o} = 150^{\circ }$ and
  $\,f_{\omega } = 1.8$ Hz) and with (
 $\square$,
  $\varPhi _{o} = 180^{\circ }$ and
  $\,f_{\omega } = 1.6$ Hz) single-droplet formation. In (b), the dashed lines with arrows mean the direction of time lapse and solid arrows highlight the position where the interface reaches the maximum rise.

Figure 7. (a) Dimensionless first maximum axial rise of the interface versus  $Fr$. (b) Variation of the dimensionless time with
  $\varOmega = \omega R^{2}/\nu _{o}$. (c) Plots of dimensionless rising velocity (
 $V_{rs}$) and critical rising velocity (
 $V_{rs,cr}$) of the interface versus
  $Fr$. Circles mark the experimental data points. An intersection point for
  $\varPhi _{o}=180^{\circ }$, for example, is highlighted by the dashed vertical line. (d) Variations of dimensionless diameter of the single droplet with
  $\,f_{\omega }$. In (a,b,d):
  $\blacktriangle$,
  $\varPhi _{o}=120^{\circ }$;
  $\vartriangle$,
  $130^{\circ }$;
  $\blacklozenge$,
  $140^{\circ }$;
  $\lozenge$,
  $150^{\circ }$;
  $\blacksquare$,
  $155^{\circ }$;
  $\square$,
  $160^{\circ }$;
  $\blacktriangledown$,
  $165^{\circ }$;
  $\star$,
  $167.5^{\circ }$;
  $\triangledown$,
  $170\,^{\circ }$;
  $\bullet$,
  $175^{\circ }$;
  $\circ$,
  $180^{\circ }$.
In figure 7(c), the relationship (3.2) is plotted for  $\varPhi _{o} = 120^{\circ } - 180^{\circ }$, and the critical
  $V_{rs}$ for which the single-droplet formation was observed (for
  $\varPhi _{o} = 165^{\circ } - 180^{\circ }$) are denoted by filled circles on the corresponding curves. At a given
  $Fr$,
$Fr$,  $V_{rs}$ increases with increasing angular amplitude of the oscillation. The critical velocity of the initial rise interface (
 $V_{rs,cr}$) that is independent of the mean rise velocity (3.2) is assumed to be related to the parameter set of
  $(\rho _{i},\nu _{i},\sigma ,A,\omega ,H)$, where
  $A = R\varPhi _{o}$. During the initial upward motion at the centre region, the surface tension and gravitational forces play the role of a restoring force against the pressure difference induced by the centrifugal force. Thus, for the characteristic length and frequency scales in the capillary-gravitational form, we adopted the capillary length (
 $\lambda _{cap}$) and frequency (
 $\omega _{g} = (g/\lambda _{cap})^{1/2}$), respectively. Through dimensional analysis (i.e. the Pi-theorem), we can obtain the dimensionless critical velocity, expressed as
  $V_{rs,cr}/(A\omega ) = f(A\omega /(\omega _{g}\lambda _{cap}), H/\lambda _{cap}, \rho _{o}/\rho _{w}, \nu _{o}/\nu _{w})$, composed of the dimensionless driving velocity, dimensionless thickness of the fluid layer, density ratio and viscosity contrast. For a fixed fluid system (e.g. density ratio and viscosity contrast), the critical velocity will be characterized by the Froude number; it is noted that
  $A\omega /(\omega _{g}\lambda _{cap}) = Fr(H/\lambda _{cap})^{1/2}$. Thus, the critical velocity of the initial interface rise can be expressed as
  $V_{rs,cr}/(A\omega ) = c_{3}Fr^{n_{3}}$ based on a simple power-law equation, in which the other dimensionless parameters are reflected in
  $c_{3}$. With the prefactor
  $c_{3} = 0.021$ and power
  $n_{3} = -0.48$, the power-law equation agrees with the measured thresholds for
  $\varPhi _{o} = 165^{\circ } - 180^{\circ }$ at which the single droplet was generated (figure 7c). It is further formulated that the critical vibrational Froude number (
 $Fr|_{cr}^{SD}$) for the onset of the single-droplet formation regime corresponds to the intersection of the curves of
  $V_{rs}$ and
  $V_{rs,cr}$. Thus, it can be expressed as
 \begin{equation} Fr|_{cr}^{SD} = \left(\frac{c_{2}c_{3}}{c_{1}}\varOmega^{0.73}\right)^{0.872}\quad \text{or}\quad A|_{cr,SD}^{Fr}=0.34\omega^{{-}0.36}. \end{equation}
 From the viewpoint of surface-tension-driven instability involved in a falling jet (Eggers & Villermaux Reference Eggers and Villermaux2008), the breakup condition can be drawn from the imbalance between the capillary time scale  $(\rho _{w}d^{3}/\sigma )^{1/2}$ and the downward (falling) acceleration time scale of the jet
  $(\rho _{w}/\rho _{o})^{1/2}d/u_{d}$ (Marmottant & Villermaux Reference Marmottant and Villermaux2004a,Reference Marmottant and Villermauxb). Here,
  $d$ is the diameter of the droplet, and the downward velocity (
 $u_{d}$) of the jet is of the same order of magnitude as the rise velocity of the interface (
 $u_{d} \sim V_{rs}$). Hence,
  $d$ can be expressed as
 \begin{equation} d \sim (\sigma/\rho_{o})V_{rs}^{{-}2}. \end{equation}
The variation in the dimensionless diameter ( $d/A$) with
  $\,f_{\omega }$ for
  $\varPhi _{o} = 165^{\circ } - 180^{\circ }$ is plotted in figure 7(d). The droplet size decreases gradually with increasing
  $\,f_{\omega }$; however, it tends to increase with increasing
  $\varPhi _{o}$. We were able to optically detect droplets as small as
  $200 - 300\ \mathrm {\mu }$m for the case of
  $\varPhi _{o} = 165^{\circ }$ and
  $\,f_{\omega } = 1.8$ Hz. Based on the measured data (
 $\varPhi _{o} = 165^{\circ } - 180^{\circ }$), we found that the droplet size was scaled as
  $d \sim \omega ^{-2/3}$ by fitting a power law, as shown in figure 7(d). The overall trend is in good agreement with the measured values. Then, (3.4) can be rewritten together with the relationship (3.2) as
  $A \sim \omega ^{-0.36}$. This is consistent with the thresholds given by (3.3), and we understand that the interfacial tension affects the droplet size as well as the thresholds for its onset. As shown in figure 4, the present theoretical prediction (3.3) agrees well with the experimental data (filled squares) for
  $\varPhi _{o} = 165^{\circ } - 180^{\circ }$ (
 $A^{*} > 2.88$). Interestingly, unlike the predictions, the single droplet has not been experimentally detected when
  $A^{*} \lesssim 2.8$ (
 $\varPhi _{o} \le 160^{\circ }$). This indicates that the inclination angle of the interface is below
  $60^{\circ }$, which is the threshold for destabilizing the falling jet, although the rise velocity exceeds the critical value (figure 6b). Based on the velocity field around the interface (see figures S5 and S6 in the supplementary material), we found that the interaction between the interface and surrounding liquids (especially forces exerted by fluids on the interface) leads to unusual behaviour of the interface, in which the curvature and inclination angle both decrease (as in the case without forming a single droplet) during downward motion, despite having a higher rise velocity exceeding the critical condition for single-droplet formation.
We now investigate the forces acting on a fluid particle at the oil–water interface to understand the reasons for not forming a single droplet at  $A^{*} \lesssim 2.8$, where liquid velocity fields were obtained by particle image velocimetry (see the supplementary material). Following the well-known viscous effect propagating from an oscillating wall (Schlichting & Gersten Reference Schlichting and Gersten2016), the Stokes boundary layers develop on the sidewall during the rotational oscillation, in both the oil and water layers (Yoshikawa & Wesfreid Reference Yoshikawa and Wesfreid2011b). Based on the theoretical solution of the second Stokes problem (flow around an oscillating wall), the mathematical formulation of the Stokes boundary-layer thickness is derived as
  $\delta _{i} = \sqrt {2\nu _{i}/\omega }$ (Schlichting & Gersten Reference Schlichting and Gersten2016). Because of the thin boundary layer in water (
 $\delta _{w}/R \ll 1.0$), we primarily focused on the effect of the Stokes boundary layer developing in oil on a fluid particle at the interface, as shown in figure 8(a). The Stokes boundary-layer thickness (
 $\delta _{o}$) allows us to quantitatively distinguish the core region (
 $0 < r/R < 1-\delta ^{*}$) and near-wall region (
 $1-\delta ^{*} < r/R < 1.0$). Here,
  $\delta ^{*}$ is defined as
  $4.6\delta _{o}/R$, of which the numerator,
  $4.6\delta _{o}$, represents the position of
  $u_{\theta }/(A\omega ) \simeq 0.01$, which in Schlichting & Gersten (Reference Schlichting and Gersten2016) was experimentally confirmed (figure S4b in the supplementary material). Interfacial waves first occurred in the near-wall region. The most noticeable distinction between the core and near-wall regions is the induced flow field, which causes the azimuthal velocity (
 $u_{\theta }$) to reduce to zero in the former (inviscid core) but varies along
  $r$ in the latter, affecting the forces acting on the interface. Neglecting the effect of interfacial tension (Weber number representing the ratio of centrifugal to surface tension force,
  $We = \rho _{o}(A\omega )^{2}R/\sigma = 2-3 \times 10^{3} \gg 1.0$), the gravitational body force (
 $g$), and forces (
 $\dot {u_{r}}$ and
  $\dot {u_{z}}$) exerted by fluid displacements in the
  $r$ and
  $z$ directions are considered in both the regions. In the near-wall region, the centrifugal force given by
  $u_{\theta }^{2}/r$ should be considered because of the existence of an azimuthal velocity gradient in the oil layer (Goller & Ranov Reference Goller and Ranov1968). We believe that the dimensionless length scale (
 $\delta ^{*}$) for the near-wall region under the influence of the centrifugal force is key to governing the deformation pattern of the interface profile in the core region. As
  $\delta ^{*}$ increases, for example, the core region becomes narrower and a greater portion of the interface is affected by the centrifugal effect: the interface profile in the core has a larger inclination angle.

Figure 8. (a) Sketch of an example of an instantaneous interface profile in the  $r$–
$r$– $z$ plane illustrating different components of forces acting on a particle of fluid at the interface in the core and near-wall regions. Note that the inset highlights the local shear instability of the interfacial wave in the near-wall region. (b) Competition between dimensionless maximum axial rise (
 $h_{1}^{*} = h_{1}/H$) and length scale (
 $\delta ^{*}$) of Stokes boundary layer with
  $Fr$ for different angular amplitudes. Circle markers denote the intersection points.
As explained, the centrifugal effect yields the pressure difference ( $\Delta P_{cen}$) in the oil layer, which is balanced by the hydrostatic pressure (i.e. gravitational effect) to determine the maximum vertical displacement (
 $h_{1}$) of the interface at the centre. Based on this, we suggest that the competition between
  $\delta ^{*}$ and
  $h_{1}^{*}\ (= h_{1}/H)$ (reflecting the centrifugal and gravitational effects, respectively) governs the behaviour of the interface. In figure 8(b), we plot
  $\delta ^{*}\ (= 4.6\sqrt {2\nu _{o}/(\omega R^{2})})$ and
  $h_{1}^{*}\ (= c_{1}(A/H)Fr^{2/3})$ against
  $Fr$ while varying
  $\varPhi _{o}$. As expected,
  $\delta ^{*}$ and
  $h_{1}^{*}$ show an opposing trend with increasing
  $Fr$, and both decrease with decreasing
  $\varPhi _{o}$. For a given
  $\varPhi _{o}$, two curves can cross at a certain
  $Fr$, and we find that it corresponds to the critical condition (
 $Fr_{cr}^{SD - MD}$) for the transition from single-droplet to multiple-droplet formation. As
  $\varPhi _{o}$ decreases,
  $Fr_{cr}^{SD - MD}$ increases but the intersection point between
  $\delta ^{*}$ and
  $h_{1}^{*}$ gradually goes down. Thus, it is understood that the centrifugal effect is dominant at
  $Fr < Fr_{cr}^{SD - MD}$ (i.e.
  $\delta ^{*} > h_{1}^{*}$) in determining the deformation of the interface in the core region, whereas the gravitational effect is dominant at
  $Fr > Fr_{cr}^{SD - MD}$, such that the falling jet does not form at the core region. For
  $Fr_{cr}^{SD - MD}$, it needs to satisfy
  $\delta ^{*} = h_{1}^{*}$, and we have
 \begin{equation} Fr|_{cr}^{SD\text{--}MD} = \left(\frac{1}{c_{1}}\delta^{*}\frac{H}{A}\right)^{3/2}\quad \text{or}\quad A|_{cr,SD\text{--}MD}^{Fr}=0.81\omega^{{-}0.7}. \end{equation}
 In figure 4, the relationship (3.5) is shown together, and interestingly, we find that the boundary given by (3.5) crosses that of (3.3) near  $A \simeq 0.135$ m (
 $\varPhi _{o} = 155^{\circ }$). For
  $A \simeq 0.14$ m (
 $\varPhi _{o} = 160^{\circ }$), the critical frequency (
 $\,f_{\omega } = 1.93$ Hz) for the single-droplet formation predicted by (3.5) agrees well with the prediction (
 $\,f_{\omega } = 1.90$ Hz) by (3.3); hence, the regime of single-droplet formation is accurately predicted by (3.3) and (3.5). Based on this model, it is possible to explain why a single droplet is formed in a specific range of frequencies and amplitudes. To form a single droplet, (i) the rise velocity of the interface needs to exceed a critical value (by vibrational inertia) and (ii) the length scale (
 $\delta ^{*}$) of the Stokes boundary layer (by the viscous effect) should be larger than the maximum rise (
 $h_{1}^{*}$, gravitational effect) to form a falling jet at the core region. When
  $\,f_{\omega } > 1.90$ Hz or
  $\varPhi _{o} \le 160^{\circ }$ (corresponding to
  $A \le 0.14$ m or
  $A^{*} \le 2.80$), these conditions are not satisfied.
To date, it is known that single-droplet formation in the present study was induced by the falling jet, which requires the necessary conditions (i) and (ii) given above, and subsequent surface-tension-driven instability of such a jet (scaling analysis). In particular, the dimensionless length scale of the Stokes boundary layer developed from the container wall ( $\delta ^{*}$) is highly relevant to the formation of a falling jet. It is conceivable that the viscosity and domain size (i.e. radius of the container) influence the single droplet in the present configuration. According to our findings, a higher viscosity (or smaller domain) will cause the Stokes boundary layer (
 $\delta ^{*}>1$) to cover the entire region (Shyh & Munson Reference Shyh and Munson1986; Yoshikawa & Wesfreid Reference Yoshikawa and Wesfreid2011b), but a lower one (or larger domain) makes it difficult to satisfy the condition of
  $\delta ^{*} \ge h_{1}^{*}$, both of which will inhibit the formation of a falling jet. For single-droplet formation in the present configuration, therefore, we cannot consider viscosity contrast and domain size in isolation, but their combined effect. A complete understanding of this is beyond the scope of the present work.
3.4. Multiple-droplet formation and emulsion state
When the conditions derived in § 3.3 are not satisfied by the forcing amplitude, multiple droplets (and emulsification) occur after the interfacial waves at the near-wall region have grown into finger-like patterns (figure 2c,d). For this type of fingering phenomenon, the penetrating parts of one fluid into the other are sheared by the surrounding fluid (see the inset of figure 8a) (Thorpe Reference Thorpe1978; Jalikop & Juel Reference Jalikop and Juel2009; Yoshikawa & Wesfreid Reference Yoshikawa and Wesfreid2011b). Since we have observed that multiple droplets first appear near the wall, it is reasonable to assume that a sufficiently large amplitude of wavy deformation would encourage their breakage owing to the local shear-driven instability (Jalikop & Juel Reference Jalikop and Juel2009). A physical model was proposed for this type of instability based on the assumption that the sharp tip structure, that is, the ligament or filament developing on the interfacial wave (Anthony et al. Reference Anthony, Kamat, Harris and Basaran2019; Wang et al. Reference Wang, Contò, Naz, Castrejón-Pita, Castrejón-Pita, Bailey, Wang, Feng and Sui2019), ruptures when the viscous shear stress exerted by the surrounding fluid exceeds the surface tension. The surface tension force ( $\sigma {\rm \pi}d_{tip}$) per unit mass (
 ${\rm \pi} \rho _{i}d_{o}^{3}/6$) is
  $F_{\sigma } = (6\sigma d_{tip})/(\rho _{i}d_{o}^{3})$, where
  $d_{tip}$ is the diameter of the finger tip and
  $\rho _{i}$ (subscript ‘
 $i$’ may represent oil (‘
 $o$’) or water (‘
 $w$’)) is the density of the droplet. In general, the mean diameter (
 $d_{o}$) of the droplet is related to the tip size,
  $d_{o} \sim d_{tip}$ (James et al. Reference James, Smith and Glezer2003; Puthenveettil & Hopfinger Reference Puthenveettil and Hopfinger2009), and is also proportional to the wavelength at which the breakage occurs,
  $d_{o} \sim \lambda _{m}$ (Lang Reference Lang1962; Marmottant & Villermaux Reference Marmottant and Villermaux2004b). Thus, the surface tension force can be rewritten as
  $F_{\sigma } \sim 6\sigma /\rho _{i}\lambda _{m}^{-2}$.
On the other hand, the viscous shear stress exerted by the azimuthal shearing flow in the near-wall region is given by  $F_{\nu } \sim \nu _{i} u_{\theta }/r^{2}$. By scaling
  $r \sim \delta _{i}$ (Stokes boundary-layer thickness) and
  $u_{\theta } \sim A\omega$ (Yoshikawa & Wesfreid Reference Yoshikawa and Wesfreid2011b), we have
  $F_{\nu } \sim A\omega ^{2}$. According to Jalikop & Juel (Reference Jalikop and Juel2009), the finger-like pattern forms in a strongly nonlinear regime, where wave development is defined by the capillary effect. Meanwhile,
  $\lambda _{m}/\lambda _{cap}$ would be much smaller than
  $1.0$, based on
  $\lambda > \lambda _{m}$ (Marmottant & Villermaux Reference Marmottant and Villermaux2004b) and the experimentally measured values of wavelength
  $\lambda /\lambda _{cap} \simeq 0.08 - 0.1$, which indicate that the tip structure has the features of capillary waves (see figure 8a). For capillary waves, the wavelength at the breakage (
 $\lambda _{m}$) follows the capillary dispersion relationship based on the inviscid theory, although the viscous effect is included in the problem (Donnelly et al. Reference Donnelly, Hogan, Mugler, Schommer, Schubmehl, Bernoff and Forrest2004; Puthenveettil & Hopfinger Reference Puthenveettil and Hopfinger2009). Therefore, the balance of
  $F_{\sigma } \sim F_{\nu }$ on the tip structure complying with the capillary dispersion relationship
  $\omega ^{2} = \sigma /\rho _{i}\lambda _{m}^{-3}$ (Landau & Lifshitz Reference Landau and Lifshitz1987) provides the thresholds for the onset of multiple-droplet formation:
 \begin{equation} A|_{cr,MD} \sim 6(\sigma/\rho_{i})^{1/3}\omega^{{-}2/3}. \end{equation}
For multiple-droplet formation, we observed that multiple water droplets formed slowly in the oil layer; however, in the emulsion state, oil droplets appear quite fast in the water layer. Considering the corresponding densities of droplets for multiple droplet and emulsion, the prefactors of (3.6) are determined as  $3.69$ and
  $4.24$, respectively, for each regime by fitting to the experimental data. There is a slight deviation for the onset of multiple-droplet formation at
  $\,f_{\omega } > 1.9$ Hz, and it is linked to the fact that the viscous energy dissipation should be considered during the penetration of a wave tip into another more viscous fluid. Similar to the energy dissipation proposed by Goodridge et al. (Reference Goodridge, Shi, Hentschel and Lathrop1997), the viscous energy dissipation of the penetrating fluid tip is expressed as
  $\epsilon _{\nu } = \nu _{o} (u_{tip}/\lambda _{m})^{2}$. Here,
  $u_{tip}$ is the characteristic velocity of the penetrating tip (
 $u_{tip} = l\omega$, where
  $l$ is the characteristic length of the tip structure). The tip length is generally related to the wavelength at the breakage (
 $l \sim \lambda _{m}$) (Eggers & Villermaux Reference Eggers and Villermaux2008), and the ratio of
  $l/\lambda _{m}$ is approximately
  $2.30$. The maximum
  $l/d_{tip} \simeq 10$ is achieved before breakup, and on average it was
  $\langle d_{tip}\rangle /\lambda _{m} \simeq 0.23$ (Marmottant & Villermaux Reference Marmottant and Villermaux2004b). Thus, the viscous dissipation can be rewritten as
  $\epsilon _{\nu } = \nu _{o} (2.30\omega )^{2}$. Because the power (
 $p$) required for breaking the tip is associated with the shear force (
 $F_{\nu }$) and the forcing velocity (
 $A\omega$) as
  $p \sim F_{\nu }(A\omega )$, the balance of power input and viscous energy dissipation yields
 \begin{equation} A|_{cr,MD}^{viscous} \sim 2.30\nu_{o}^{1/2}\omega^{{-}1/2}. \end{equation}
 Finally, we plot the relationship (3.7) (with a prefactor of  $21.74$, determined by the linear regression) in figure 4. Compared to (3.6), now the prediction by (3.7) performs better even at a higher frequency range. In particular, the intersection between the relationships (3.6) and (3.7) is found at
  $\,f_{\omega } \simeq 1.9$ Hz, which corresponds to the critical frequency at which the viscous effect should be considered for forming multiple droplets in the near-wall region. Considering the stabilizing role of viscosity (
 $\nu _{u}/\nu _{l} \le 10$) and the pure velocity-induced mechanism (
 $\nu _{u}/\nu _{l} \ge 10^{4}$) for wave instability, where
  $\nu _{u}/\nu _{l}$ is the viscosity contrast of upper and lower liquids (Talib et al. Reference Talib, Jalikop and Juel2007; Yoshikawa & Wesfreid Reference Yoshikawa and Wesfreid2011b), the effect of viscosity on the multiple-droplet regime boundaries is expected to be significant in those ranges of viscosity contrast.
4. Concluding remarks
In this work, we theoretically explained our experimental findings on droplet formation from an interface of two immiscible fluids (viscosity difference of  $10^{2}$), which are perturbed by a rotational oscillation. This was not previously reported, and we believe the theoretical basis in the current study can be quite useful in producing a well-controlled droplet(s) in a stably superposed two-layer fluid system, and it is also expected to be extended to the control of emulsification/demulsification processes. While establishing the theoretical model, the contribution of the viscous effect was found to be very important under rotational oscillation. In addition to single-droplet formation, regimes of interface instabilities were also identified to include oscillating waves, multiple-droplet formation and emulsion state, depending on the angular amplitude (
 $120^{\circ } - 180^{\circ }$) and frequency (0.1–3.5 Hz) of oscillation.
We found that a combination of velocity-induced and standard oscillatory K–H instabilities is responsible for the initiation of the first appearing oscillating waves in the near-wall region. The threshold predicted by our analysis based on the minimum  $Fr$ (the square root of the ratio of the vibrational force to the gravitational force) agreed well with the measurements, while the critical
  $Fr$ was much smaller than that predicted by the inviscid model, indicating the importance of the viscous effect.
To form a single droplet at the core region by strengthening the perturbations, we found that (i) the rise velocity of the interface needs to exceed a critical  $Fr$ (vibrational inertia effect) and (ii) compared with the gravitational force, the centrifugal force characterized by the length scale of the Stokes boundary layer (viscous effect) developed at the near-wall region should play a dominant role in forming a falling jet. After satisfying these conditions, the critical condition of the interface shape is determined (i.e. formation of a falling jet), and the destabilization of such a jet can be driven by surface tension (scaling analysis). As a result, the regime boundary of single-droplet formation is well estimated, indicating that the viscous effect should also be considered. For the onset of multiple-droplet formation and emulsion state, on the other hand, we proposed a physical model based on the balance of the viscous shear exerted by the surrounding fluid and the surface tension force, which again matched well with experimental results. It is worth emphasizing that the direct regime transition from the wavy interface to multiple-droplet formation skipping the single-droplet formation at a small-amplitude range was captured by considering the viscous contribution.
The current study primarily focused on the onset of various interfacial instabilities, especially for single-droplet formation. Our results suggest that the combination of viscosity and domain size (i.e. radius of the cylindrical container) may affect the formation of a single droplet. This subject is currently under investigation. Finally, we point out that the current findings may encourage more in-depth research into the interfacial dynamics that we have yet to observe, but which have significant academic and practical implications.
Supplementary material and movies
Supplementary material and movies are available at https://doi.org/10.1017/jfm.2021.628.
Acknowledgements
The authors acknowledge Professor H.-Y. Kim and Mr C. Park for help in treating the container wall with plasma.
Funding
This work was supported by a research grant (20210584) through the Korea Institute of Marine Science & Technology Promotion funded by Korea Coast Guard, research grants (2020R1A2C2014510, 2021R1A4A1032023) through the National Research Foundation of Korea and by the BK21 FOUR programme, funded by the Korean government (MSIT and MoE, respectively).
Declaration of interests
The authors report no conflict of interest.


