


The Late Pleistocene/Early Holocene archaeological record of the arid interior Columbia Plateau of the Pacific Northwest (Figure 1) is dominated by Paleoarchaic (Davis et al. Reference Davis, Willis, Macfarlan and Rhode2012) Western Stemmed Tradition (WST) materials, locally called Windust (Leonhardy and Rice Reference Leonhardy and Rice1970). There are no stratified fluted-point sites in the region, and fluted points are almost invariably found on the surface. Clovis materials are rare south of the Snake River, and except for the famous Wenatchee cache (Gramly Reference Gramly1993), even rarer north of the Snake River. In contrast, Windust sites are relatively common and occur in well-stratified deposits. Throughout the region, scholars once derived Windust from Clovis (e.g., Aikens et al. Reference Aikens, Connolly and Jenkins2011; Willig and Aikens Reference Willig, Aikens, Willig, Aikens and Fagan1988), since Clovis was thought to predate Windust, but establishing a simple relationship between Clovis and WST/Windust has become increasingly untenable (Davis et al. Reference Davis, Willis, Macfarlan and Rhode2012). Recent radiocarbon assays on WST materials from Paisley Caves in Central Oregon suggest Clovis and WST were contemporary (Jenkins et al. Reference Jenkins, Davis, Stafford, Campos, Hockett, Jones, Cummings, Yost, Connolly, Yohe, Gibbons, Raghavan, Rasmussen, Paijmans, Hofreiter, Kemp, Barta, Monroe, Thomas, P. Gilbert and Willerslev2012), and some go further, hypothesizing the continent was initially settled by stemmed-point-using peoples migrating down the Pacific coast (e.g., Dixon Reference Dixon2013; Erlandson and Braje Reference Erlandson and Braje2011; Fladmark Reference Fladmark1979). These controversies focus on the earliest timing of fluted and WST points in Western North America generally (e.g., Beck and Jones Reference Beck and Jones2010; Goebel and Keene Reference Goebel, Keene, Parezo and Janetski2014), with little attention paid to the overall duration and ending of the WST on the Columbia Plateau.

Figure 1. Map showing the study area and sites discussed in text.
In this article, we contribute to the broader discussion of WST chronology by examining the timing of Windust on the Columbia Plateau. We first construct a database of radiocarbon dates from Windust sites. We apply Bayesian modeling to the dataset to create a concise estimate of the most likely beginning, end, and span (i.e., duration) of Windust. Next, we explore Windust chronology by modeling its temporal span using various parameters and criteria to better identify places in its chronology that need further work and those that are robust regardless of data iteration. We then use this local chronology to discuss relationships between Windust and the Younger Dryas stadial, contemporaneous Paleoindian groups (e.g., Clovis and Folsom), and subsequent cultural manifestations on the Plateau. Last, we hope to demonstrate what insights these methods can provide about the timing of Windust as well as what is unresolvable with the available data.
Study Area
Our study area is a tactical unit based on hydrology and similarities in archaeological research. It is largely the Columbia Plateau in Oregon and Washington and the Snake River Plain in Idaho (Figure 1). The Columbia Plateau encompasses the arid interior of the Pacific Northwest. It stretches roughly from the Cascade Range crest in the west to the Rocky Mountains in the east and from the Okanagan Mountains in the north, along the USA-Canadian border, south to the Great Basin in southern Oregon. Prime geographic features in the region are massive Miocene basalt flows deeply incised by the Columbia River; its largest tributary, the Snake River; and lesser tributaries. We also include the Snake River Plain of southern Idaho, which is geomorphologically and ecologically an eastward extension of the plateau, although it is often culturally considered part of the Great Basin.
Western Stemmed Tradition and Windust
The WST is recognized as the oldest nonfluted lithic technology in the far West (Jenkins et al. Reference Jenkins, Davis, Stafford, Campos, Hockett, Jones, Cummings, Yost, Connolly, Yohe, Gibbons, Raghavan, Rasmussen, Paijmans, Hofreiter, Kemp, Barta, Monroe, Thomas, P. Gilbert and Willerslev2012). It takes its name from the contracting and straight stemmed points that are its diagnostic artifacts (Figure 2). Two to three primary WST point types are recognized on the Columbia Plateau (Figure 2), but regional archaeologists often refer to the stemmed or shouldered point tradition there simply as “Windust” after the type site in eastern Washington State (e.g., Leonhardy and Rice Reference Leonhardy and Rice1970). Spatially, the WST is common throughout the Columbia Plateau and the western margins of the Rocky Mountains in Idaho, as well as the neighboring Great Basin (see Beck and Jones Reference Beck and Jones2010, Reference Beck, Jones and Rhode2012; Smith and Barker Reference Smith and Barker2017). It also occurs as far north as interior southern British Columbia (e.g., Copp Reference Copp, Carlson and Magne2008:251–253; McLaren Reference McLaren and Rousseau2017; Rousseau Reference Rousseau, Carlson and Magne2008), on the Pacific coast in the Salish Sea region (e.g., Kopperl et al. Reference Kopperl, Taylor, Miss, Ames and Hodges2015; McLaren Reference McLaren and Rousseau2017), and in California (Erlandson et al. Reference Erlandson and Braje2011). For the sake of clarity, we use “WST” in reference to the stemmed tradition as a whole and “Windust” when referencing its manifestation within our designated study area.
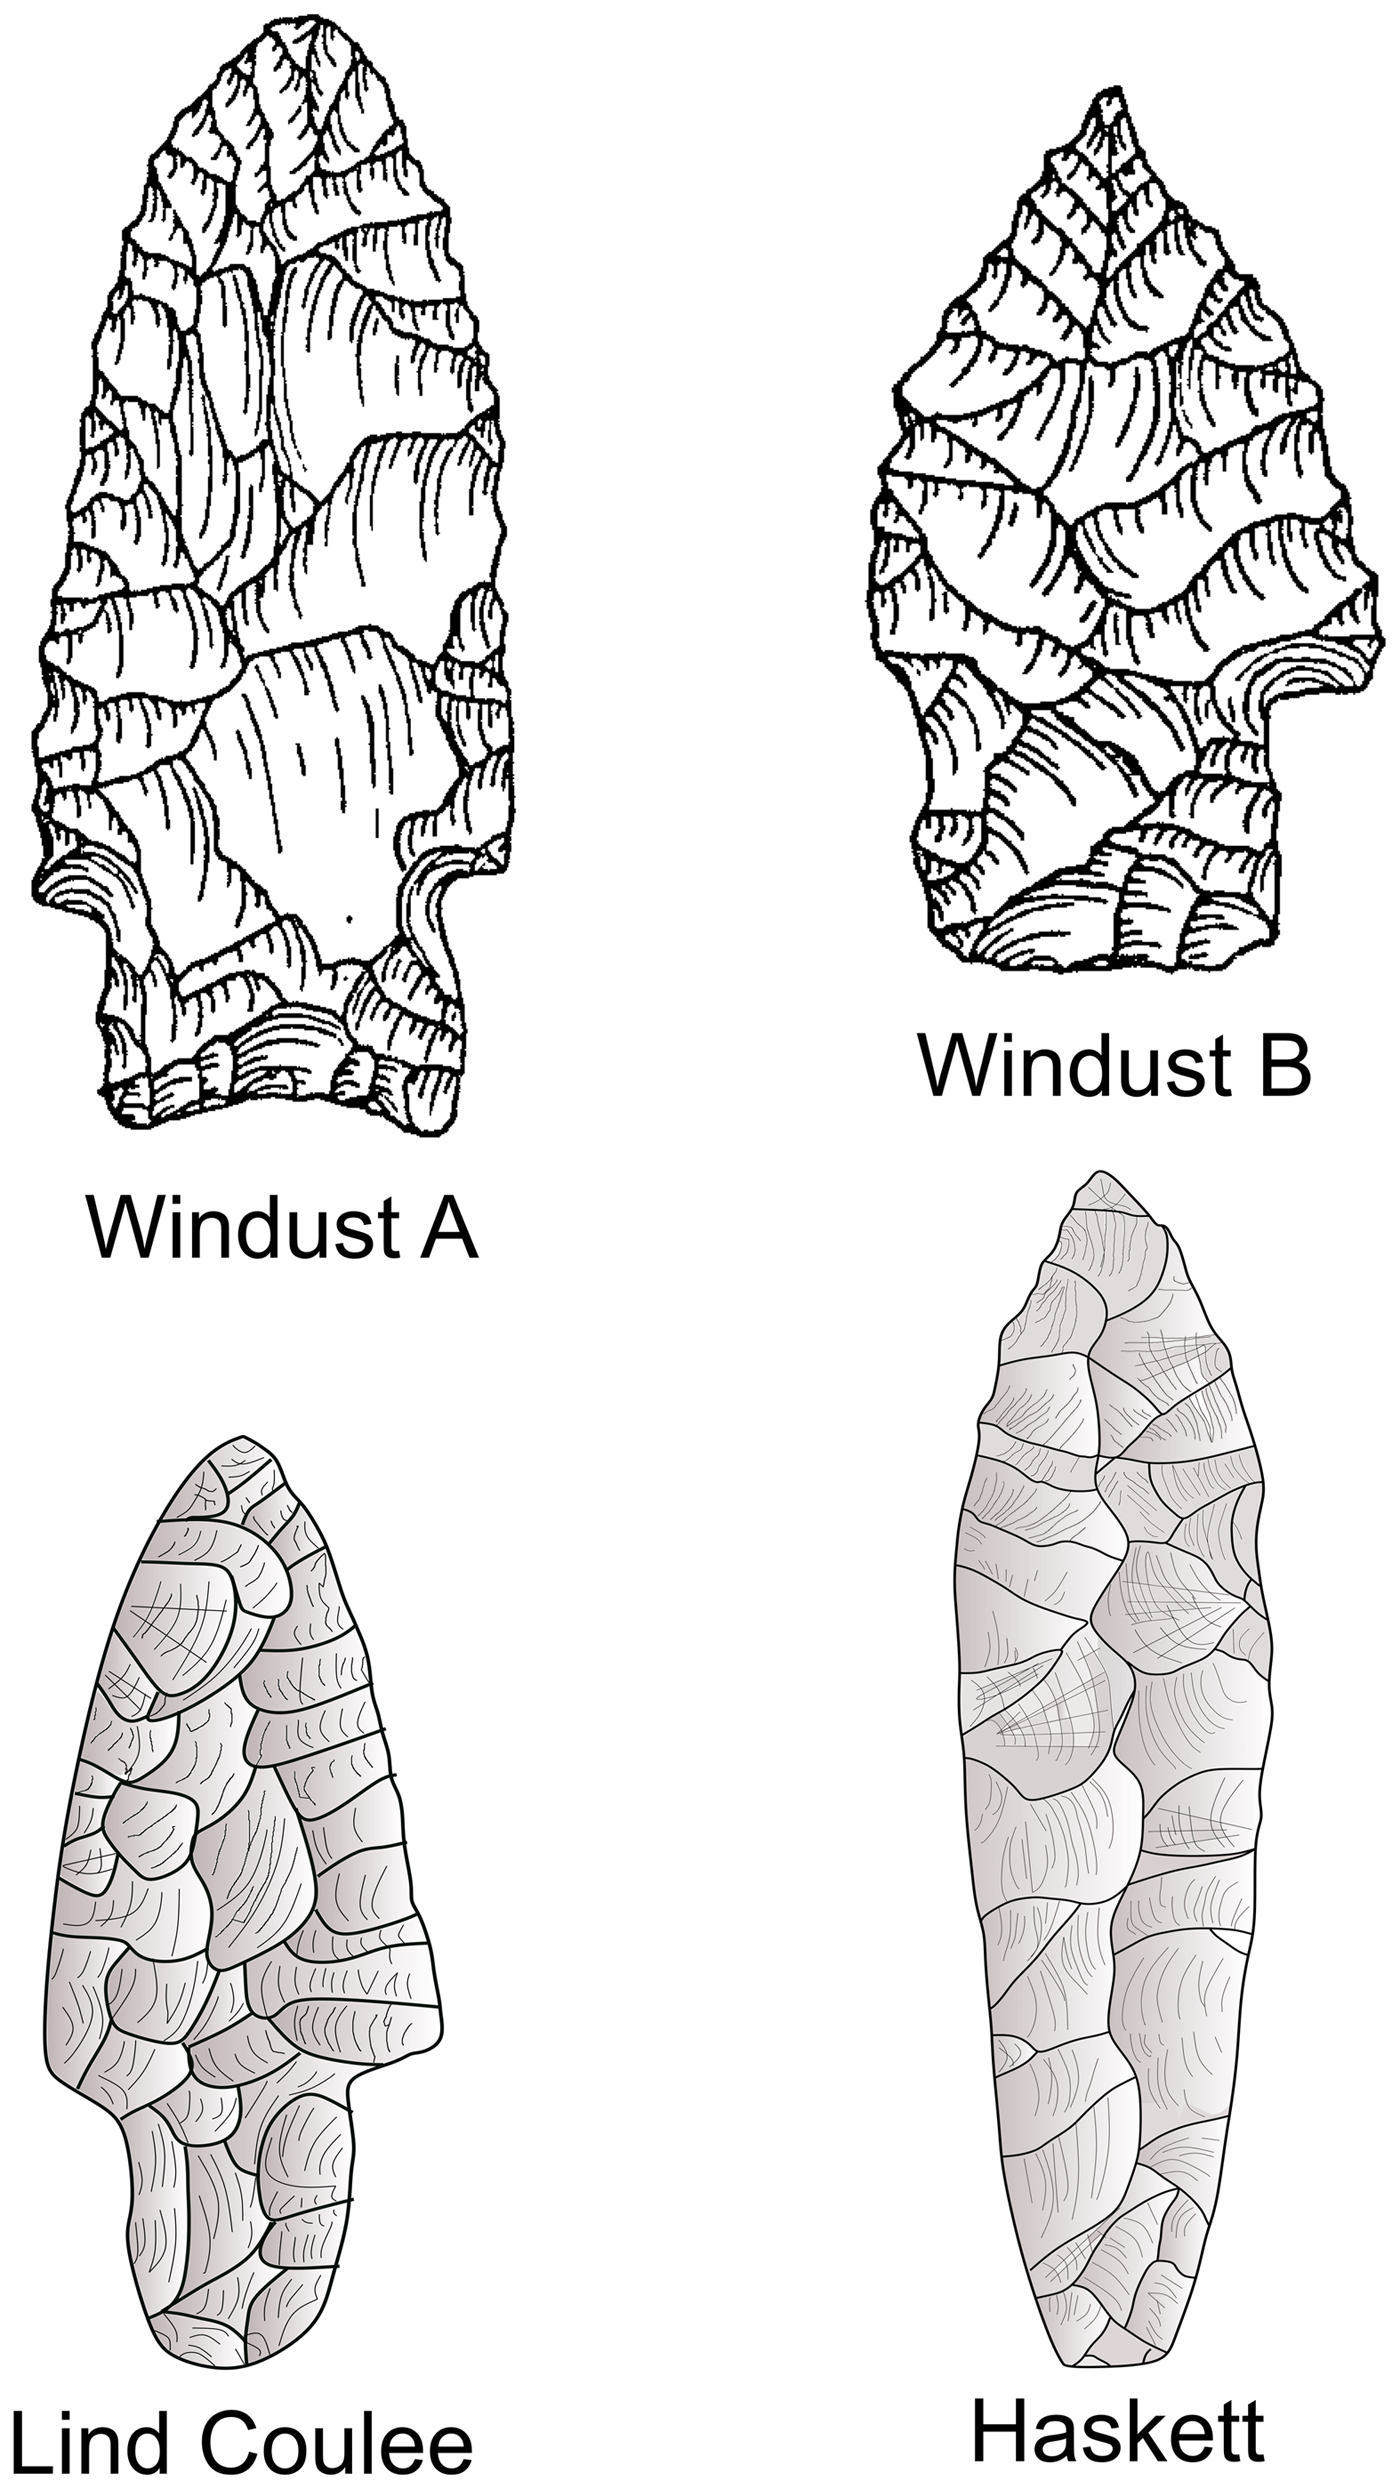
Figure 2. Typical forms of Western Stemmed Tradition styles found on the Columbia Plateau. Windust Variant A and B redrawn from Ames (Reference Ames2000); Lind Coulee and Haskett points were adapted by lead author from Irwin and Moody (Reference Irwin and Moody1978) and Sargeant (Reference Sargeant1973), respectively.
WST points are formally varied beyond their diagnostic stems and can also be identified by their distinctive reduction sequences (Beck and Jones Reference Beck, Jones and Rhode2012:31). The WST lithic toolkit is likewise varied, aimed at working a diverse array of local raw materials often emphasizing fine grained volcanics and crypto-crystalline silicates (Beck and Jones Reference Beck, Jones and Rhode2012:31). WST manufacture also employed several core forms but emphasized the production of macroflakes (Beck and Jones Reference Beck, Jones and Rhode2012:28–32; Davis et al. Reference Davis, Willis, Macfarlan and Rhode2012:47–51) and macroblades (Davis et al. Reference Davis, Bean and Nyers2017). Other general characteristics indicative of the WST include settlement patterns that suggest high mobility with some evidence for functional differentiation among localities (Ames Reference Ames, Willig and Fagan1988; Chatters et al. Reference Chatters, Hackenberger, Prentiss, Thomas, Boussman and Vierra2012; Connolly and Jenkins Reference Connolly, Jenkins and Connolly1999; Davis Reference Davis2001a). Reuse of localities over long periods (e.g., Marmes Rockshelter and Cooper's Ferry) is known, and sites are commonly found near extant and now-extinct wetlands, streams, or lakes in relatively low-energy mesic environments (Ames Reference Ames, Willig and Fagan1988, Reference Ames2000). More recent work also shows that Windust people made use of montane habitats on the plateau, though these were often found along stream and wetland environments (Chatters et al. Reference Chatters, Hackenberger, Prentiss, Thomas, Boussman and Vierra2012). Early Windust subsistence focused on broad-spectrum hunting whereas the later phase involved increased use of artiodactyls (Lyman Reference Lyman2013).
Chronological Debate about Windust
The conventional view has been that Clovis predates the WST. Bryan's (Reference Bryan, Willig, Aikens and Fagan1988) challenge to this assessment in the Great Basin was not universally accepted, but the idea that fluted and stemmed points were coeval is discussed widely in recent literature (e.g., Beck and Jones Reference Beck and Jones2010; Davis et al. Reference Davis, Willis, Macfarlan and Rhode2012; Goebel and Keene Reference Goebel, Keene, Parezo and Janetski2014; Jenkins et al. Reference Jenkins, Davis, Stafford, Campos, Hockett, Jones, Cummings, Yost, Connolly, Yohe, Gibbons, Raghavan, Rasmussen, Paijmans, Hofreiter, Kemp, Barta, Monroe, Thomas, P. Gilbert and Willerslev2012). Until recently, archaeologists on the plateau accepted that Clovis was older and treated late Pleistocene radiometric dates on Windust materials with skepticism, sometimes with good reason (e.g., Leonhardy Reference Leonhardy and Rice1970:70). However, recent reports of reliable late Pleistocene dates with WST associations (Davis et al. Reference Bryan, Willig, Aikens and Fagan2014; Jenkins et al. Reference Jenkins, Davis, Stafford, Campos, Hockett, Jones, Cummings, Yost, Connolly, Yohe, Gibbons, Raghavan, Rasmussen, Paijmans, Hofreiter, Kemp, Barta, Monroe, Thomas, P. Gilbert and Willerslev2012) have spurred renewed interest in the temporal relationship between Clovis and the WST across the West. On the plateau, much of the seminal fieldwork and radiocarbon analyses on Windust are now decades old, and more recent work, while well done, often results in wildly differing ages and time spans. Therefore, a reexamination using new techniques is necessary to determine the temporal structure of Windust on the plateau. There are two general issues with the temporal status of Windust on the plateau. First, the temporal span of WST is highly variable depending on the researcher, with some estimates for the beginning and ending differing by more than 1000 years (see Chatters et al. Reference Chatters, Hackenberger, Prentiss, Thomas, Boussman and Vierra2012; Kopperl et al. Reference Kopperl, Taylor, Miss, Ames and Hodges2015; Lohse and Schou Reference Lohse, Schou, Carlson and Magne2008; Reid et al. Reference Reid, Hughes, Root, Rondeau, Smallwood and Jennings2015). Chatters and colleagues (Reference Chatters, Hackenberger, Prentiss, Thomas, Boussman and Vierra2012) compiled the published earliest and youngest dates from 23 sites in eastern Washington, eastern Oregon, and Idaho to establish a maximal calibrated time range for WST in the Pacific Northwest of 13,500 to 9000 cal BP with the bulk of dates falling between 13,000 and 9500 cal BP. Reid and colleagues (Reference Reid, Hughes, Root, Rondeau, Smallwood and Jennings2015) synthesized uncalibrated dates from 13 WST sites in interior Washington and Idaho. They reviewed the context of dates and applied two criteria for accepting or rejecting them: dates had to be reliably associated with WST points and had to have at least two dates that overlapped at one sigma (Reid et al. Reference Reid, Hughes, Root, Rondeau, Smallwood and Jennings2015:73). These criteria reduced their sample to six sites and 21 dates (Reid et al. Reference Reid, Hughes, Root, Rondeau, Smallwood and Jennings2015:Table 4). Based on those dates, they estimated an uncalibrated time range for WST of 10,300 to 9,800 BP (~12,150–11,200 cal BP). Work by Goebel and Keene (Reference Goebel, Keene, Parezo and Janetski2014) further complicated matters by introducing entirely different standards for the acceptance or rejection of dates based on extremely restrictive criteria, which they admitted effectively eliminated the WST dataset, forcing them to arbitrarily decide which of their sets of criteria to use on a site-by-site basis. Additionally, as with most other analyses of WST chronology, almost no attention was given to rigorously determining the ending or possible duration of WST.
These studies illustrate how different methods yield different age span estimates for Windust from the same set of dates. Variability in estimates is not intrinsically an analytic problem, but the ways in which authors reach estimates is not always clear, nor are they usually discussed with reference to other estimates. Researchers also do not consistently calibrate assays; to compare Reid and colleagues with Chatters and colleagues, one must calibrate Reid and colleagues’ date sample. Moreover, there is little consistency among studies that rely on different definitions on what constitutes valid data. Additionally, many analyses focus on single dates or sites rather than on the full distribution of radiocarbon dates.
Another significant issue is that Windust chronologies often rely on Plains and Great Basin projectile point sequences (see Beck and Jones Reference Beck and Jones2010; Bryan and Tuohy Reference Bryan, Tuohy, Bonnichsen and Turnmire1999; Fiedel and Morrow Reference Fiedel and Morrow2012). While this is a well-established archaeological method, it can be problematic since the projectile point chronologies may not be the same from region to region, and the practice assumes taxonomic consistency across regions. As a result, archaeologists are hampered in addressing questions about the relationship among the WST, other cultural phases, and environmental events. As mentioned above, this problem has also been exacerbated because of WST's potential contemporaneity with Clovis, which has led researchers to focus on the genesis of WST and give less attention to understanding its termination or relationship to later cultural phenomena or climatic events.
Modeling
Our approach to these issues is to move away from focusing on individual sites or dates and instead look at Windust as a whole using Bayesian modeling. Rather than attempting to apply a strict program of chronometric hygiene to estimate the start and end dates of Windust, we develop various iterations of Windust radiocarbon dates to estimate the most likely beginning, end, and span of Windust and to investigate the effects of sample selection on the chronological results. This approach allows us to determine which portions of the chronology are most robust. Our goal is not to define the temporal span of the WST as a single value but to demonstrate what can be said about it under different parameters for the inclusion or exclusion of various dates.
Presenting results from different data iterations allows us to systematically understand the effects that certain dates, sites, assumptions, and so on have on the modeled results. Our hope is to move past arguing about specific measurements or sites and to demonstrate where WST patterns are robust in the face of any data iteration and where patterns are significantly driven by few sites or dates. We believe this to be a more productive technique for two main reasons: (1) it allows easy comparison of estimates that were calculated using the same methodology and therefore avoids discordances caused by comparing methodologically incomparable estimates, and (2) the 14C record for Windust is highly problematic, as many of the sites were excavated decades ago and, in many cases (e.g., Marmes), are no longer accessible or have been destroyed. Thus, by modeling the results in toto and under different parameters, we can assess the relative strength of data from these sites through their internal consistency rather than simply dismissing them a priori because they were excavated prior to modern criteria for ideal 14C chronologies (i.e., Goebel and Keene Reference Goebel, Keene, Parezo and Janetski2014).
Why Model?
The long history of using Bayesian models in archaeology has repeatedly shown that the method can dramatically increase the precision and accuracy of calibrated radiocarbon ranges (e.g., Bayliss et al. Reference Bayliss, Ramsey, van der Plicht and Whittle2007; Burley et al. Reference Burley, Edinborough, Weisler and Zhao2015; Ramsey Reference Bronk Ramsey2001, Reference Bronk Ramsey2009). While these models are usually applied to single site analysis, authors (Edinborough Reference Edinborough and Shennan2009; Riede and Edinborough Reference Riede and Edinborough2012; Ziedler et al. Reference Zeidler, Buck and Litton1998) have also shown their use in understanding the time spans of archaeological culture phases. These models help us conduct robust and empirically explicit analyses for understanding the beginning, end, and span of cultural phases. While simply looking at the calibrated ages of individual dates to estimate the span of archaeological cultures is not necessarily incorrect, doing so tends to significantly overestimate the actual time span, as there is no way to tell which portions of the calibrated range are more or less likely to represent the archaeological phase in question.
This more qualitative assessment method can also lead to very inconsistent estimations among researchers (Bayliss et al. Reference Bayliss, Ramsey, van der Plicht and Whittle2007; Ramsey Reference Bronk Ramsey2001, Reference Bronk Ramsey2009). Meanwhile, Bayesian models constrain the calibrated distribution of dates to meet the archaeologist's assumptions based on prior data. It is important to note that archaeologists are already making assumptions for the WST (i.e., applying Plains typologies to the Columbia Plateau or Great Basin and rejecting dates because they don't fit with assumptions about phase ages), just not as explicitly as is done here. The basic assumption made for our analyses is that the WST forms a coherent and spatially contiguous tradition (Beck and Jones Reference Beck and Jones2010; Davis et al. Reference Davis, Willis, Macfarlan and Rhode2012). As mentioned above, coherence within the WST is not based on gross morphological similarity between point styles (there is lots of variability) but on their shared production sequences, as well as overall similarity in tool kits and settlement and subsistence strategies (Beck and Jones Reference Beck and Jones2010, Reference Beck, Jones and Rhode2012; Davis et al. Reference Davis, Willis, Macfarlan and Rhode2012). This is not meant to imply that every variant of WST point has the same chronology or that there were no changes throughout the span of WST but that variant point styles and changes within settlement or subsistence practices, or both, were part of a related broader tradition.
Lastly, Bayesian models are valuable because as new data become available, they are easily added, and modeled results can systematically be updated through a statistically sound, coherent, and—perhaps most importantly—replicable framework. The last point should not be underestimated, as this framework allows us to pinpoint and productively discuss errors or omissions that lead to different analytic results.
How the Model Works
We use a standard phase model using OxCal v4.2 (see Figure 3 for details on model construction), which applies a uniform prior distribution to the data and makes the assumption that the phase has definite beginning and end dates, that dates are equally likely to be found anywhere in the phase, and that we have an accurate sample of the phase's temporal distribution (see Bronk Ramsey [Reference Bronk Ramsey2001, Reference Bronk Ramsey2009] for more detailed descriptions). Various authors have suggested that the uniform prior may be inappropriate for cultural phase modeling, and they instead suggest the use of trapezoidal or sigma (roughly normal distribution) priors (Lee and Bronk Ramsey Reference Lee and Ramsey2012; Manning et al. Reference Manning, Timpson, Colledge, Crema, Edinborough, Kerig and Shennan2014). However, we argue that the use of a uniform prior is more appropriate for WST because it is the least intrusive (thus has the least effect on the data), the distribution of dates within the phase cannot be assumed as normally distributed, and WST should not be expected to “seriate” (thus approximate normally distributed data) cleanly, as the phase is characterized by many subtypes that may vary by region and possibly function (Ames Reference Ames, Willig and Fagan1988; Lohse and Moser Reference Lohse and Moser2014; Reid et al. Reference Reid, Hughes, Root, Rondeau, Smallwood and Jennings2015). Because of the error associated with them, radiometric date estimates do not represent a point in time but ranges of possible ages that have different probabilities of being accurate, leading to noise, or “scatter.” Therefore, within any date or, as in our case, group of dates relating to an archaeological phase, it is likely that some proportion of the possible calibrated 14C ages will lie outside the true timing of the phase. This noise is responsible for imprecision and inaccurate estimations of phase lengths (Bronk Ramsey Reference Bronk Ramsey2001; Manning et al. Reference Manning, Timpson, Colledge, Crema, Edinborough, Kerig and Shennan2014), and these inaccuracies can be severe.

Figure 3. CQL code used to construct OxCal model used in analysis. Copying this code and inserting dates for each of the models will allow the reader to reproduce analysis.
The Bayesian model presented here counteracts this noise by considering the full suite of dates within the designated phase using a Markov Chain Monte Carlo (MCMC) algorithm that reconciles distributions of calibrated dates within the model by repeatedly resampling the data until it arrives at the highest probable calibrated range for each date that is both consistent with the other dates and with the structure of the model. This model also provides a 95% confidence estimate for the beginning and end (boundary start and boundary end commands), as well as the temporal span (span command) of the phase. In effect, this means that the few dates with high errors will give very large ranges for the estimated beginning and end of a phase, whereas more dates with less error will provide tighter and more precise estimations for the beginning and ending of a phase. This is because larger sample sizes increase the certainty that the spread of ages captured within the model are an accurate representation of the span.
To further assess the validity of our assumption that Windust does, in fact, constitute a coherent phase, OxCal also calculates how well the data conform to the model parameters through an agreement index, which gives a measure of fit between the data and model assumptions. Values below 60 are considered poor fits (grounds for rejecting the model as a whole), and values over 100 are considered good fits. Agreement indexes are also calculated for individual dates using the same scale. This allows us to identify possible outliers or other inconsistent data points. Importantly, because data within the WST models include charcoal dates that have not been identified to species, old wood effects cannot be ruled out. Thus, all calculations for the duration of WST should be considered maximum estimates.
Summed Probability Distributions as Illustrative Tools
While OxCal phase modeling was used to determine the estimated beginning, end, and span of WST (see below), we also used the summed probability distributions (SPD, created using the SUM function in OxCal) from each of the modeled estimates as illustrative tools to show general patterns of radiocarbon dates through the Windust phase. In these graphs, higher peaks indicate that a higher density of calibrated probability distributions fall within that period and are thus generally indicative of relative changes in sample size through time. While SPDs are routinely used as the foundation from which various authors have inferred demography (e.g., Shennan et al. Reference Shennan, Downey, Timpson, Edinborough, Colledge, Kerig, Manning and Thomas2013; Timpson et al. Reference Timpson, Colledge, Crema, Edinborough, Kerig, Manning, Thomas and Shennan2014), it is important to clarify that the SPDs here are not used to infer anything about demography, nor have they been modified or manipulated. Moreover, the SPDs were not used to estimate the beginning, end, or span of Windust. They are simply used as illustrative figures to graphically summarize patterns in the data.
Data Collection, Model Iterations, and Hygiene
Our first step in modeling the WST on the Columbia Plateau was to create a database of radiocarbon-dated Windust sites and components (Table 1). The database, including pertinent information on the assays and their contexts, was compiled by examining the original reports; later summaries and compilations were not relied on. No dates were excluded from the database, regardless of our interpretation of their data quality.
Table 1. Database of Radiocarbon-Dated Sites and Components.

Note: All dates within the Windust database and brief reasoning for their exclusion or inclusion into the CE. The model number inclusion column shows which dates were included in each model. Calibrated ages for shell dates have not been corrected for potential reservoir effects. All calibrations were done using OxCal v4.2 using the IntCal 13 calibration curve.
Data collection resulted in a database of components from 16 archaeological sites that are radiometrically dated and contain WST projectile points (Table 1). Most of these sites are in eastern Washington and western Idaho (Figure 1). A total of 65 radiocarbon assays are available for the WST components from these 16 sites (Table 1). These assays were processed on a variety of substrates (bone, charcoal, ivory, soil humus, and shell) and returned conventional radiocarbon ages ranging from as late as approximately 6,500 BP to more than 14,000 BP. While most of these components have been dated numerous times, five have only one radiocarbon measurement available. Those sites were studied decades ago.
Next, our goal was to establish a baseline model for Windust that we could use as a framework for exploring how the inclusion or exclusion of various dates under different parameters affected the modeled estimate for the phase. Our goal for this model was to create a highly conservative estimate of Windust, based on our most stringent standards of data quality, that effectively reflected orthodox opinions of researchers working in the region. We dub this model the Conservative Estimate (CE), which was built using data we determined came from secure cultural contexts that were in direct association with diagnostic points and the dates generated were from either bone or charcoal samples. We also excluded any dates (regardless of the quality of association with Windust materials) that have been widely debated or have not been readily accepted by multiple authors in recent broader reviews of WST materials. Most notably, this means that the early dates from Cooper's Ferry were not included in the CE but were included in a different model discussed below. Dates from freshwater shell were not included in the CE because Delta_R corrections for carbon reservoir issues have not been resolved for the entire geographic study area or time depth explored in this article (Osterkamp et al. Reference Osterkamp, Green, Reid and Cherkinsky2014). Radiocarbon estimates from Windust components that were mixed with other later point types (i.e., Cascade points or side-notched points) were also excluded.
This last point bears some explanation, as there is debate as to whether the subsequent Cascade phase in the Northwest represents an in situ evolution from Windust (e.g., Leonhardy and Rice Reference Leonhardy and Rice1970) or a technological replacement by a new group of people (e.g., Chatters et al. Reference Chatters, Hackenberger, Prentiss, Thomas, Boussman and Vierra2012). Our exclusion of mixed assemblages in the CE should not be taken to reflect a belief that there is a significant period between the end of Windust and the beginning of Cascade or that Cascade could not have derived from Windust. Our logic was to avoid complicating the timing of Windust by adding dates from possibly disturbed contexts with later point styles. The timing of Cascade and its evolutionary relationship with Windust are poorly known, and technological and stylistic definitions of what constitutes a Cascade point are inconsistently applied. Thus, analyzing the transition between Cascade and Windust and sorting out whether assemblages with both point styles represent transition or mixed assemblages are topics for a separate (but very important) research project. We determined that including mixed assemblages would add more noise than clarity for our analysis.
While we attempted to apply a rigorous hygiene procedure to the dataset, we admit some subjectivity in applying standards to decide which dates to include in the CE. Hygiene is a process to quantifiably accept and reject radiocarbon measurements based on our confidence that the date is reliable and represents the phenomena of interest. Ideally, this allows for more objectivity in evaluating radiocarbon samples and increases the level of confidence in any assay (e.g., Graf Reference Graf2009; Pettitt et al. Reference Pettitt, Davies, Gamble and Richards2003).
However, given the overall quality and sample size of the dataset, our systematic attempts of hygiene resulted in meaninglessly small sample sizes of sites or dates, or both. This is likely why various attempts at hygiene (e.g., Chatters et al. Reference Chatters, Hackenberger, Prentiss, Thomas, Boussman and Vierra2012; Goebel and Keene Reference Goebel, Keene, Parezo and Janetski2014; Reid et al. Reference Reid, Hughes, Root, Rondeau, Smallwood and Jennings2015) have resulted in wildly disparate conclusions from basically the same set of data (Figure 4). Table 1 gives a brief description of our logic for including or excluding dates from the CE, and it is likely that many researchers in the region will disagree with the inclusion or exclusion of any date or site. However, as we show below, except for the earliest dates, removing subsets of the data does little to change the modeled estimates. Thus, regardless of debates over our decisions on which dates to include, we believe that the CE offers an informative and most reasonably restrictive, orthodox estimate for the timing of Windust.

Figure 4. Comparison of approximate age estimates for WST, including results from models 2 and 5 from this article; Clovis, Folsom, and the Cascade phase from previous studies. All ages are in cal BP. * Indicates our calibration of an estimate originally given in uncalibrated years. ** Indicates what we think is the most accurate reflection of the author's original proposed range for Windust into cal BP format.
We emphasize that the CE is by no means the best or our preferred model for the timing of Windust. Our goal was simply to avoid reproducing other work and sidestep the limitations of a hygiene method by constructing a baseline model of the chronology of Windust, which reflected the orthodoxy of researchers in the region. From this, we then created iterations of the CE using different parameters to examine how the timing and duration of Windust varies with different data. This approach provides an inclusive view of the data similar to those taken by Whittle and Bayliss (Reference Whittle and Bayliss2007) and Riede and Edinborough (Reference Riede and Edinborough2012). Our logic here was that by being inclusive rather than exclusive in the selection of dates, one might avoid potential bias in selection criteria. Moreover, this inclusivity sidesteps the various debates regarding the inclusion or exclusion of certain dates within the WST (see Goebel and Keene Reference Goebel, Keene, Parezo and Janetski2014). We believe the various iterations of the model, compared to the CE, provide important insights into the start, duration, and end of WST instead of attempting to settle the issue with a best estimate, especially given the small sample size of the dataset.
Results
In all, we created six models for Windust. All except model 1 used the CE as a baseline from which to add or exclude data. Data included in each model can be found in Table 1. Models 3–6 consisted of data iterations based on the core CE model where we included or excluded subsets of the data to explore their effects on the chronology of Windust. Results for each model are discussed below (see Table 2 and Figure 5). As in Table 2, all modeled age ranges discussed below are shown as 95% probability ranges.
Table 2. Results of Six Models to Test Windust Date Spans.

Note: Agreement indexes, 95% range, and median estimates for the beginning, end, and span of each model. All ages are in calibrated years BP (cal BP) and are shown as 95% ranges.
* Model number for each iteration.
** Failed to meet the minimum agreement index score of 60, which indicates data does not fit the model assumptions.
Model 1. Everything Associated with WST Materials
Model 1 used no hygiene standards and included all dates in the database that were associated with any Windust materials. Expectedly, results of this model gave Windust its longest span. The estimated start in the model is between 13,700 and 13,142 cal BP with a modeled end date between 9376 and 8584 cal BP In this iteration, the temporal span of Windust encompasses an incredibly long period of 3883 to 4937 calendar years. However, because this estimate includes unvetted and uncritically accepted dates, it should be understood as a frame of reference, not a reliable estimate of Windust. It should also be noted that this is the only model with an agreement index below the 60 threshold, indicating a poor fit between data and model assumptions (i.e., Windust forms a coherent tradition for which we have a reasonable sample; see Table 2).
Model 2. Conservative Estimate (CE)
As described above, radiometric measurements modeled in the CE are more stringently vetted, consisting of assays on bone or charcoal; the dated sample material was, in our view, securely associated with Windust points in an undisturbed context. As mentioned, since the goal of this model was to act as a conservative baseline reflecting orthodox opinions of previous research in the region, we also excluded some data that we felt otherwise met the contextual criteria described earlier (e.g., Cooper's Ferry). This hygiene program resulted in the exclusion of all the oldest and youngest radiocarbon dates known for Windust. This sample produces a much more truncated span than Model 1. The CE indicates the phase lasted 1293–2114 calendar years. In the CE, the modeled start date is between 13,085 and 12,475 cal BP, while the end date occurred between 11,285 and 10,829 cal BP.
Model 3. CE Only Dates with Less Than a 100-Year Error
Because including measurements with high errors can smear estimated phase beginnings and endings and because their inclusion in estimates of WST has been critiqued (Goebel and Keene Reference Goebel, Keene, Parezo and Janetski2014), this model shows the effect on the CE after removing high-error dates. When the CE only contains assays with errors less than 100 years, changes in the modeled age of the CE are negligible (Table 2; Figure 5). Confidence intervals of the start and end of Windust are largely unchanged. The span of the period (941–2065 calendar years) is also similar to the estimate in the CE (1293–2114 calendar years).

Figure 5. Summed probability distributions (SPD) from each model iteration shown in relation to timing of other Paleoindian traditions and the timing of the Younger Dryas (highlighted in gray), as shown in the GISP2 Greenland ice core. Image for GISP2 from CalPal (Weninger 2017) climate composer. + sign indicates the median estimate of a single date. Modeled estimates are shown in dark gray and unmodeled in light gray.
Model 4. CE with Dates Processed after 1990
This model was run to see whether more recent assays (i.e., with more advanced equipment and procedures) influence Windust chronology. Furthermore, this model may allow us to see how research from different periods influences the Windust dataset (i.e., archaeologists decades ago may have studied site types that had a different character than those identified and excavated today).
There is more variability when the CE is reconsidered using only radiometric measurements processed since 1990 (Figure 5; Table 2). Modeled beginning is between 12,865 and 12,081 cal BP, whereas the end is estimated at 11,302 to 10,794 cal BP. While the estimated range of the end date changes little, the start date may have occurred later. As a result, the more recently processed radiocarbon assays hint that the Windust period might have been shorter than indicated by the other models.
This iteration has a modeled span of 868 to 1902 calendar years. However, it is also important to note that this model is almost half the sample size (Table 2) as the CE, which creates much more uncertainty in the estimates. Thus, despite their dissimilarities, we regard this estimate as demonstrating the robustness of the CE, given that even small subsets of modeled data reproduce similar results.
Model 5. CE with Early Dates from Cooper's Ferry (Authors’ Preferred Estimate)
This model was run because data from Cooper's Ferry represents the primary schism between our thinking here and other published works on WST materials. Although Davis and colleagues (Reference Bryan, Willig, Aikens and Fagan2014:603–604) admit that the association between the early dates and WST materials found within Pit Feature 2 has not been conclusively resolved, we believe that arguments presented in Davis and Schweger (Reference Davis and Schweger2004) and Davis and colleagues (Reference Bryan, Willig, Aikens and Fagan2014) have reasonably demonstrated that these early dates are likely associated with the proximally located WST points. In fact, we believe this association to be much stronger than many other younger dates that have been accepted by researchers in the region. Despite this, many recent syntheses for WST in the far West (e.g., Chatters Reference Chatters, Hackenberger, Prentiss, Thomas, Boussman and Vierra2012; Goebel and Keene Reference Goebel, Keene, Parezo and Janetski2014; Reid et al. Reference Reid, Hughes, Root, Rondeau, Smallwood and Jennings2015) have rejected these early dates. While we excluded Cooper's Ferry data from the CE to meet its goal of a conservative estimate reflecting both data quality and orthodoxy, we include Cooper's Ferry data in this model to reflect what we and others (e.g., Beck and Jones Reference Beck and Jones2010, Reference Beck, Jones and Rhode2012; Davis et al. Reference Bryan, Willig, Aikens and Fagan2014) believe is a reasonably secure association between 14C dates and WST materials. Including dates from Cooper's Ferry has a straightforward effect: the estimated start (13,615–13,129 cal BP) and span (Table 2) of Windust increases by roughly 600 calendar years, making Windust at least 2000 calendar years long.
Model 6. CE with Dates from the Paisley Caves Site
In this model, we ran the basic set of dates from the CE combined with some of the earliest dates from the Paisley Caves site located in southern Oregon bordering the fuzzy boundaries between the Columbia Plateau and Northern Great Basin (Figure 1). Although outside the study area, we decided to include this model because the site represents one of the earliest—if not the earliest—well-dated sites containing WST materials that has been widely accepted as pre-Clovis in age (Jenkins et al. Reference Jenkins, Davis, Stafford, Campos, Hockett, Jones, Cummings, Yost, Connolly, Yohe, Gibbons, Raghavan, Rasmussen, Paijmans, Hofreiter, Kemp, Barta, Monroe, Thomas, P. Gilbert and Willerslev2012, Reference Jenkins, Davis, Stafford, Campos, Connolly, Cummings, Hofreiter, Hockett, McDonough, Luthe, O'Grady, Reinhard, Swisher, White, Yates, Yohe, Yost, Willerslev, Graf, Ketron and Waters2013). Thus, we felt it necessary to include the data from this site to contextualize our results for Windust on the plateau within the wider WST. We did not include many of the oldest dates from this site, focusing only on data that was proximally located to diagnostic WST points (see Jenkins et al. Reference Jenkins, Davis, Stafford, Campos, Hockett, Jones, Cummings, Yost, Connolly, Yohe, Gibbons, Raghavan, Rasmussen, Paijmans, Hofreiter, Kemp, Barta, Monroe, Thomas, P. Gilbert and Willerslev2012:Table 1). Overall, results of this model (Table 2) give very similar estimates to Model 5 (e.g., start estimate 13,660–13,276 cal BP). We are not using data from Paisley Caves to inform on the timing of Windust on the plateau, which is why we did not carefully analyze the site as a whole or attempt a formal model of all the dates from the site. We wished to use selected data from Paisley Caves to help contextualize the consistency between the earliest dated Windust sites and those within the Great Basin.
Discussion
Beginning and Ending of Windust
The central tendency of Windust data is robust; regardless of how data was analyzed, the pattern that Windust spanned between 13,000 and 11,000 remained relatively stable. When considering the various permutations of the CE, though, we found some variability among the models for the beginning dates of Windust, depending on the particular combination of dates included in the model (Table 2). Regarding the beginning of the phase, the most dramatic and potentially most important effect was produced by excluding or including early dates from Paisley Caves and Cooper's Ferry. Models excluding these two sites estimated WST began around 13,000 to 12,500 cal BP. However, models including Paisley Caves and Cooper's Ferry gave an estimate of ~13,600 to 13,100 cal BP.
The controversy at the start of the distribution was whether to accept the Paisley Caves and Cooper's Ferry dates and was, of course, central to the question as to whether Windust, hence WST, is older than, contemporary with, or younger than Clovis. There was a ~700-year difference in the beginning of Windust in models with and without dates from Cooper's Ferry and Paisley Caves, a span encompassing Waters and Stafford's (Reference Waters and Stafford2007) entire maximal estimate for the age of Clovis (Figure 4).
An interesting effect of including the Paisley Caves dates (associated securely with WST points) is that they demonstrated that the earliest Cooper's Ferry dates are not anomalously early, as they appeared to be when first reported (Davis Reference Davis2001b; Davis and Schweger Reference Davis and Schweger2004). In fact, the Paisley Caves and early Cooper's Ferry assays are essentially contemporary. These dates are also slightly earlier but well in line with the earliest dates from Marmes Rockshelter (which also were eliminated from the CE). This shows that the inclusion of Paisley Caves not only removed the anomalous qualities of other early WST dates but also demonstrated a remarkable continuity in the age ranges of early WST components. Unfortunately, these early components are rare, and those at Cooper's Ferry and Marmes either have not been established as reliably associated with WST materials (Marmes) or are readily accepted by researchers in the region (Cooper's Ferry). However, this analysis showed that these early dates should not be dismissed out of hand, as they were in the past, because they are consistent with other early dates for WST.
Regarding the Paisley Caves and Cooper's Ferry dates, it is well beyond the scope of this article to evaluate the data and arguments concerning those disputed ages. Our view is that these sites are well excavated, and the dates are good; indeed, we regard the issue settled for the Paisley Caves dates. Ongoing work at Cooper's Ferry also continues to uncover Windust components in good contexts. Thus, we believe it likely that model 5 will become the preferred model (as it is for us) for Windust. However, our purpose here was to present robust estimates for the age span of Windust using different permutations of the available radiocarbon data. The weight of the models, taken in toto, has Windust starting at least by ~13,000 cal BP and likely earlier, establishing WST as roughly coterminous with at least the middle of the Clovis phase. However, establishing the age of Clovis is as fraught as establishing the age of Windust because of issues related to sample size, sample selection, radiocarbon hygiene, and the vagaries of radiocarbon dating and probability. This is illustrated by the differing methods and estimates of Prasciunas and Surovell (Reference Prasciunas, Surovell, Smallwood and Jennings2015) and Waters and Stafford (Reference Waters and Stafford2007). We suggest a Bayesian analysis of Clovis dates along the lines of the methods we employed might aid in increasing the precision of Clovis age estimates. In the absence of that, the weight of the available data, in our view, indicates the two traditions were likely contemporary.
Unlike the beginning of the WST phase, which is more or less a debate involving one or two sites, the ambiguity at the young end of the distribution is more difficult to address. As mentioned above, the traditionally accepted ending of WST is ~10,000 to 9000 cal BP (Figure 4). However, the majority of our models are remarkably consistent in suggesting an end date closer to 11,000 cal BP (Table 2), and only one is consistent with a 9000 cal BP end date (Model 1). Dates falling after 11,000 cal BP are much less common, and many are from mixed components, used older pretreatment methods, and were rejected by the original excavator or because they had suspect associations with WST materials. Thus, it could be argued that the 9000 cal BP end date suggested by the more inclusive model is simply an artifact of using bad samples. However, the number of sites with dates falling within this period suggests we should not simply dismiss these later components. More on this is discussed below.
The analysis presented here demonstrates that the central tendency of Windust data is very robust; regardless of how data is parsed, the pattern that WST on the plateau spanned between 13,000 and 11,000 remains stable.
Temporal Gap in Windust
One of the most surprising results of our analysis was the problematic ending of Windust when the majority of the modeled results were compared to traditional estimates. As described above, all but one of the modeled estimates (model 1) suggest an end date almost 2000 years prior to previous estimates. The ending date of 11,000 cal BP results from the exclusion of mixed assemblages and dates from shell. Model 1, which includes shell and mixed assemblages, has a median terminal date of 9022 cal BP. This is consistent with current assumptions of the end of the Windust period (Figure 4). Few, if any, archaeologists working in the Northwest debate this time frame for the end of Windust. However, the SPD for model 1 illustrates some interpretive problems in trying to establish the end of Windust. For example, this model is the only one where we relaxed our hygiene standards, demonstrating that there are no securely dated components of “pure” Windust following ~11,000 cal BP. It is also the only model that scored an agreement index of less than 60.
However, even if one were to accept the results of model 1 uncritically, there is another larger issue: there is a substantial gap in medians (almost 1000 years) between the bulk of the Windust dates and the later dates that are pushing the ending of WST into ~9000 cal BP (Figure 4). That is, there are no dates that connect between ~11,000 and 10,000 cal BP. Therefore, we must not only establish the validity of the 10,000–9000 cal BP components but also work to explain why there are no intervening components within the study area. One explanation may be that archaeologists in the region have focused on dating basal and terminal occupations, creating an artificial gap in the middle. Our results indicate that these later assemblages need to be reevaluated.
Marmes Rockshelter is a case in point. Taylor and Beck (Reference Taylor, Beck and Kopperl2016) suggest that the basal three strata (I, II, and III) at the Marmes Rockshelter on the Palouse River in the eastern plateau may have been transitional from Windust to the subsequent Cascade phase since all three contain the diagnostic point types of both phases: stemmed and shouldered Windust and laurel-leaf shaped Cascade points. Cascade points gradually replace Windust, suggesting the strata were not significantly mixed (see also Ames Reference Ames2000). The 18 radiocarbon dates on those strata (Hicks Reference Hicks2004:Table 15.1) are also generally in good order. Unfortunately, 12 are on shell and thus were excluded from our data. Although a thorough examination of the poorly known Cascade phase chronology may shed light on this issue or resolve the gap altogether, such an analysis is likely some time away from being completed.
The authors here agree that Windust likely dates into the 10,000 to 9000 cal BP range, but this analysis demonstrates that the ending of Windust is poorly documented and requires much more data and research before any clear statements about its termination can be made. What we can safely say, based on our work, is that the most robust aspects of Windust chronology presently predates 11,000 cal BP and that future analysis should focus on the late-appearing mixed assemblages.
Span of Windust
One of the notable features of Windust highlighted by our models is its duration, particularly in contrast with the coeval Paleoindian traditions of Clovis and Folsom (Figures 4 and 5). Our conservative estimate (~1300–2100 years) is much longer than Leonhardy and Rice's (Reference Leonhardy and Rice1970) original estimate of circa 10,000–9000 cal BP, although they allowed that it might extend as early as 12,000 to 11,000 cal BP. This is also longer than the relatively brief spans assigned to Paleoindian complexes in other parts of North America. For example, Waters and Stafford (Reference Waters and Stafford2007) estimate Clovis lasted between 200 and 450 calendar years, while Prasciunas and Surovell (Reference Prasciunas, Surovell, Smallwood and Jennings2015) estimate the Clovis duration to be perhaps 850 to 1100 calendar years. Surovell and colleagues (Reference Surovell, Boyd, Vance Haynes and Hodgins2016) suggest Folsom existed only about 400 years, between ~12,600 and 12,170 cal BP (Figure 4). Thus, most of our models suggest Windust lasted two to four times longer than Clovis. In fact, even the shortest modeled span of Windust (model 2) is equivalent to or exceeds the longest estimates of Clovis and is twice that of Folsom.
However, Windust's duration may not be comparable to those Paleoindian expressions. Some researchers argue the apparent length of Windust as a cultural-historical construct reflects a classificatory problem with Windust; ergo, the phase masks stylistic variation that would have led to the creation of several phases elsewhere (Reid et al. Reference Reid, Hughes, Root, Rondeau, Smallwood and Jennings2015). In a review of that variation, Lohse and Moser (Reference Lohse and Moser2014) posit that WST points on the Columbia Plateau have three distinct types: Windust, Lind Coulee, and Haskett (Figure 2). They suggest a sequence in which Windust is oldest, followed by Lind Coulee, then Haskett. However, the available dataset is simply too small to analyze and compare chronologies among point styles. Moreover, we doubt that existing typologies are robust enough to support meaningful delineation of point styles. Use of methods like those recently described in Davis and colleagues (Reference Davis, Bean and Nyers2017), who used 3-D scanning data to evaluate morphometric similarity and differences between WST points, would undoubtedly provide greater typological clarity. However, the most critical issue (as shown in this article) is the lack of quality dates associated for Windust as a whole on the plateau, much less point styles. Windust and WST assemblages also vary technologically across time and space, but this variation seems to reflect WST people keying into local raw materials (e.g., Nyers Reference Nyers2013; Taylor and Beck Reference Taylor, Beck and Kopperl2016) rather than differences in cultural tradition. Thus, given current data, Windust seems to reflect a durable cultural-historical entity. This durability and even resilience are particularly interesting given Windust's contemporaneity with the Younger Dryas Stadial (Figure 5).
Windust and the Younger Dryas
Figure 5 displays the SPDs of models 2 and 6 to show the temporal relationship of Windust with the Younger Dryas (YD) and of the various temporal estimates for contemporaneous Clovis and Folsom Paleoindian culture groups. Our maximal estimate for Windust shows it starting well before the YD and extending well after its end; our CE estimate has Windust and the YD beginning at about the same time but with Windust extending well past the YD's end. Interestingly, the onset and termination of the YD seems to have little effect on Windust. In fact, depending on which model iteration is used, the density of Windust dates actually increases or, at worst, remains stable through this climatic shift. This finding is especially significant when put into context with other Paleoindian studies that cite the YD as a critical factor in the demise of other contemporary cultural phases (e.g., Clovis) and in the death of megafauna across North America (see review by Meltzer and Holliday Reference Meltzer and Holliday2010 and citations therein).
For the time being, we can offer no robust explanation as to why Windust seems to flourish on the plateau while groups in other regions of North America were reportedly negatively impacted during this cold regime, long assumed to be as intense as it was widespread. One explanation may be that the study region was simply not as affected as other areas. For example, Meltzer and Holliday (Reference Meltzer and Holliday2010) have argued that the YD minimally affected the nearby Rocky Mountain and Great Basin areas. It is also possible that mobility and settlement patterns (see Ames Reference Ames, Willig and Fagan1988; Chatters Reference Chatters, Hackenberger, Prentiss, Thomas, Boussman and Vierra2012) characteristic of Windust were more adaptive during this climate shift, focusing on wetlands and broad-spectrum economies. However, addressing these questions further was beyond the scope of this study and would require synthesis of more localized environmental data from the plateau, which is not available.
Conclusions
Overall, the results of this analysis indicate that the WST on the Columbia Plateau began circa 13,000–12,700 cal BP and possibly as early as ~13,500 cal BP. Our models consistently date the end of Windust to 11,000 cal BP. The different permutations of the data indicate a stable central tendency of the phase to exist between approximately 13,000 and 11,000 cal BP. This indicates that Windust is contemporary with Clovis. Our results also demonstrate that Windust was an extraordinarily resilient and long-lived technological tradition, likely lasting at least 2,000 years. The tradition's resilience is further attested by Windust enduring throughout the Younger Dryas Stadial.
Beyond establishing absolute dates for Windust, this analysis shows that the basic pattern of the tradition remains stable no matter the approach taken to exclude or include dates. This indicates that, despite problems with any date or site, using a large enough sample can give us confidence in the broad temporal patterns of Windust. The period between ~13,000 and 11,000 cal BP is unarguably stable. This does not mean that our estimates for Windust cannot be more precise, but we can be confident within the parameters presented here. With this in mind, the data collection, hygiene, and analyses for this project highlight a number of problems in studying the timing of WST on the plateau.
First, many radiocarbon measurements were rejected, as they had unsecure contextual data or assays were conducted on shell. Second, the number of sites in the sample is very small. The CE has 11 sites, and the entire database only has 16 (Table 1). Third, large sigmas are associated with many of the dates, principally because many dates were assayed more than 40 years ago. Of the 17 dates included in the CE, the average error is ~172, with a range from 40 to 870. These errors obviously put limits on the possible precision of any estimates. Many questions (e.g., whether the Windust phase extend until 9000 cal BP) are currently unresolvable without new, more precise dates on short-lived materials. Without such, it is not possible to refine the start and end dates of Windust. This is particularly relevant for the beginning of Windust, as the 95% modeled range of the start estimates are actually as large as, if not larger than, the entire Clovis window.
This study productively moves beyond debates about individual dates or sites by demonstrating the value of Bayesian models using entire suites of radiocarbon dates for a phase rather than relying on just the oldest and youngest or on narrowly defined subsamples selected on variable and silently subjective judgments. In doing so, we have not only established the robustness of Windust's central temporal tendency but also highlighted a number of previously unrecognized issues in its chronology. Most notable of these is the ambiguous ending of Windust. Our analysis clearly shows that this transition may be more spatially or temporally complex than previously hypothesized, and more attention needs to be paid to dating components from the critical period between circa 11,000 and 9000 cal BP. Finally, more dates with strong contextual associations are needed to determine the beginning of Windust.
Acknowledgments
Early versions of this article were presented at the 80th annual meeting of the Society for American Archaeology and the 68th annual Northwest Anthropological Conference. We would like to thank Andrew Martindale and Michael Blake for their thoughtful comments and general encouragement on early drafts of this article. We would also like to thank the four reviewers for the time and effort they put in to giving us productive and detailed comments that markedly improved this article. Last, we thank Luis Borrero, who provided the Spanish abstract. Ken Ames passed away before this article went to print. Ken's impact on North American archaeology is well known. He was a Professor Emeritus of Anthropology at Portland State University and past president of the SAA. His work focused mostly on the Northwest Coast, Columbia Plateau and Lower Columbia River, but he was fascinated by archaeology everywhere and hugely optimistic about what we could learn. Ken was kind, enormously generous with his time and data and always eager to chat about archaeology, often at great length. He began as our adviser and mentor but became our colleague and most importantly our friend. Ken died on April 21, 2019, surrounded by family. He will be missed.
Data Availability Statement
No original data were used in this project.


