


Introduction
The hippocampal formation (HF) is among the brain structures that show the most robust volume deficits in schizophrenia (Haijma et al., Reference Haijma, Van Haren, Cahn, Koolschijn, Hulshoff Pol and Kahn2013; Okada et al., Reference Okada, Fukunaga, Yamashita, Koshiyama, Yamamori, Ohi, Yasuda, Fujimoto, Watanabe, Yahata, Nemoto, Hibar, van Erp, Fujino, Isobe, Isomura, Natsubori, Narita, Hashimoto, Miyata, Koike, Takahashi, Yamasue, Matsuo, Onitsuka, Iidaka, Kawasaki, Yoshimura, Watanabe, Suzuki, Turner, Takeda, Thompson, Ozaki, Kasai and Hashimoto2016; van Erp et al., Reference van Erp, Hibar, Rasmussen, Glahn, Pearlson, Andreassen, Agartz, Westlye, Haukvik, Dale, Melle, Hartberg, Gruber, Kraemer, Zilles, Donohoe, Kelly, McDonald, Morris, Cannon, Corvin, Machielsen, Koenders, de Haan, Veltman, Satterthwaite, Wolf, Gur, Gur, Potkin, Mathalon, Mueller, Preda, Macciardi, Ehrlich, Walton, Hass, Calhoun, Bockholt, Sponheim, Shoemaker, van Haren, Pol, Ophoff, Kahn, Roiz-Santiañez, Crespo-Facorro, Wang, Alpert, Jönsson, Dimitrova, Bois, Whalley, McIntosh, Lawrie, Hashimoto, Thompson and Turner2016) though subregion abnormalities, relationships with cognitive performance, and contributing genetic loci remain to be determined. Regional HF abnormalities have been hypothesized and observed (Schobel et al., Reference Schobel, Lewandowski, Corcoran, Moore, Brown, Malaspina and Small2009; Tamminga et al., Reference Tamminga, Stan and Wagner2010, Reference Tamminga, Southcott, Sacco, Wagner and Ghose2012; Small et al., Reference Small, Schobel, Buxton, Witter and Barnes2011). Tamminga et al. hypothesized that a primary deficit in the hippocampal dentate gyrus (DG) disrupts memory presentations in schizophrenia (Tamminga et al., Reference Tamminga, Stan and Wagner2010), while Small et al. hypothesized that a primary deficit in Cornu Ammonis (CA) 1 disrupts memory integration in schizophrenia (Small et al., Reference Small, Schobel, Buxton, Witter and Barnes2011). The HF's trisynaptic circuit includes subregions that subserve different functions and differ in cellular make-up, e.g. the principal cell type in the DG is the granule cell and in the CA the pyramidal cell (Amaral and Witter, Reference Amaral and Witter1989; Amaral et al., Reference Amaral, Scharfman and Lavenex2007; Small et al., Reference Small, Schobel, Buxton, Witter and Barnes2011; Wheeler et al., Reference Wheeler, White, Rees, Komendantov, Hamilton and Ascoli2015; Nakahara et al., Reference Nakahara, Matsumoto and van Erp2018). Hence, different biological mechanisms may contribute to HF subregion volume abnormalities observed in schizophrenia.
Several automated HF segmentation methods exist (Van Leemput et al., Reference Van Leemput, Bakkour, Benner, Wiggins, Wald, Augustinack, Dickerson, Golland and Fischl2008, Reference Van Leemput, Bakkour, Benner, Wiggins, Wald, Augustinack, Dickerson, Golland and Fischl2009; Yushkevich et al., Reference Yushkevich, Avants, Pluta, Das, Minkoff, Mechanic-Hamilton, Glynn, Pickup, Liu, Gee, Grossman and Detre2009; Iglesias et al., Reference Iglesias, Sabuncu and Van Leemput2013; Adler et al., Reference Adler, Pluta, Kadivar, Craige, Gee, Avants and Yushkevich2014). Two of these methods (Van Leemput et al., Reference Van Leemput, Bakkour, Benner, Wiggins, Wald, Augustinack, Dickerson, Golland and Fischl2008, Reference Van Leemput, Bakkour, Benner, Wiggins, Wald, Augustinack, Dickerson, Golland and Fischl2009; Iglesias et al., Reference Iglesias, Sabuncu and Van Leemput2013) are implemented in FreeSurfer (Fischl et al., Reference Fischl, Salat, Busa, Albert, Dieterich, Haselgrove, van der Kouwe, Killiany, Kennedy, Klaveness, Montillo, Makris, Rosen and Dale2002; Fischl, Reference Fischl2012) and have been most widely used in schizophrenia studies. Subregions shown to have lower volume in schizophrenia compared to controls include the CA1 (Hýža et al., Reference Hýža, Kuhn, Češková, Ustohal and Kašpárek2016; Ho et al., Reference Ho, Holt, Cheung, Iglesias, Goh, Wang, Lim, de Souza, Poh, See, Adcock, Wood, Chee, Lee and Zhou2017a, Reference Ho, Iglesias, Sum, Kuswanto, Sitoh, De Souza, Hong, Fischl, Roffman, Zhou, Sim and Holt2017b; Ota et al., Reference Ota, Sato, Hidese, Teraishi, Maikusa, Matsuda, Hattori and Kunugi2017; Sauras et al., Reference Sauras, Keymer, Alonso-Solis, Díaz, Molins, Nuñez, Rabella, Roldán, Grasa, Alvarez, Portella and Corripio2017), CA2/3 (Ho et al., Reference Ho, Holt, Cheung, Iglesias, Goh, Wang, Lim, de Souza, Poh, See, Adcock, Wood, Chee, Lee and Zhou2017a, Reference Ho, Iglesias, Sum, Kuswanto, Sitoh, De Souza, Hong, Fischl, Roffman, Zhou, Sim and Holt2017b), DG (Ho et al., Reference Ho, Iglesias, Sum, Kuswanto, Sitoh, De Souza, Hong, Fischl, Roffman, Zhou, Sim and Holt2017b; Ota et al., Reference Ota, Sato, Hidese, Teraishi, Maikusa, Matsuda, Hattori and Kunugi2017), and the subiculum (Francis et al., Reference Francis, Seidman, Tandon, Shenton, Thermenos, Mesholam-Gately, van Elst, Tuschen-Caffier, DeLisi and Keshavan2013; Mathew et al., Reference Mathew, Gardin, Tandon, Eack, Francis, Seidman, Clementz, Pearlson, Sweeney, Tamminga and Keshavan2014; Haukvik et al., Reference Haukvik, Westlye, Mørch-Johnsen, Jørgensen, Lange, Dale, Melle, Andreassen and Agartz2015). These findings suggest that regional deficits in DG-CA3-CA1-subiculum circuitry may contribute to the emergence of psychosis (Yushkevich et al., Reference Yushkevich, Avants, Pluta, Minkoff, Detre, Grossman and Gee2008, Reference Yushkevich, Avants, Pluta, Das, Minkoff, Mechanic-Hamilton, Glynn, Pickup, Liu, Gee, Grossman and Detre2009; Van Leemput et al., Reference Van Leemput, Bakkour, Benner, Wiggins, Wald, Augustinack, Dickerson, Golland and Fischl2009).
Most schizophrenia HF subregion studies employed FreeSurfer 5.1–5.3; (Haukvik et al., Reference Haukvik, Tamnes, Söderman and Agartz2018; Nakahara et al., Reference Nakahara, Matsumoto and van Erp2018), for which limitations have been reported (Wisse et al., Reference Wisse, Biessels and Geerlings2014). Hitherto, only two schizophrenia studies assessed HF subregion volumes using FreeSurfer 6.0's improved ex vivo hippocampal subregion atlas segmentations (Iglesias et al., Reference Iglesias, Sabuncu and Van Leemput2013) run on FreeSurfer 5.3 whole hippocampus segmentations (Ho et al., Reference Ho, Holt, Cheung, Iglesias, Goh, Wang, Lim, de Souza, Poh, See, Adcock, Wood, Chee, Lee and Zhou2017a, Reference Ho, Iglesias, Sum, Kuswanto, Sitoh, De Souza, Hong, Fischl, Roffman, Zhou, Sim and Holt2017b). Ho et al. found a progressive decline in CA1 volume in individuals at risk for psychosis (Ho et al., Reference Ho, Holt, Cheung, Iglesias, Goh, Wang, Lim, de Souza, Poh, See, Adcock, Wood, Chee, Lee and Zhou2017a) and more widespread volume deficits and progressive decline in DG and CA3 after illness onset (Ho et al., Reference Ho, Iglesias, Sum, Kuswanto, Sitoh, De Souza, Hong, Fischl, Roffman, Zhou, Sim and Holt2017b). To our knowledge, only one schizophrenia study has reported HF subregion volumes obtained using only FreeSurfer 6.0 (Baglivo et al., Reference Baglivo, Cao, Mwangi, Bellani, Perlini, Lasalvia, Dusi, Bonetto, Cristofalo, Alessandrini, Zoccatelli, Ciceri, Dario, Enrico, Francesca, Mazzi, Paolo, Balestrieri, Soares, Ruggeri and Brambilla2017). A major advantage of FreeSurfer 6.0 is that its ex vivo atlas provides separate DG and CA4 volume estimates (Iglesias et al., Reference Iglesias, Sabuncu and Van Leemput2013). This distinction is important for testing Tamminga et al.'s hypothesis (Tamminga et al., Reference Tamminga, Stan and Wagner2010) because it focuses on the DG and CA3 but not CA4. Moreover, given that no study to date has tested for a group by region interaction on HF subregion volumes, the possibility of differential regional HF volume abnormalities remains untested.
Schizophrenia is a heritable and HF subregion volume heritabilities are estimated at 40–70% (Greenspan et al., Reference Greenspan, Arakelian and van Erp2016; Whelan et al., Reference Whelan, Hibar, van Velzen, Zannas, Carrillo-Roa, McMahon, Prasad, Kelly, Faskowitz, deZubiracay, Iglesias, van Erp, Frodl, Martin, Wright, Jahanshad, Schmaal, Sämann and Thompson2016), suggesting that genetic variation may contribute to psychosis-related HF abnormalities. However genetic mechanisms contributing to HF subregion volume deficits remain undetermined.
In this study, we compared HF subregion volumes obtained using FreeSurfer 6.0 between 176 individuals with schizophrenia and 173 healthy volunteers recruited into the Function Biomedical Informatics Research Network (FBIRN) Phase 3 study. We tested for a group by region interaction on regional volumes and computed group contrast effect sizes. Based on our review of the literature (Nakahara et al., Reference Nakahara, Matsumoto and van Erp2018), a meta-analysis of predominantly FreeSurfer 5.3 studies (Haukvik et al., Reference Haukvik, Tamnes, Söderman and Agartz2018) and studies that employed FreeSurfer 6.0 (Baglivo et al., Reference Baglivo, Cao, Mwangi, Bellani, Perlini, Lasalvia, Dusi, Bonetto, Cristofalo, Alessandrini, Zoccatelli, Ciceri, Dario, Enrico, Francesca, Mazzi, Paolo, Balestrieri, Soares, Ruggeri and Brambilla2017; Ho et al., Reference Ho, Holt, Cheung, Iglesias, Goh, Wang, Lim, de Souza, Poh, See, Adcock, Wood, Chee, Lee and Zhou2017a, Reference Ho, Iglesias, Sum, Kuswanto, Sitoh, De Souza, Hong, Fischl, Roffman, Zhou, Sim and Holt2017b), we hypothesized a significant group by region interaction with the largest schizophrenia-control effect sizes for the DG/CA4 and CA1 and smallest effect sizes for the subicular regions. We also explored relationships between regions with the largest group difference effect sizes and cognitive performance. To identify possible novel contributing genetic variants to schizophrenia-related HF subregion volume deficits, we performed, to our knowledge the first, schizophrenia genome-wide association (GWA) analysis with DG volume (largest group difference effect size) as the quantitative phenotype. Finally, we explored possible relationships between DG volume and age at onset, duration of illness, symptom severity, smoking, and medication dose.
Methods
Participants
Individuals with schizophrenia (n = 176, mean age ± s.d. = 38.9 ± 11.5, 132 males) and healthy volunteers (n = 173, mean age ± s.d. = 37.6 ± 11.3, 123 males) with similar mean age, gender handedness, and ethnicity distributions, recruited from seven sites, participated in this multi-center cross sectional case–control study (Table 1) (Friedman and Glover, Reference Friedman and Glover2006; Friedman et al., Reference Friedman and Glover2006; Greve et al., Reference Greve, Mueller, Liu, Turner, Voyvodic, Yetter, Diaz, McCarthy, Wallace, Roach, Ford, Mathalon, Calhoun, Wible, Brown, Potkin and Glover2011; Glover et al., Reference Glover, Mueller, Turner, van Erp, Liu, Greve, Voyvodic, Rasmussen, Brown, Keator, Calhoun, Lee, Ford, Mathalon, Diaz, O'Leary, Gadde, Preda, Lim, Wible, Stern, Belger, McCarthy, Ozyurt and Potkin2012). Each participant was assessed with high-resolution T1-weighted scans and clinical assessments (Oldfield, Reference Oldfield1971; de Belmont Hollingshead, Reference de Belmont Hollingshead1975; Kay et al., Reference Kay, Opler and Lindenmayer1989; Uttl, Reference Uttl2002). Inclusion criteria were clinically stable – no antipsychotic medication or dose changes within the last two months – schizophrenia diagnosis based on DSM-IV-TR (First, Reference First2002). Schizophrenia and healthy volunteers with a history of major medical illness, drug dependence in the last five years (except for nicotine), current substance abuse disorder, or MRI contraindications, were excluded. Excluded were individuals with schizophrenia with significant tardive dyskinesia and healthy volunteers with a current or past history of major neurological or psychiatric illness or a first-degree relative with an Axis-I psychotic disorder diagnosis (online Supplementary Methods). Written informed consent, including permission to share de-identified data between the centers, approved by the University of California (UC) Irvine, UC Los Angeles, and UC San Francisco, Duke University, University of North Carolina, New Mexico, Iowa, and Minnesota Institutional Review Boards, was obtained from all study participants.
Table 1. Sample demographics and clinical characteristics

FET, Fisher's exact test; NAART, North American Adult Reading Test; PANSS, Positive and Negative Syndrome Scale.
a Based on Edinburgh Handedness Inventory.
b Based on the Education Level of the Hollingstead Socioeconomic Status Scale.
Image analysis
Hippocampal tail, subiculum, CA1, hippocampal-fissure, presubiculum, parasubiculum, molecular layer of the hippocampus (molecular_layer_HP), granule cell and molecular cell layer of the DG (GC-ML-DG), CA3, CA4, fimbria, and hippocampal-amygdaloid transition region (HATA) (Fig. 1a) as well as intracranial volume (ICV) and overall hippocampal volumes (online Supplementary Table S1) were extracted from high-resolution T1-weighted images of the brain, that had previously been determined of good quality (little motion or other artifacts based on visual inspection) (van Erp et al., Reference van Erp, Greve, Rasmussen, Turner, Calhoun, Young, Mueller, Brown, McCarthy, Glover, Lim, Bustillo, Belger, McEwen, Voyvodic, Mathalon, Keator, Preda, Nguyen, Ford and Potkin2014; Esteban et al., Reference Esteban, Birman, Schaer, Koyejo, Poldrack and Gorgolewski2017), using FreeSurfer 6.0 (https://surfer.nmr.mgh.harvard.edu) (Fischl et al., Reference Fischl, Salat, Busa, Albert, Dieterich, Haselgrove, van der Kouwe, Killiany, Kennedy, Klaveness, Montillo, Makris, Rosen and Dale2002; Van Leemput et al., Reference Van Leemput, Bakkour, Benner, Wiggins, Wald, Augustinack, Dickerson, Golland and Fischl2008, Reference Van Leemput, Bakkour, Benner, Wiggins, Wald, Augustinack, Dickerson, Golland and Fischl2009; Fischl, Reference Fischl2012; Iglesias et al., Reference Iglesias, Sabuncu and Van Leemput2013).

Fig. 1. Hippocampal formation subregion segmentations and least square mean normalized volumes. (a) Left shows hippocampal formation segmentations on 4 coronal slices from anterior (top) to posterior (bottom). Right row shows hippocampal formation segmentations on 4 left hemisphere sagittal slices from medial (top) to lateral (bottom). (b) Least square mean normalized hippocampal subregion volumes ± standard error by diagnosis (Model 1). The hippocampal subregion volumes are normalized to the control mean of left and right hemisphere subregion volumes, and statistical analyses controlled for ICV. (c) Least square mean normalized hippocampal subregion volumes ± standard errors by diagnosis (Model 2). The hippocampal subregion volumes are normalized to the control mean of left and right hemisphere subregion volumes, and statistical analyses controlled for left and right hippocampus volume. Schizophrenia (gray bars). Healthy volunteers (white bars). *Significant Bonferroni corrected group contrasts (p < 0.004).
Neuropsychological battery
Study participants performed the Computerized Multiphasic Interactive Neurocognitive DualDisplay System (CMINDS®) FBIRN task battery and the attention/vigilance, speed of processing, working memory, verbal learning, visual learning, and reasoning/problem cognitive domain scores as well as a total composite (global cognition) score (online Supplementary Table S2) were computed as described in detail previously (van Erp et al., Reference van Erp, Preda, Turner, Callahan, Calhoun, Bustillo, Lim, Mueller, Brown, Vaidya, McEwen, Belger, Voyvodic, Mathalon, Nguyen, Ford and Potkin2015).
Genetic imputation and quality control
DNA samples from unrelated and mixed ethnicity subjects (schizophrenia = 130, healthy volunteers = 145; online Supplementary Methods & Table S3) were genotyped using the Illumina MEGA + Psych chip (Illumina, SD, USA) between January 2016–May 2016 at Illumina Genomics Services (San Diego). Data were filtered to remove single-nucleotide polymorphisms (SNPs) with low minor allele frequency (MAF < 0.01), deviations from Hardy–Weinberg equilibrium (p < 1 × 10⁻⁶), or poor genotyping call rate (<95%) using PLINK software (http://pngu.mgh.harvard.edu/purcell/plink) (Purcell et al., Reference Purcell, Neale, Todd-Brown, Thomas, Ferreira, Bender, Maller, Sklar, de Bakker, Daly and Sham2007). Filtered data were imputed to the 1000 Genomes Project reference panel (phase 1, version 3; ftp://ftp.1000genomes.ebi.ac.uk/vol1/ftp/release/20130502) using the Michigan imputation server (https://imputationserver.sph.umich.edu/index.html) (Das et al., Reference Das, Forer, Schönherr, Sidore, Locke, Kwong, Vrieze, Chew, Levy, McGue, Schlessinger, Stambolian, Loh, Iacono, Swaroop, Scott, Cucca, Kronenberg, Boehnke, Abecasis and Fuchsberger2016).
For individuals with genotyping (n = 275; schizophrenia = 130, healthy volunteers = 145), imputed SNPs with estimated linkage disequilibrium R 2 < 0.8 or low MAF (<0.5%) were removed, resulting in a final dataset of 12 049 533 SNPs.
Statistical analyses
Prior to the main multivariate statistical analyses, we ran univariate mixed-model regression analyses predicting ICV, left and right total hippocampal volumes (online Supplementary Results), and left and right HF subregions with group, site, gender, age, hemisphere (repeated measure), group × site, group × hemisphere, site × hemisphere, and group × site × hemisphere interactions to visually examine the residuals for normality (Proc Univariate, SAS v9.4, SAS Institute Inc.); analysis of ICV did not include a hemisphere term. Residuals appeared normally distributed, no additional data points were excluded, and no data transforms were applied.
To enable proper testing of the diagnosis × region interaction on on hippocampal subregion volumes, data were equated for scalar differences between the subregions by normalization to the mean healthy volunteers subregion volumes [normalized volume = (participant volume − healthy volunteer mean volume)/healthy volunteers standard deviation]. The normalization was performed with the healthy volunteer mean of left and right hemisphere volumes [mean across healthy volunteer subjects of (left + right volumes/2)] to allow for examination of hemisphere effects. The diagnosis × region interaction on hippocampal subregion volumes was also tested in a model excluding fissure volumes which should be larger in individuals with lower hippocampal volumes such as individuals with schizophrenia.
Group differences for each region were examined using mixed-model regression analyses (Proc Mixed, SAS v9.4, SAS Institute Inc.), predicting normalized hippocampal subregion volumes with group, region, and hemisphere and their two- and three-way interactions. Region and hemisphere entered the model as repeated measures factors, and gender, and site along with two- and three-way interactions between site, group, and region entered the model as categorical and age and ICV as continuous covariates (Model 1). Degrees of freedom were estimated using the Satterthwaite option. Possible confounding influences of smoking status on HF subregion volumes (Durazzo et al., Reference Durazzo, Pennington, Schmidt, Mon, Abé and Meyerhoff2013; Schneider et al., Reference Schneider, White, Hass, Geisler, Wallace, Roessner, Holt, Calhoun, Gollub and Ehrlich2014) were assessed by including smoking status (current smoker, ex-smoker, never-smoker), current pack-year, or lifetime pack-year as covariates in Model 1, respectively. We also ran models in current non-smokers and never smokers only. Possible confounding effects of ethnicity were examined and ethnicity was not found to be a significant predictor of HF subregion volumes (p > 0.05).
To assess the independence of the pattern of hippocampal subregion abnormalities from overall hippocampal volume deficits, a second analysis included left and right hippocampal volumes, instead of ICV, as covariates (Model 2). For the regions with a priori defined directional hypotheses based on the literature (CA1, CA2-3, DG/CA4, and subiculum) the significance threshold was set at p < 0.05 (one-tailed). We also indicate which of the findings pass the more conservative Bonferroni multiple comparison corrected threshold for a test of subregion differences of p < 0.004 (0.05 ÷ 12 hippocampal subregions, two tailed). Percent volume differences and Cohen's d weighted mean effect sizes, based on Model 1, were computed for each of the subregions.
We assessed the relationships between HF subregion volumes (with moderate between group effect sizes d < −0.40) and cognitive performance, age at onset, duration of illness, symptom severity (SANS and SAPS scores), and medication dose using regressions statistically controlling for sex, site (categorical), age, and ICV (two-tailed; online Supplementary Methods). Unequal slope analyses (comparing diagnoses) did not show significant diagnosis × volume interactions on cognitive performance. Therefore, only overall sample associations with cognitive performance are reported and type I error was controlled using Bonferroni correction (see online Supplementary Table S2). All analyses only included subjects with available anatomical, cognitive, or symptom data, no extrapolation or imputation of these data was performed to generate missing data.
Genome-wide association and gene-based analyses
The GWA analysis predicted mean bilateral DG volume with diagnosis, SNP, and the diagnosis × SNP interaction, while statistically controlling for age, sex, whole hippocampus volume, site (scanner), and four multidimensional-scaling (MDS) components using PLINK. Whole hippocampal volume, rather than ICV was included in the GWA analysis, as it may more likely yield GWA findings unique to the DG volume. The standard genome-wide significant threshold of p < 5 × 10⁻⁸ was applied to identify significant SNP (Risch and Merikangas, Reference Risch and Merikangas1996; Barsh et al., Reference Barsh, Copenhaver, Gibson and Williams2012) and diagnosis × SNP interaction effects (Hancock et al., Reference Hancock, Soler Artigas, Gharib, Henry, Manichaikul, Ramasamy, Loth, Imboden, Koch, McArdle, Smith, Smolonska, Sood, Tang, Wilk, Zhai, Zhao, Aschard, Burkart, Curjuric, Eijgelsheim, Elliott, Gu, Harris, Janson, Homuth, Hysi, Liu, Loehr, Lohman, Loos, Manning, Marciante, Obeidat, Postma, Aldrich, Brusselle, Chen, Eiriksdottir, Franceschini, Heinrich, Rotter, Wijmenga, Williams, Bentley, Hofman, Laurie, Lumley, Morrison, Joubert, Rivadeneira, Couper, Kritchevsky, Liu, Wjst, Wain, Vonk, Uitterlinden, Rochat, Rich, Psaty, O'Connor, North, Mirel, Meibohm, Launer, Khaw, Hartikainen, Hammond, Gläser, Marchini, Kraft, Wareham, Völzke, Stricker, Spector, Probst-Hensch, Jarvis, Jarvelin, Heckbert, Gudnason, Boezen, Barr, Cassano, Strachan, Fornage, Hall, Dupuis, Tobin and London2012). A fast and flexible gene- or set-based association test using genome-wide association study (GWAS) summary data of DG volume was performed using GCTA (see online Supplementary Methods). The Manhattan plot (Fig. 2) was created using SNP2GENE software (http://fuma.ctglab.nl/) (Watanabe et al., Reference Watanabe, Taskesen, van Bochoven and Posthuma2017). Genome-wide significance of gene was defined at p = 0.05/24 765 (the number of total genes) = 2.0 × 10⁻⁶.
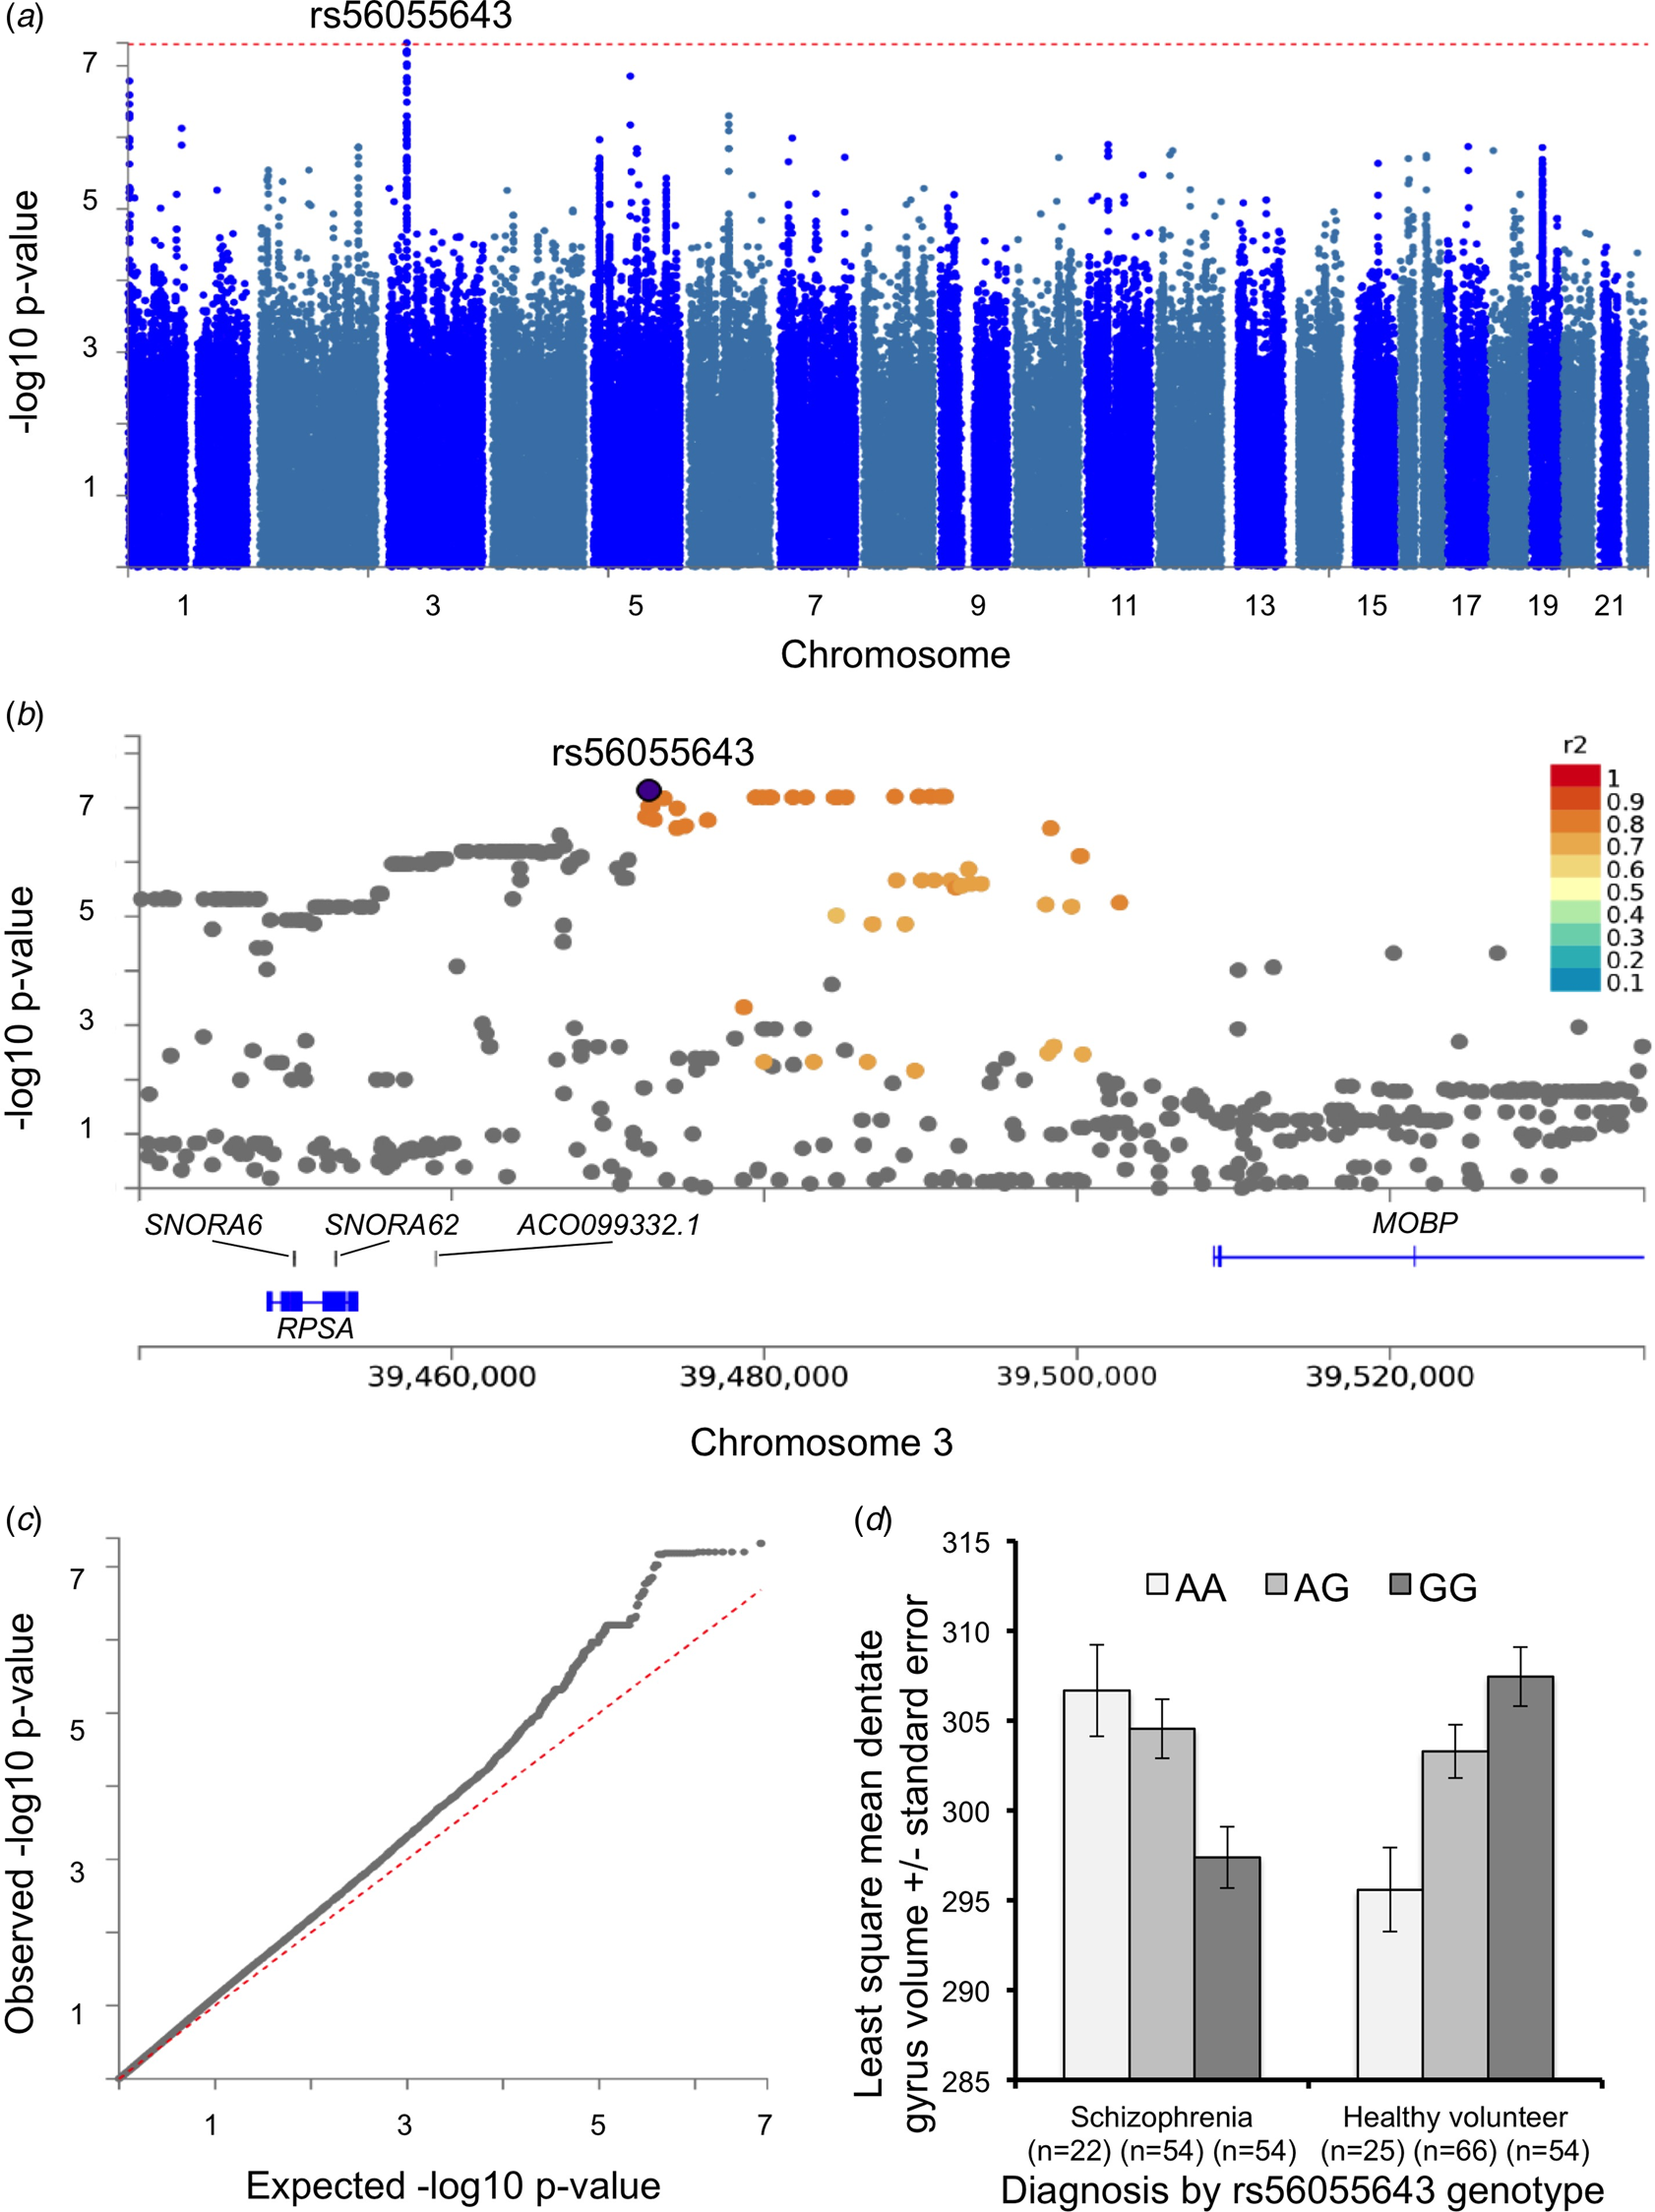
Fig. 2. Genome-wide association with dentate gyrus volume. (a) A Manhattan plot displays the association p value for each SNP in the genome (displayed as –log10 of the p-value). Red line displays p = 5 × 10⁻⁸ line. (b) Detailed Manhattan plot around top SNP (rs56055643) along with gene mapping. SNPs in genomic risk loci are color-coded as a function of their maximum r 2 to one of the independent significant SNPs in the locus, as follows: red (r 2 > 0.8), orange (r 2 > 0.6), green (r 2 > 0.4), blue (r 2 > 0.2), and gray (r 2 ⩽ 0.2). (c) Quantile–quantile plot for GWAS results. The empirical and theoretical distributions are shown as black and red lines, respectively. (d) Depiction of the diagnosis by rs56055643 interaction on dentate gyrus volume (±standard error).
Results
Main and interaction effects on HF subregion volumes
Mixed-model regression analyses, controlling for individual differences in ICV (Model 1), showed significant main effects of diagnosis, region, hemisphere, gender, site, and ICV as well as significant diagnosis × region, hemisphere × region, diagnosis × site, and site × region interactions on HF subregion volumes (Table 2). Mixed-model regression analyses, controlling for individual differences in left and right hippocampal volume (Model 2), showed significant main effects of region, hemisphere, gender, age, site, and hippocampal volume, as well as significant diagnosis × region, hemisphere × region, and site × region interactions, though the effects of diagnosis was no longer significant (Table 2). The diagnosis × region interaction was also significant when fissure volumes were excluded from the analysis [F (10,613) = 2.64, p < 0.004 (Model 1); F (10,635) = 2.83, p < 0.002 (Model 2)].
Table 2. Effects on hippocampal subregion volumes based on multivariate mixed-model regression analyses

nDF, nominator degrees of freedom; dDF, denominator degrees of freedom.
Model 1 statistically controls for individual differences in intracranial volume (ICV). Model 2 statistically controls for individual differences in hippocampal volume.
p-values <0.05 are listed in bold.
Decomposition of the diagnosis × region interaction in the model controlling for ICV (Model 1) showed that subjects with schizophrenia, compared to healthy subjects, had significantly smaller GC-ML-DG (t 644 = −4.82, p < 0.0001; −4.1%, Cohen's d = −0.57), CA4 (t 640 = −4.64, p ⩽ 0.001; −4.0%, d = −0.55), molecular_layer_HP (t 644 = −3.94, p ⩽ 0.0001; −4.0%, d = −0.47), hippocampal tail (t 660 = −3.7, p = 0.0002; −3.1%, d = −0.44), CA1 (t 645 = −3.26, p = 0.001; −3.1%, d = −0.39), presubiculum (t 645 = −2.88, p = 0.004; −2.9%, d = −0.34), fimbria (t 623 = −3.67, p = 0.008; −5.4%, d = −0.32), subiculum (t 650 = −2.61, p = 0.009; −2.3%, d = −0.31), HATA (t 641 = −2.41, p = 0.02; −3.0%, d = −0.29), CA3 (t 635 = −2.03, p < 0.04; −2.4%, d = −0.24), and parasubiculum (t 615 = −1.97, p < 0.05; −3.4%, d = −0.24) volumes, and larger hippocampal fissure (t 632 = 3.18, p = 0.002; +5.0%, d = 0.38) volumes (all p-value reported are two-tailed). GC-ML-DG, CA4, molecular_layer_HP, hippocampal tail, CA1, and hippocampal fissure group differences were also significant at the Bonferroni multiple comparison correction threshold of p < 0.004 when controlling for ICV (Fig. 1b).
Decomposition of the diagnosis × region interaction in the model controlling for hippocampal volume (Model 2) showed a similar profile to that in model 1. Subjects with schizophrenia, compared to healthy subjects, had significantly smaller GC-ML-DG (t 599 = −3.6, p = 0.0003; Cohen's d = −0.43), CA4 (t 605 = −3.25, p = 0.001; d = −0.39), molecular_layer_HP (t 490 = −2.8, p = 0.005; d = −0.33), and hippocampal tail (t 645 = −2.14, p < 0.03; d = −0.26), but not CA1 (d = −0.20), presubiculum (d = −0.09), fimbria (d = −0.08), subiculum (d = −0.06), HATA (d = −0.03), CA3 (d = 0), and parasubiculum (d = 0); in this secondary analysis, the hippocampal fissure remained significantly larger in schizophrenia compared with healthy volunteers (t 638 = 5.36, p < 0.0001; d = 0.65) volumes. Only the GC-ML-DG, CA4, molecular_layer_HP, and hippocampal fissure group differences were significant at the Bonferroni multiple comparison correction threshold of p < 0.004 when controlling for hippocampal volume (Fig. 1c). Given that DG volume showed the largest differences between individuals with schizophrenia and healthy volunteers, further association and GWA analysis focused on this region.
Decomposition of the region × hemisphere interaction based on the Model 1 analysis showed that left hemisphere GC-ML-DG, CA1, CA3, CA4, molecular_layer_HP, hippocampal tail, and HATA region volumes were smaller than right hemisphere volumes (all p-values <0.0001), while left hemisphere subiculum (p < 0.05), presubiculum (p < 0.0001), and parasubiculum volumes were larger than right hemisphere volumes. Left and right hemisphere volumes for the fimbria and hippocampal fissure were equivalent. Finally, there is a consistent pattern of lower GC-ML-DG volume in individuals with schizophrenia compared with controls across the seven sites (online Supplementary Fig. S2).
Associations with neuropsychological performance
DG (GC-ML-DG) and CA4 volumes showed significant associations with visual learning and speed of processing, molecular layer volumes showed significant associations with visual learning and CMINDS composite, while the hippocampal tail showed significant associations with attention/vigilance (p < 0.0018, 0.05/7/4 = 0.0018, Bonferroni; see online Supplementary Table S2).
Novel genome-wide markers associated with DG volume
No SNPs showed a genome-wide significant main effect on DG volume. The GWA analysis did identify a genome-wide significant diagnosis × SNP interaction (p < 5 × 10⁻⁸) on DG volume for rs56055643 (β = 10.75, 95% CI 7.0–14.5, s.e. = 1.91; T-statistic = 5.63, p = 4.8 × 10⁻⁸) located on Chromosome 3 near MOBP (Fig. 2 and online Supplementary Table S4). Decomposition of the diagnosis × SNP interaction showed a positive main effect of the rs56055643 A allele in schizophrenia (β = 4.79, 95% CI 1.8–7.82, s.e. = 1.54; T-statistic = 3.10, p = 0.002) and a negative main effect of the rs56055643 A allele in healthy volunteers (β = −5.14, 95% CI −7.9 to 2.41, s.e. = 1.40; T-statistic = −3.69, p = 0.0003; Fig. 2d). The effect of genotype remained significant within the schizophrenia group when either antipsychotic type (typical, atypical, both, or none) or chlorpromazine medication dose were included as covariates in the analysis. Gene-based analysis based on this GWA summary found that several additional genes, including MOBP, RPSA, and SLC25A38, were significantly associated with DG volume (Table 3). The gene expression heatmap shows that each of these genes is expressed in the brain, including in the hippocampus (online Supplementary Fig. S1).
Table 3. Gene-based analysis based on dentate gyrus genome-wide association results

CHR: chromosome; Start: start location of gene in base pairs; End: end location of gene in base pairs; Gene based p-value: gene-based test p-value based on GCTA. The association p-value for a set of SNPs (±50 Kb of UTRs) from an approximated distribution of the sum of χ2-statistics over the SNPs was calculated based on the GWAS data and LD correlations between SNPs from 1000 Genomes Project samples as a reference. Genome-wide significance was defined at p = 0.05/24 765 (the number of total genes) = 0.0000020
Discussion
We found, to our knowledge for the first time, a significant group by HF subregion interaction, indicating regional variation in HF volume deficits in schizophrenia, significant associations between DG volumes and visual memory and speed of processing in the overall sample, and a genome-wide significant SNP associated with DG volume.
All HF subregion volumes were smaller and hippocampal fissure volume was larger (at p < 0.05) in individuals with schizophrenia compared to healthy controls when controlling for individual differences in ICV; GC-ML-DG, CA4, molecular_layer_HP, hippocampal tail, CA1, and hippocampal fissure volume group differences survived multiple comparison correction.
GC-ML-DG, CA4, molecular_layer_HP, and hippocampal tail volumes were smaller and hippocampal fissure volume was larger (at p < 0.05) in individuals with schizophrenia compared to healthy controls when controlling for individual differences in hippocampal volumes; GC-ML-DG, CA4, and hippocampal fissure group differences survived multiple comparison correction.
We found that these regional volume abnormalities were independent of possible confounding effects of differences in smoking habits between schizophrenia and healthy volunteers, were not associated with ethnicity, and were not correlated with antipsychotic medication dose.
Our findings are largely consistent with prior studies that also found CA1, CA2/3, CA4/DG, molecular_layer_HP, subiculum, presubiclum, hippocampal tail volume deficits (Francis et al., Reference Francis, Seidman, Tandon, Shenton, Thermenos, Mesholam-Gately, van Elst, Tuschen-Caffier, DeLisi and Keshavan2013; Mathew et al., Reference Mathew, Gardin, Tandon, Eack, Francis, Seidman, Clementz, Pearlson, Sweeney, Tamminga and Keshavan2014; Haukvik et al., Reference Haukvik, Westlye, Mørch-Johnsen, Jørgensen, Lange, Dale, Melle, Andreassen and Agartz2015; Kawano et al., Reference Kawano, Sawada, Shimodera, Ogawa, Kariya, Lang, Inoue and Honer2015; Hýža et al., Reference Hýža, Kuhn, Češková, Ustohal and Kašpárek2016; Ho et al., Reference Ho, Holt, Cheung, Iglesias, Goh, Wang, Lim, de Souza, Poh, See, Adcock, Wood, Chee, Lee and Zhou2017a, Reference Ho, Iglesias, Sum, Kuswanto, Sitoh, De Souza, Hong, Fischl, Roffman, Zhou, Sim and Holt2017b; Ota et al., Reference Ota, Sato, Hidese, Teraishi, Maikusa, Matsuda, Hattori and Kunugi2017; Rhindress et al., Reference Rhindress, Robinson, Gallego, Wellington, Malhotra and Szeszko2017) at p < 0.05. Moreover, our FreeSurfer 6.0 findings are also consistent with a recent meta-analysis, which reported the largest effect size for combined DG/CA4 volume deficits in schizophrenia based on predominantly FreeSurfer 5.3 studies (Haukvik et al., Reference Haukvik, Tamnes, Söderman and Agartz2018). Lower bilateral CA4, DG, and CA1 volumes have also been observed in individuals with first-episode psychosis (Baglivo et al., Reference Baglivo, Cao, Mwangi, Bellani, Perlini, Lasalvia, Dusi, Bonetto, Cristofalo, Alessandrini, Zoccatelli, Ciceri, Dario, Enrico, Francesca, Mazzi, Paolo, Balestrieri, Soares, Ruggeri and Brambilla2017). We found fimbria (p < 0.05) and fissure volume abnormalities in schizophrenia compared to healthy volunteers, which were not reported previously. Possible reasons for the discrepancy are lower measurement accuracy of the smaller subregions, as well as between study differences in status and duration of illness (Ho et al., Reference Ho, Holt, Cheung, Iglesias, Goh, Wang, Lim, de Souza, Poh, See, Adcock, Wood, Chee, Lee and Zhou2017a). FreeSurfer 6.0 enables separate estimates for GC-ML-DG, CA4, and CA3 volumes, which was not possible in previous FreeSurfer versions (5.1/5.3). Our finding that DG volume is significantly smaller in schizophrenia compared to control subjects based on FreeSurfer 6.0, corroborates that from an independent study that assessed HF volumes with automatic segmentation of hippocampal subfields (ASHS) (Ota et al., Reference Ota, Sato, Hidese, Teraishi, Maikusa, Matsuda, Hattori and Kunugi2017).
Furthermore, while some studies suggest that hippocampal volume deficits are largely similar across subregions (Haukvik et al., Reference Haukvik, Westlye, Mørch-Johnsen, Jørgensen, Lange, Dale, Melle, Andreassen and Agartz2015), the present study found a significant group × region interaction even when controlling for whole hippocampal volume. These findings indicate regional variability in HF subregion volume abnormalities in schizophrenia independent from overall hippocampal volume. Moreover, the interaction remained significant when the hippocampal fissure was excluded from the analysis. The present study thus provides robust evidence for regional variability in volume deficits within the HF in schizophrenia.
DG volume was significantly positively associated with visual memory and speed of processing performance in the overall sample, findings that are in line with the dysfunctional DG hypothesis in schizophrenia (Tamminga et al., Reference Tamminga, Stan and Wagner2010, Reference Tamminga, Southcott, Sacco, Wagner and Ghose2012). Interestingly, several mouse models of schizophrenia – including Ca2+/calmodulin-dependent protein kinase IIα heterozygous, Schnurri-2 knockout, mutant synaptosomal-associated protein 25 knock-in, and forebrain-specific calcineurin knockout mice – show DG dysfunction due to an immature DG, which has also been observed in schizophrenia (Walton et al., Reference Walton, Zhou, Kogan, Shin, Webster, Gross, Heusner, Chen, Miyake, Tajinda, Tamura, Miyakawa and Matsumoto2012) and could underlie the observed volume deficit (Hagihara et al., Reference Hagihara, Takao, Walton, Matsumoto and Miyakawa2013; Ohira et al., Reference Ohira, Kobayashi, Toyama, Nakamura, Shoji, Takao, Takeuchi, Yamaguchi, Kataoka, Otsuka, Takahashi and Miyakawa2013). These mouse models of psychosis all show memory deficits, suggesting that DG dysfunction may be associated with memory deficits in schizophrenia. Though, the association between visual memory and volume was not unique to the DG, and was also observed for the CA4 and the molecular layer. Differential associations between HF subregion volumes and cognitive performance will require additional study and replication. We found no significant associations between DG volume and age at onset, duration of illness, or symptom severity, though associations between brain volumes and symptom measures are often weak and may require larger samples.
Although there have been several GWA studies on hippocampal volume, to our knowledge this is the first report to identify loci associated with DG volume in a schizophrenia sample. The top SNP, rs56055643, with a p-value less than the 5 × 10⁻⁸ standard genome-wide threshold, and several SNPs in high linkage disequilibrium with p-values less than 1 × 10⁻⁷ are located on chromosome 3 near the genes RPSA and MOBP. The gene-based analysis also suggests the association of these genes with DG volume.
RPSA, expressed in the hippocampus, encodes 40S ribosomal protein SA that is required for the assembly and/or stability of the 40S ribosomal subunit. This protein plays a role as a cell surface receptor for laminin, which plays an important role in cell differentiation, migration, and adhesion as well as synapse stabilization (Omar et al., Reference Omar, Campbell, Xiao, Zhong, Brunken, Miner, Greer and Koleske2017). Importantly, this protein interacts with ZNF804A, a well-known schizophrenia risk gene (Steinberg et al., Reference Steinberg, Mors, Børglum, Gustafsson, Werge, Mortensen, Andreassen, Sigurdsson, Thorgeirsson, Böttcher, Olason, Ophoff, Cichon, Gudjonsdottir, Pietiläinen, Nyegaard, Tuulio-Henriksson, Ingason, Hansen, Athanasiu, Suvisaari, Lonnqvist, Paunio, Hartmann, Jürgens, Nordentoft, Hougaard, Norgaard-Pedersen, Breuer, Möller, Giegling, Glenthøj, Rasmussen, Mattheisen, Bitter, Réthelyi, Sigmundsson, Fossdal, Thorsteinsdottir, Ruggeri, Tosato, Strengman, Kiemeney, Melle, Djurovic, Abramova, Kaleda, Walshe, Bramon, Vassos, Li, Fraser, Walker, Toulopoulou, Yoon, Freimer, Cantor, Murray, Kong, Golimbet, Jönsson, Terenius, Agartz, Petursson, Nöthen, Rietschel, Peltonen, Rujescu, Collier, Stefansson, St Clair and Stefansson2011; Zhang et al., Reference Zhang, Valenzuela, Lu, Meng, Guo, Du, Kang and Ma2011), and rescues the migration and translational defects caused by ZNF804A knockdown. RPSA is enriched in mature compared to immature DG granule cells (Chatzi et al., Reference Chatzi, Zhang, Shen, Westbrook and Goodman2016) consistent with models that have hypothesized an immature DG in schizophrenia (Walton et al., Reference Walton, Zhou, Kogan, Shin, Webster, Gross, Heusner, Chen, Miyake, Tajinda, Tamura, Miyakawa and Matsumoto2012).
MOBP, expressed in hippocampal oligodendrocytes, encodes myelin-associated oligodendrocyte basic protein. Recent studies suggest that oligodendrocyte function and myelination are disrupted in schizophrenia (Kubicki et al., Reference Kubicki, McCarley and Shenton2005; McInnes and Lauriat, Reference McInnes and Lauriat2006) and a study combining PGC schizophrenia risk loci, lifespan gene expression data, and schizophrenia methylome data has identified MOBP as an SNP-rich gene expression hub (Hegyi, Reference Hegyi2017). Lower numbers of oligodendrocytes have been observed in the hippocampal CA4 subfield in individuals with schizophrenia (Schmitt et al., Reference Schmitt, Steyskal, Bernstein, Schneider-Axmann, Parlapani, Schaeffer, Gattaz, Bogerts, Schmitz and Falkai2009) and altered levels of myelin basic protein (MBP) have been reported in schizophrenia and bipolar disorder compared to controls (Chambers and Perrone-Bizzozero, Reference Chambers and Perrone-Bizzozero2004) providing evidence for the myelin hypothesis in schizophrenia. Muted myelination could contribute to lower CA4 and DG volumes in schizophrenia. The rs56055643 SNP, located on near MOBP, was also associated with CA4 volume (β = 9.30, 95% CI 5.77–12.82, s.e. = 1.80; T-statistic = 5.17, p = 4.7 × 10⁻⁷) but not with whole hippocampus volume (p = 0.64). Likewise, the gene-based analysis also showed that MOBP is associated with CA4 (p = 0.0002) but not with whole hippocampus volume (p = 0.60).
SLC25A38, or appoptosin, belongs to the SCL25 mitochondria solute carrier family, is expressed in hippocampal neurons, and has been linked to apoptosis (Zhang et al., Reference Zhang, Zhang, Chen, Huang, Zhou, Wang, Xian, Zhang, Masliah, Chen, Han, Bu, Reed, Liao, Chen and Xu2012). Moreover, MOBP SNPs were strongly associated with appoptosin expression (Höglinger et al., Reference Höglinger, Melhem, Dickson, Sleiman, Wang, Klei, Rademakers, de Silva, Litvan, Riley, van Swieten, Heutink, Wszolek, Uitti, Vandrovcova, Hurtig, Gross, Maetzler, Goldwurm, Tolosa, Borroni, Pastor, Cantwell, Han, Dillman, van der Brug, Gibbs, Cookson, Hernandez, Singleton, Farrer, Yu, Golbe, Revesz, Hardy, Lees, Devlin, Hakonarson, Müller and Schellenberg2011). These findings may suggest that SLC25A39 and MOBP may be differentially involved in the regulation of survival or maturation of newly generated DG neurons in schizophrenia compared to controls (Chambers and Perrone-Bizzozero, Reference Chambers and Perrone-Bizzozero2004).
It has been argued that imaging associations that are observed only in patients should be viewed with caution (Carter et al., Reference Carter, Bearden, Bullmore, Geschwind, Glahn, Gur, Meyer-Lindenberg and Weinberger2017). We agree with this viewpoint but also note that genetic loci may have differential effects within the context of a disease. Therefore testing for diagnosis by SNP interaction effects may provide additional insights that may be missed when testing only for main effects of SNPs across diagnostic groups. Moreover, the observation that rs56055643 alleles show opposing effects in individuals with schizophrenia and healthy individuals could not have been observed in studies that perform genetic analyses using categorical (e.g. case–control) as opposed to quantitative traits.
This imaging study has several notable strengths. First, this study has a robust sample size for an imaging study including 176 schizophrenia and 173 healthy subjects recruited from multiple centers strengthening the generalizability of the findings. Second, this study demonstrated a significant group × region interaction on hippocampal subregion volumes indicating, to our knowledge for the first time, that in schizophrenia, not all HF subregions are affected equally. Third, the percent difference in volume between schizophrenia and healthy volunteers tracks the group contrast effect sizes and suggest that the effect sizes are not merely due to differences in measurement error between the regions. Fourth, this study tests for group by SNP interactions on a quantitative phenotype, an analysis strategy that is less frequently employed but may yield novel insights into gene–phenotype relationships. Finally, this study adheres to the best of its abilities to the ‘Strengthening the Reporting of Observational Studies in Epidemiology (STROBE) and Strengthening the REporting of Genetic Association studies’ (STREGA) guidelines (online Supplementary Table S5).
Some limitations must also be noted. First, FreeSurfer's hippocampal subregion method was developed using ultra-high-resolution brain imaging data with a within-plane resolution of 380 µm and 0.8 mm slice thickness (Van Leemput et al., Reference Van Leemput, Bakkour, Benner, Wiggins, Wald, Augustinack, Dickerson, Golland and Fischl2008) and may require additional validation for use with conventional resolution imaging data. It should be noted that our findings in part replicate previous reports based on ultra-high-resolution scans as discussed above (Ota et al., Reference Ota, Sato, Hidese, Teraishi, Maikusa, Matsuda, Hattori and Kunugi2017), corroborating prior reports that the method may also be applicable to high-quality conventional resolution structural imaging data (Iglesias et al., Reference Iglesias, Sabuncu and Van Leemput2013). Furthermore, the fact that most subregion volumes are smaller while the fissure is larger in individuals with schizophrenia when compared to healthy controls indicates that the method makes local adjustments to the subregions. Second, we report to our knowledge a first GWAS with DG volume as a quantitative trait in schizophrenia and these findings warrant replication in an independent sample. Third, while no effects of ethnicity on HF subregion volumes were observed and while differences in ethnicity in the GWA analyses were controlled for using MDS components, only analyses in ethnically homogeneous samples can fully exclude ethnic influences on GWA findings. Finally, while the use of multi-scanner imaging data may be viewed as a weakness, numerous studies have shown that larger samples based on multi-scanner data improves power to detect effects rather than increases noise over signal (Fennema-Notestine et al., Reference Fennema-Notestine, Gamst, Quinn, Pacheco, Jernigan, Thal, Buckner, Killiany, Blacker, Dale, Fischl, Dickerson and Gollub2007; Segall et al., Reference Segall, Turner, van Erp, White, Bockholt, Gollub, Ho, Magnotta, Jung, McCarley, Schulz, Lauriello, Clark, Voyvodic, Diaz and Calhoun2009; van Erp et al., Reference van Erp, Greve, Rasmussen, Turner, Calhoun, Young, Mueller, Brown, McCarthy, Glover, Lim, Bustillo, Belger, McEwen, Voyvodic, Mathalon, Keator, Preda, Nguyen, Ford and Potkin2014; Boedhoe et al., Reference Boedhoe, Schmaal, Abe, Ameis, Arnold, Batistuzzo, Benedetti, Beucke, Bollettini, Bose, Brem, Calvo, Cheng, Cho, Dallaspezia, Denys, Fitzgerald, Fouche, Giménez, Gruner, Hanna, Hibar, Hoexter, Hu, Huyser, Ikari, Jahanshad, Kathmann, Kaufmann, Koch, Kwon, Lazaro, Liu, Lochner, Marsh, Martínez-Zalacaín, Mataix-Cols, Menchón, Minuzzi, Nakamae, Nakao, Narayanaswamy, Piras, Piras, Pittenger, Reddy, Sato, Simpson, Soreni, Soriano-Mas, Spalletta, Stevens, Szeszko, Tolin, Venkatasubramanian, Walitza, Wang, van Wingen, Xu, Xu, Yun, Zhao, Thompson, Stein and van den Heuvel2017). Moreover, mean DG volume was smaller in schizophrenia than healthy subjects within each site.
In conclusion, we found volumetric abnormalities in some but not all hippocampal subregions in schizophrenia. In particular, DG was most severely affected and associated with visual memory and speed of processing deficits. Further, we identified novel genome-wide significant loci associated with DG volume. These findings support the DG dysfunction hypothesis of psychosis in schizophrenia (Tamminga et al., Reference Tamminga, Stan and Wagner2010, Reference Tamminga, Southcott, Sacco, Wagner and Ghose2012). They also suggest novel biological insights in DG pathophysiology [e.g. oligodendrocyte (MOBP), cell differentiation, migration, adhesion (RPSA), or maturation/apoptosis (SLC25A38) aberrancies]. Overall, our finding that not all HF subregion volumes are equally affected in schizophrenia suggests the involvement of different biological mechanisms between HF subregion, and that examining HF subregion abnormalities, including DG morphology and function as representative intermediate phenotypes, combined with genetics may allow for more accurate identification of the role of the HF in schizophrenia.
Supplementary material
The supplementary material for this article can be found at https://doi.org/10.1017/S0033291719001144
Author ORCIDs
Theo G. M. van Erp, 0000-0002-2465-2797
Acknowledgements
We are thankful to Mrs Liv McMillan, BS for overall study coordination, Harry Mangalam, Ph.D., Joseph Farran, BS, and Adam Brenner, BS, for administering the University of California, Irvine High-Performance Computing cluster, and to the research subjects for their participation.
Author contributions
Drs Nakahara and Van Erp had full access to all of the data in the study, conducted the statistical analysis, and take responsibility for the integrity of the data and the accuracy of the data analysis. Drs Nakahara and Van Erp drafted the manuscript. All authors critically reviewed the manuscript, provided comments, and approved the manuscript for publication.
Financial support
This work was supported by the National Center for Research Resources at the National Institutes of Health [grant numbers: NIH 1 U24 RR021992 (Function Biomedical Informatics Research Network), NIH 1 U24 RR025736-01 (Biomedical Informatics Research Network Coordinating Center)], the National Center for Research Resources and the National Center for Advancing Translational Sciences, National Institutes of Health, through Grant UL1 TR000153, and the National Institutes of Health through 5R01MH094524, P20GM103472, and R21MH097196. The funding sources had no role in the study design, conduct of the study, data collection, management, analysis, and interpretation of the data; and preparation, review, or approval of the manuscript.
Conflict of interest
Dr Soichiro Nakahara's effort was supported by Astellas Pharma Inc. while he was a visiting scholar in the University of California, Irvine. Dr Bustillo consulted with Novartis and Otsuka Pharmaceuticals. Dr Mathalon consulted for Boerhinger Ingelheim and Takeda. Dr Preda consulted for Boehringer-Ingelheim. Dr Potkin has financial interests in Bristol-Myers Squibb, Eisai, Inc., Eli Lilly, Forest Laboratories, Genentech, Janssen Pharmaceutical, Lundbeck, Merck, Novartis, Organon, Pfizer, Roche, Sunovion, Takeda Pharmaceutical, Vanda Pharmaceutical, Novartis, Lundbeck, Merck, Sunovion and has received grant funding from Amgen, Baxter, Bristol-Myers Squibb, Cephalon, Inc., Eli Lilly, Forest Laboratories, Genentech, Janssen Pharmaceutical, Merck, Otsuka, Pfizer, Roche, Sunovion, Takeda Pharmaceutical, Vanda Pharmaceutical, NIAAA, NIBIB, NIH/NCRR, University of Southern California, UCSF, UCSD, Baylor College of Medicine. Dr Van Erp has had a contract with Otsuka Pharmaceuticals. The remaining authors declare no potential conflict of interest.


