Introduction
Fertilizer nitrogen (N) recommendations in Egypt and elsewhere for wheat (Triticum aestivum L.) generally constitute fixed rates for large areas having similar climates and landforms. Although these general or standard recommendations have served the purpose in producing high yield levels, these cannot achieve high use N efficiency because of spatial and temporal variability in soil N supply. N supply from the soil differs from field to field (spatial variability) and year after year (temporal variability). Optimum rates of N are dependent on yearly environmental conditions that are random and cannot be predicted in advance (Raun et al., Reference Raun, Dhillon, Aula, Eickhoff, Weymeyer, Figueirdeo, Lynch, Omara, Nambi, Oyebiyi and Fornah2019). Further, the standard general fertilizer N recommendations in a region are always associated with risks of low profits and environmental degradation (Fageria and Baligar, Reference Fageria and Baligar2005; Ladha et al., Reference Ladha, Pathak, Krupnik, Six and van Kessel2005; Bijay-Singh, Reference Bijay-Singh2018). Ali et al. (Reference Ali, Ibrahim and Fawy2017) reported that fertilizer N recovery efficiency in wheat in some parts of Egypt was in the range of 35.6–51.1% by following the standard recommendation. Worldwide N recovery efficiency in cereal is reported to be around 35% (Omara et al., Reference Omara, Aula, Oyebiyi and Raun2019).
Increasing synchronization between N needed by the crop and fertilizer N supply is crucial for improving N use efficiency. Applying N when demand by the crop is high will not only increase yield but also N use efficiency (Cassman et al., Reference Cassman, Dobermann, Walters and Yang2003; Diacono et al., Reference Diacono, Rubino and Montemurro2013; Peng et al., Reference Peng, Buresh, Huang, Zhong, Zou, Yang, Wang, Liu, Hu, Tang and Cui2010). Optimization of fertilizer N in several crops was successfully achieved by management approaches following chlorophyll meters and leaf colour charts (LCC) (Ali et al., Reference Ali, Thind, Sharma and Singh2015; Bijay-Hussain et al., Reference Hussain, Zia, Akhtar and Yasin2003; Bijay-Singh et al., Reference Bijay-Singh, Singh and Ali2020; Singh et al., Reference Bijay-Singh, Singh, Ladha, Bronson, Balasubramanian, Singh and Khind2002; Varinderpal-Singh et al., Reference Varinderpal-Singh, Singh, Singh, Thind and Gupta2010). The underlying principle in using these tools is that chlorophyll and N contents of leaves are closely linked with N supply to the crop plants because N is involved in the formation of chloroplasts and is considered a structural element of chlorophyll (Benincasa et al., Reference Benincasa, Antognelli, Brunetti, Fabbri, Natale, Sartoretti, Modeo, Guiducci, Tei and Vizzari2017; Bojovic and Markovic, Reference Bojović and Marković2009; Schepers et al., Reference Schepers, Francis, Vigil and Below1992). These tools can be used in making in-season fertilizer N decisions as these can rapidly and non-destructively quantify leaf N status by measuring spectral properties of leaves. However, protocols for using these gadgets for field-specific N management in wheat will have to be evolved in a given region as per the agronomic practices being followed in the region. No such study has been reported from Egypt where wheat is grown in coarse textured calcareous soils and with standard fertilizer N recommendations as high as 250 kg N ha−1.
The Soil Plant Analysis Development (SPAD) meter and atLeaf meter are the commonly used chlorophyll meters, which provide a quick estimation of relative chlorophyll content in leaves. The absolute threshold value and sufficiency index approaches are the widely used criteria to guide fertilizer N application in wheat using chlorophyll meters (Islam et al., Reference Islam, Haque, Akter and Karim2014; Bijay-Singh et al., 2002; 2013; Reference Bijay-Singh, Singh, Singh, Kumar, Sharma, Thind, Choudhary and Vashistha2018; Bijay-Singh and Ali, Reference Bijay-Singh and Ali2020). Although most of the investigations conducted so far have used SPAD meter, it has been found that the performance of the recently introduced atLeaf meter is comparable to SPAD meter (Basyouni et al., Reference Basyouni, Dunn and Goad2015; Dunn et al., Reference Dunn, Singh, Payton and Kincheloe2018; Zhu et al., Reference Zhu, Tremblay and Liang2012). In a study conducted by Ali et al. (Reference Ali, Ibrahim and Singh2020) on wheat, atLeaf meter could capture the variation in N uptake to the tune of 55.3%.
LCC operates differently than the chlorophyll meters as it allows comparing visually the different scores on the chart with leaf greenness. The LCC has been used as an indicator of N status in leaves and then to guide field-specific fertilizer N applications in wheat, maize and rice (Alam et al. Reference Alam, Ladha, Rahman, Khan, Khan and Buresh2006; Ali et al., Reference Ali, Thind, Sharma and Singh2015; Bijay-Singh et al., Reference Bijay-Singh, Singh, Ladha, Bronson, Balasubramanian, Singh and Khind2002; Varinderpal-Singh et al. Reference Varinderpal-Singh, Singh, Singh, Thind, Kumar and Vashistha2011, Reference Varinderpal-Singh, Singh, Singh, Thind, Singh, Kaur, Kumar and Vashistha2012; Bijay-Singh et al., Reference Bijay-Singh, Singh and Ali2020; Witt et al. Reference Witt, Pasuquin, Mutters and Buresh2005). In wheat, Shukla et al. (Reference Shukla, Ladha, Singh, Dwivedi, Balasubramanian, Gupta, Sharma, Singh, Pathak, Pandey and Padre2004) used threshold LCC score 4 as a guide to apply fertilizer N. Compared with the standard recommendation, this management strategy performed better and resulted in high yield and use efficiency. However, Maiti and Das (Reference Maiti and Das2006) found that the LCC score 5 performed better than score 4 in wheat. Varinderpal-Singh et al. (Reference Varinderpal-Singh, Singh, Singh, Thind, Singh, Kaur, Kumar and Vashistha2012) developed an LCC plan for N management in wheat in the Indian Punjab and it consisted of applying 30 or 45 kg N ha−1 at maximum tillering stage based on LCC to be more than or equal to score 4 or less than score 4, respectively.
In a study carried out in ten countries on wheat, IAEA (2000) advocated that most of fertilizer N should be applied by jointing growth stage (Feekes 6) to obtain high grain yield. Several studies have also concluded that in wheat it is the appropriate stage to apply adjustable dose of fertilizer N (Ali, Reference Ali2020; Raun et al., Reference Raun, Solie, Johnson, Stone, Lukina, Thomason and Schepers2001; Bijay-Singh et al. Reference Bijay-Singh, Sharma, Jat, Martin, Chandna, Choudhary, Gupta, Thind, Uppal, Khurana, Uppal and Vashistha2011, Reference Bijay-Singh, Singh, Singh, Thind, Choudhary, Gupta and Vashistha2013; Varinderpal-Singh et al., Reference Varinderpal-Singh, Singh, Singh, Thind, Buttar, Kaur, Kaur and Bhowmik2017). The present study was designed to formulate strategies for fertilizer N application in wheat using atLeaf meter and LCC at Feekes 6 growth stage. Specific objectives were to (i) develop a functional model based on atLeaf meter measurements to predict optimum fertilizer N dose, (ii) establish threshold LCC scores to guide N optimum fertilizer N applications and (iii) compare the improved fertilizer N management strategies with the general fertilizer recommendations.
Materials and Methods
Experimental sites
Eight field experiments on wheat were carried out during three winter seasons (2017/18 to 2019/20) in the West of Delta, Egypt. Experiments 1, 3, 5 and 7 were conducted at the Mariout Research Station Farm of the Desert Research Center (31° 0′ 12.2″ N, 29° 47′ 3.0″ E), located about 200 km away from Cairo. Experiments 2, 4, 6 and 8 were conducted at an on-farm location (30° 48′ 11.7″ N, 29° 44′ 59.8″ E), about 22 km away from the Mariout Research Station. Average rainfall in this area is 180 mm year−1 and it is received mainly in winter. In winter, mean temperature ranged between 10 and 20 °C. Wheat cultivation in the study area is carried out using surface irrigation. From all the experimental sites, soil samples from 0 to 0.15 m depth were collected before seeding of wheat and analyzed for different characteristics (Table 1).
Table 1. Some physical and chemical properties of the surface soil of the experimental sites in the three wheat seasons during 2017–2020

a) Using the pipette method (Page et al., Reference Page, Miller and Keeney1982); b) Measured in soil paste; c) Electrical conductivity measured in soil paste extract; d) Using calcimeter (Nelson, Reference Nelson1983); e) Walkely and Black (Reference Walkley and Black1934); f); Bremner (Reference Bremner1965); g) Olsen et al. (Reference Olsen1954); h) Pratt (Reference Pratt1965).
Treatments and experimental design
To create plots with a range in yield potential and soil N supply, field experiments were conducted at two locations and in two wheat seasons (Experiments 1 and 2 in 2017/18 and Experiments 3 and 4 in 2018/19), with treatments consisting of an increasing rate of fertilizer N from 0 to 320 kg ha−1 applied as ammonium nitrate in doses completed at least 10 days preceding Feekes 6 growth stage. These experiments were used to generate data to establish strategies for field-specific fertilizer N application using atLeaf meter and LCC.
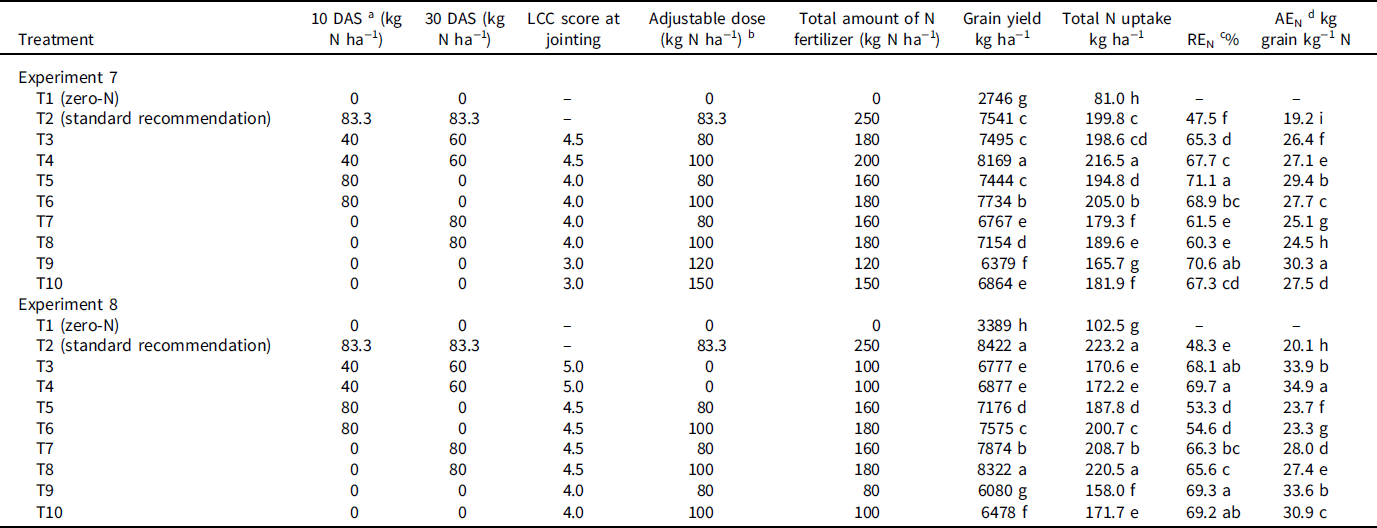
In the 2019/20 wheat season, four experiments were carried out at two locations to validate the established model in this study based on atLeaf meter and threshold scores based on LCC. In the two atLeaf meter experiments (Experiment 5 and 6), besides a no-N control and 250 kg N ha−1 applied in three split doses (the standard recommendation), four treatments consisted of applying (i) 100 kg N ha−1 (40 kg N ha−1 at 10 DAS and 60 kg N ha−1 at 30 DAS), (ii) 80 kg N ha−1 either at 10 DAS or (iii) at 30 DAS and (iv) no prescriptive fertilizer N followed by applying an adjustable dose at Feekes 6 stage using atLeaf meter (Table 2). Also, an N-sufficient plot was maintained by applying 350 kg N ha−1 in both the experiments to ensure that N in this plot is not limited.
Table 2. Wheat grain yields, total N uptake and N use efficiency as influenced by field-specific fertilizer nitrogen management treatments based on atLeaf meter

a DAS = days after seeding.
b atLeaf values in N-sufficient plot were 56.4 and 55.1 in Experiments 5 and 6, respectively.
c Adjustable dose is based on the developed model of atLeaf sensor in treatments 3–6.
d REN = recovery efficiency of N.
e AEN = agronomic efficiency of N.
Critical differences between means were detected by Duncan’s multiple range test (DMRT) at p < 0.05.
In LCC experiments (Experiments 7 and 8), the two adjustable sets consisted of application of 120, 80 or 0 kg N ha−1 and 150, 100 or 0 kg N ha−1 at Feekes 6 stage corresponding to leaf greenness equal to or less than LCC score 4, between 4 and 5 and equal to or more than 5, respectively. Before applying each of the two LCC-guided treatments at Feekes 6 stage, different doses were applied at early stages to create variability and to define the optimum prescriptive N management (Table 3). Besides these treatments, control and the standard recommendation were also included. The treatments in the experiments were organized in a randomized complete block design replicated three times.
Table 3. Wheat grain yields, total N uptake and N use efficiency as influenced by field-specific fertilizer nitrogen management treatments based on leaf colour chart
a DAS = days after seeding.
b Treatments # 3, 5, 7 and 9 are based on application of 120, 80 or 0 kg N ha−1 at leaf greenness equal to or less than LCC score 4, between 4 and 5, and equal to or more than 5. Treatments # 4, 6, 8 and 10 are based on application of 150, 100 or 0 kg N ha−1 at leaf greenness equal to or less than LCC score 4, between 4 and 5, and equal to or more than 5
c REN = recovery efficiency of N.
d AEN = agronomic efficiency of N.
Critical differences between means were detected by Duncan’s multiple range test DMRT) at p < 0.05.
Experimental fields were ploughed, levelled and divided into 15 m2 plots. Wheat variety Giza 171 was sown by hand in early November in all the experiments. Phosphorus (50 kg P2O5 ha−1 as single superphosphate) and potassium (50 kg K2O ha−1 as potassium sulphate) fertilizers were applied. When required, weeds and diseases were controlled following the standard recommendations in the region. The standard recommendations in this region for wheat were obtained from the advisory manual of the Egyptian Ministry of Agriculture and Land Reclamation (http://www.vercon.sci.eg/extpub/NeperWheat.htm).
Measurements of atLeaf meter and LCC
The atLeaf chlorophyll meter (FT Green LLC®, Wilmington, DE, USA) used in this study estimates light transmittance through the measured leaf at two different wavelengths (660 and 940 nm) and generates an index expressing the status of chlorophyll content. The topmost fully expanded leaf was used to collect the atLeaf readings by inserting the middle portion of the leaf in the slit of the meter. The six scores LCC manufactured as per specifications of IRRI (1996) was used in this study. The first fully expanded leaf was matched with the scores on the LCC. Measurements with atLeaf meter and LCC were recorded from 10 to 20 plants in each plot and mean values were calculated. The measurements were collected at 50–55 DAS (Feekes 6 growth stage). Abnormally looking or disease-affected plants were avoided for measurements with atLeaf meter and LCC.
Plant sampling and analysis
Wheat crop was picked manually from an area of 6 m2 in the center of different plots. The collected biomass was separated into grain and straw and weighed. Samples were collected, dried in an oven at about 70 °C to a stable weight and ground for further analysis. Total N content was determined using the micro-Kjeldahl method (Kalra, Reference Kalra1997) after digesting the samples in H2SO4–H2O2 mixture.
Data analysis
Calculations and fitting curves in this study were performed using EXCEL (Microsoft Office 2016). Analysis of variance (ANOVA) was carried out on the data generated from the validation experiments to interpret the results. Duncan’s test at probability level <0.05 was used for detecting the critical differences between means (Gomez and Gomez, Reference Gomez and Gomez1984). Nitrogen use efficiency expressed as apparent recovery (REN) and agronomic (AEN) efficiencies were computed as per the following equations (Cassman et al., Reference Cassman, Peng, Olk, Ladha, Reichardt, Dobermann and Singh1998):
 $$R{E_N}\left( \% \right) = {{Total\;N\;uptake\;in\;fertilized\;plot - Total\;N\;uptake\;in\;control\;N\;plot} \over {Quantity\;N\;fertilizer\;applied}}$$
 $$A{E_N}\;\left( {kg\;grain\;k{g^{ - 1}}\;N} \right) = {{Grain\;yield\;in\;N\;fertilized\;plot - Grain\;yield\;in\;control\;N\;plot} \over {Quantity\;N\;fertilizer\;applied}}$$
Results
Establishment of fertilizer N management strategies using atLeaf meter and LCC
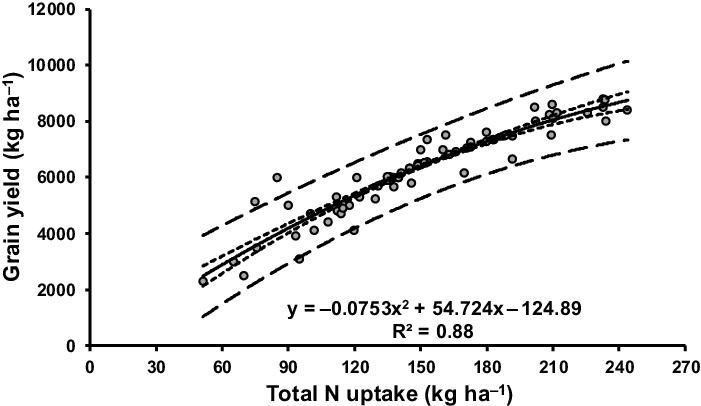
Application of different fertilizer N rates in Experiments 1–4 generated a high degree of variability in atLeaf meter and LCC measurements collected at Feekes 6 stage and grain yield and total N uptake at maturity. Grain yield responded to N uptake following a second-degree regression model (Figure 1). The curve flattened at 9818 kg ha−1 (computed through derivation analysis) with total N uptake of 363 kg N ha−1. Economic yield, defined as 90% of maximum, was found to be 8836 kg ha−1 and it was achievable at total N uptake of 250 kg N ha−1.

Figure 1. Grain yield and total N uptake by wheat fitted to a second-degree regression model. The confidence and prediction intervals at 95% level are the dashed lines near and far the regression solid line, respectively.
The difference in atLeaf measurements collected at Feekes 6 stage from the N-sufficient plot and the test plot was plotted against the difference in optimum total N uptake (uptake at 250 kg fertilizer N ha−1 considered as optimum) and the N uptake in test plot at maturity. As shown in Figure 2, a linear relation forced through the origin (y = bx) was obtained with R 2 value of 0.69. In this model, the intercept was purposely dropped under the assumption that there is no need to apply fertilizer N when atLeaf value in test plot is equal to that in N-sufficient plot. The difference in atLeaf measurements can then predict N uptake to be compensated to achieve target N uptake for optimum grain yield. However, some of the applied fertilizer N will be lost, then an efficiency factor of 0.6 was used as suggested by Morris et al. (Reference Morris, Martin, Freeman, Teal, Girma, Arnall, Hodgen, Mosali, Raun and Solie2006). Thus, the functional model to predict fertilizer N applications at Feekes 6 stage of wheat, as inferred from Figure 2, can be written as:
 $${N\;Fertilizer\;dose\;\left( {kg\;h{a^{ - 1}}} \right) = {{\left( {atLeaf\;value\;in\;the\;N\;sufficient\;plot - atLeaf\;value\;in\;test\;plot} \right)\; \times 25.352} \over {0.6}}}$$

Figure 2. Relationship between the difference in atLeaf index (atLeaf meter reading in the N-sufficient plot minus atLeaf meter reading in test plots) at jointing stage of wheat and the difference in total N uptake between optimum (N uptake taken as 250 kg N ha−1) and that in the test plots fitted to linear regression model forced through the origin. The dashed lines near and far the regression solid line show confidence and prediction intervals at 95% level, respectively.
It can also be summarized by dropping the divider as:
 $${N\;Fertilizer\;dose\;\left( {kg\;h{a^{ - 1}}} \right) = \left( {atLeaf\;value\;in\;the\;N\;sufficient\;plot - atLeaf\;value\;in\;test\;plot} \right) \times 42.25}$$
The LCC scores recorded at Feekes 6 stage were pooled for all locations and seasons. The median value of LCC scores was 4.5, the interquartile range was 4.2–4.8 and 1.5 times the interquartile range was 4–5. It therefore suggests that wheat may respond to fertilizer N when applied at leaf greenness equivalent to LCC scores between 4 and 5. However, when the leaf greenness approaches to LCC score 4, high amount should be required to achieve optimum yield levels, as well as fertilizer N application may be omitted at leaf greenness equivalent to LCC score 5.
Fine-tuning of fertilizer N application using atLeaf meter
Different fertilizer N management scenarios (as shown in Table 2) greatly influenced the atLeaf meter reading and thus the adjustable atLeaf meter-guided N dose at Feekes 6 stage. The doses of fertilizer N as determined from the atLeaf meter reading following the model developed in this study ranged from 106 to 317 kg N ha−1 in Experiment 5 and 80 to 266 kg N ha−1 in Experiment 6. In the Experiment 5, the mean grain yields in different treatments based on atLeaf meter-guided N doses ranged between 7176 and 8372 kg ha−1, whereas in Experiment 6, this range was 7874 and 9831 kg ha−1. In both the experiments, when no prescriptive fertilizer N dose was applied (T6), as expected the atLeaf meter-guided fertilizer N dose was the highest (Table 2). Among the four field-specific N management treatments, the application of total as well as atLeaf meter adjustable dose was the least in T3 in which 40 and 60 kg N ha−1 were applied at 10 and 30 DAS, respectively, before applying the adjustable dose. However, the grain yield in this treatment was statistically similar to that recorded with applying 250 kg N ha−1 in three splits; the total fertilizer N applied in T3 was only 206 and 180 kg N ha−1 in Experiments 5 and 6, respectively. When 80 kg N ha−1 was applied as the prescriptive dose either at 10 DAS (T4) or at 30 DAS (T5), the yields were either at par (Experiment 5) or higher (in Experiment 6) than the yield obtained by following the standard recommendation but at the cost of applying higher amount than in T3.
As both the fertilizer N use efficiency measures – agronomic and recovery efficiencies are determined by yield, N uptake and the quantity of fertilizer N, the statistically highest values of both the measures were observed for the T3 (Table 2). It was true in both Experiments 5 and 6 conducted at two different sites. By following field-specific N management strategy using atLeaf meter, increase of 11% REN and 4 kg grain kg−1 N AEN in Experiment 5 and 13.9% REN and 8.3 kg grain kg−1 N AEN in Experiment 6 were observed over the values recorded for the standard fertilizer recommendation treatment.
Fine-tuning of fertilizer N application using LCC
The results of the performance of the LCC threshold scores proposed in this study for fertilizer N management are shown in Table 3. In Experiment 7, the highest grain yield level was recorded when 40 and 60 kg N ha−1 were applied at 10 and 30 DAS, respectively, as prescriptive doses followed by applying an LCC-guided dose following the criteria of applying 150, 100 or 0 kg N ha−1 based on LCC scores to be equal to or less than 4, between 4 and 5 or equal to or more than 5 (T4). Even when fertilizer N doses for the same LCC thresholds were 120, 80 and 0 (T3), the grain yield was statistically similar to that obtained by following the standard recommended dose of 250 kg N ha−1. In T3 and T4, 180 and 200 kg N ha−1 were applied, respectively. Interestingly, in Experiments 5 and 6 also, the best treatments based on atLeaf meter-guided field-specific N management used almost similar amounts of total N (Table 2). Application of an adjustable dose at the Feekes 6 stage following the two LCC-based criteria along with application of 80 kg N ha−1 at 10 DAS (T5 and T6), grain yields obtained were statistically equal to or more than that recorded in the standard recommendation treatment.
The data pertaining to total N uptake in different experiments, in general, followed the trend in grain yield. Thus, apparent N recovery and agronomic efficiency measures following field-specific N management using LCC resulted in increase of 20.2% REN and 7.9 kg grain kg−1 N AEN in Experiment 7 (T4) and 17.3% REN and 7.3 kg grain kg−1 N AEN in Experiment 8 (T8) over the values recorded for the general recommendation (T2) (Table 3).
Discussion
Wide difference in the amount of atLeaf-guided doses convincingly proves the usefulness of the field-specific N management strategy developed in this study. Obviously, smaller atLeaf meter-guided dose of fertilizer N in Experiment 6 than in Experiment 5 was due to the difference in the soil N supplying capacity at the two field sites. The soil at the site where Experiment 6 was conducted contained 1.77% organic matter as compared to 1.22% in the soil at the site of Experiment 5 (Table 1). It further proves the efficacy of the developed model in guiding field-specific fertilizer N applications in wheat.
Applying fertilizer N whenever chlorophyll meter reading is less than a prescribed absolute value or a sufficiency index (ratio of measurements in the test plot and the N-sufficient strip) are the two mainly used approaches using chlorophyll meters (Bijay-Singh and Ali, Reference Bijay-Singh and Ali2020). However, in crops like wheat, in which fertilizer N is applied at certain stages, application of fixed prescriptive fertilizer N doses interferes with the field-specific N management decisions made following these two strategies thereby leading to suboptimal total fertilizer N application doses. The functional model as developed in this study provides an effective, dynamic and simple way for field-specific fertilizer N applications. For instance, following the relative sufficiency index approach with threshold value of 0.95
 $\left[ {\left( {{\rm{atLeaf\;value\;in\;test\;plot}}} \right)/\left( {{\rm{atLeaf\;value\;in\;N\;sufficient\;plot}}} \right)} \right]$
as extensively used in previous studies, application of fertilizer N at Feekes 6 stage would have been completely skipped in T3 in both Experiments 5 and 6 (Table 2). Also, the sufficiency index approach would have guided application of a similar rate of fertilizer N in T4 and T5, despite a variation in the need of fertilizer N in these treatments.
$\left[ {\left( {{\rm{atLeaf\;value\;in\;test\;plot}}} \right)/\left( {{\rm{atLeaf\;value\;in\;N\;sufficient\;plot}}} \right)} \right]$
as extensively used in previous studies, application of fertilizer N at Feekes 6 stage would have been completely skipped in T3 in both Experiments 5 and 6 (Table 2). Also, the sufficiency index approach would have guided application of a similar rate of fertilizer N in T4 and T5, despite a variation in the need of fertilizer N in these treatments.
In the LCC-based field-specific N management strategy as developed in the present study, criterion for determining fertilizer N allows application of discrete amounts of fertilizer N as per leaf greenness. For example, if the LCC score is equal to or more than shade 5, no fertilizer is to be applied. But if it is just less than shade, the LCC strategy recommends application of 80 or 100 kg N ha−1, which makes a big difference in the performance of the crop. Looking at the data listed in Table 3 for Experiment 8, it is revealed that in T3 and T4, due to application of 100 kg N ha−1 up to 30 DAS, leaf greenness was just equal to LCC shade 5 and decision was made for not application of any fertilizer N at Feekes 6 stage. As a result, total fertilizer N applied in these treatments was 100 kg N ha−1 and accordingly was the performance of the crop. The highest yield was recorded in the treatment based on standard fertilizer recommendation (Table 3). Thus, data from only Experiment 7 were used to draw conclusions about the validity of LCC-based strategy for field-specific N management in wheat.
On an overall basis, results of Experiments 7 and 8 indicate that wheat has a noteworthy ability to respond to fertilizer N applied at Feekes 6 stage. Also in LCC-based application, applying 150 and 100 kg N ha−1 at Feekes 6 stage (T4, T6, T8 and T10) gives better results than 120 and 80 kg N ha−1. Bijay-Singh et al. (Reference Bijay-Singh, Singh, Ladha, Bronson, Balasubramanian, Singh and Khind2002, Reference Bijay-Singh, Singh, Singh, Thind, Choudhary, Gupta and Vashistha2013) and Varinderpal-Singh et al. (Reference Varinderpal-Singh, Singh, Singh, Thind, Singh, Kaur, Kumar and Vashistha2012) convincingly revealed that applying moderate doses of fertilizer N for wheat at seeding and Feekes 2 followed by adjustable dose at Feekes 6 performed better than the standard recommendation. In the present study, application of 100 kg N ha−1 in two doses prior to applying an adjustable dose guided by leaf greenness measured by LCC at Feekes 6 stage was found to be the appropriate strategy of management. This is supported by the fact that N uptake in wheat proceeds very slow at early growth stages and N flux increases to a maximum around Feekes 6 growth stage (Doerge et al., Reference Doerge, Roth and Gardner1991; Shukla et al., Reference Shukla, Ladha, Singh, Dwivedi, Balasubramanian, Gupta, Sharma, Singh, Pathak, Pandey and Padre2004; Tian et al., Reference Tian, Liu, Gu, Yu, Zhang, Zhang, Jiang, Cao and Dai2018).
Conclusions
The standard or general recommendation of fertilizer N consisting of applying a fixed rate for large areas is not optimum to achieve high N use efficiency in wheat in coarse textured calcareous soils in Egypt. Applying an adjustable field-specific dose at Feekes 6 stage using atLeaf- and LCC-based schemes can result in grain yields comparable to those obtained with standard recommendation but with less quantities of fertilizer N. The atLeaf meter-based strategy provides continuous range of adjustable fertilizer N doses so that fertilizer needs of the crop are determined more precisely than LCC-based strategy which recommends discrete fertilizer N doses. These field-specific N management strategies as developed and validated in this study should be readily acceptable with farmers as these are based on one time measurements and fertilizer N decisions can be made with simple calculations.
Acknowledgments
This research work was conducted as part of the project ‘Nitrogen Fertilizer Optimization Technologies for Wheat in Newly Reclaimed Lands (Grant 25447)’ funded by the Science and Technology Development Fund (STDF), Egypt. We acknowledge the support of the STDF.