


INTRODUCTION
Thailand is the third largest producer of palm oil in the world (Murphy, Reference Murphy2014). Palm oil is used in Thailand mainly for domestic consumption such as cooking oil and food processing (Siriwardhana et al., Reference Siriwardhana, Opathella and Jha2009). In 2005, the Thai government aimed for energy self-sufficiency and biofuel from palm oil was presented as the number one choice to reach this goal (Sorda et al., Reference Sorda, Banse and Kemfert2010; Unjan et al., Reference Unjan, Nissapa and Phitthayaphinant2013). The government aimed to expand the oil palm with 400,000 ha between 2008 and 2012 (Dallinger, Reference Dallinger, Colchester and Chao2011) and such plan targeted the South of Thailand, where oil palm production flourishes, but land became scarce (Dallinger, Reference Dallinger, Colchester and Chao2011; Meyer and Preecharjarn, Reference Meyer and Preecharjarn2010) and expansion was much lower than expected. Thus, the government started introducing oil palm plantation in a new area: the Northeast region of Thailand (Daniel et al., Reference Daniel, Lebel, Gheewala and Lebel2010; Suksri et al., Reference Suksri, Moriizumi, Hondo and Wake2008). The Northeast Thailand is characterized by sandy or sandy loam to sandy clay loam soil texture with low to medium fertility. Skeletal soils owing to a shallow laterite layer are widespread in the Sakon Nakon Basin and comprise 13% of the Northeast. Saline and sodic soils commonly occur in the plateau and cover about 17% of the region. Thus, sandy top soils, salt-affected soils and skeletal soils are the three major problems of Northeast Thailand (LDD, 2007). In the Northeast total annual rainfall does not differ much from the South but rain falls mainly in five months. Oil palm production is known to be reduced in areas with dry periods exceeding four months (Corley and Tinker, Reference Corley and Tinker2016; Hartley, Reference Hartley1988). Large parts of the Northeast may thus be unsuitable for oil palm due to inadequate soil texture, low soil fertility, erratic rainfall and water deficits (Tipraqsa et al., Reference Tipraqsa, Craswell, Noble and Schmidt-Vogt2007).
Before 2005, oil palm was not commercially grown in the Northeast. Oil palm seedlings were brought from the South and planted in limited areas. Academic knowledge on oil palm management, growth and yield in the Northeast were not available when oil palm production started (Chaikiattiyos et al., Reference Chaikiattiyos, Srisawangwong and Cheuychoom2008). Then, an experimental plot was established in Nong Khai Agricultural Research and Development Centre (NKR and DC) to test different oil palm varieties and management practices (Thongna et al., Reference Thongna, Skulareewattana, Toonkum and Kumcha2014). In 2014, the oil palm area in this region reached 18,000 ha, mainly in Nong Khai, Ubonratthani and Bueng Kan (OEA, 2016) provinces because of their more suitable conditions according to soil suitability maps, rainfall and shallow level of underground water (LDD, 2007). In general, there are many limiting conditions of the Northeast region that should be considered such as unfavourable distribution of rainfall, lack of irrigation systems and inadequate fertilization management (Ali et al., Reference Ali, Rosete, Taban and Ascaño2008). Therefore, the expectation of oil palm yield is less than the average of 20 Mg ha−1 year−1 in the South (Daniel et al., Reference Daniel, Lebel, Gheewala and Lebel2010).
Good Agricultural Practice (GAP) recommendations in the Northeast were based on those developed by Surat Thani Oil palm Research Centre (STOC) in the South under the Department of Agriculture (DOA). Fertiliser recommendations for oil palm were based on the South where soil textures are clay loam, which differs from most soil textures of the Northeast. To overcome problems with soil fertility and water deficits, GAP for the Northeast includes recommendations for irrigation and guidelines for selection of suitable soils, taking into account that adequate fertiliser application may compensate for lack of soil nutrients (Ali et al., Reference Ali, Rosete, Taban and Ascaño2008; Pratummintra et al., Reference Pratummintra, Van Ranst, Verplancke, Verdoodt, Langouche and Ranst2006). To encourage farmers to participate in this new crop, the government provided free seedlings (Surat-Thani II) and low interest loans for new oil palm farmers. To get access to seedlings and loans farmers were required to follow courses on GAP and their fields needed to be approved as suitable for oil palm plantation. The government promoted oil palm as an alternative cash crop to substitute rice on land with low productivity and to be planted in flooded areas (Sethaputra, Reference Sethaputra2014). A survey amongst 108 oil palm smallholders and an equal number of non-adopters in Nong Khai province in 2013 showed that that the average total farm size of oil palm adopters was larger than for non-adopters with 6.5 and 4.4 ha, respectively. Somnuek, et al., (Reference Somnuek, Slingerland and Grünbühel2016) reported the average area under oil palm was 1.7 ha. Farmers investing in oil palm based their livelihood around on-farm production, whereas non-adopters diversified more with off-farm income sources. Oil palm had been tried mainly by wealthier farmers with an aim to further diversify on-farm household income.
Oil palm production depends on production defining, limiting and reducing factors; defining factors are seedling variety, CO2, radiation and temperature (Corley and Tinker, Reference Corley and Tinker2016; Hartley, Reference Hartley1988), limiting factors are water and nutrients whereas reducing factors consist of weeds, pests, diseases and pollutants. When limiting and reducing factors are absent we talk about the potential yield (van Ittersum et al., Reference Van Ittersum, Cassman, Grassini, Wolf, Tittonell and Hochman2013; Woittiez et al., Reference Woittiez, Wijk, Slingerland, Noordwijk and Giller2017). To what extent reducing and limiting factors are alleviated not only depends on knowledge but also on socio-economic and institutional opportunities and constraints that affect management decisions of smallholders (Hardjono et al., Reference Hardjono, Ranamukhaarachchi and Singh2003; Rist et al., Reference Rist, Feintrenie and Levang2010). This paper aims to assess the practices of oil palm cultivation in Northeast Thailand. It investigates to what extent GAP are applied and which factors are responsible for good compliance. The paper aims to assess how many months GAP for water application is needed and to explain yield differences from differences in tree age, management and soil texture.
MATERIALS AND METHODS
Study area
Data collection was conducted in Nong Khai and Beung Kan province (17–18 °N, 103–104 °E, at 169 m above sea level). After 23th March 2011, Bueng Kan province was separated from Nong Khai (Somnuek et al., Reference Somnuek, Slingerland and Grünbühel2016). The study was divided into two parts. First, a survey was conducted between July and August 2013 in 14 randomly selected villages of six districts: Phonphisai, Rattanawapi, Fao-Rai, Sega, Sophisai and Bueng Kan district. The total number of oil palm farmers in six districts of Nong Khai province was 1375 households (S. Somnuek, records of Nong Khai Research Centre September 24, 2014).
Data collection
For the study 108 oil palm farmers were selected randomly from the database of the centre that distributed ‘Surat-Thani II’ seedlings. Questions were asked about farmers’ oil palm management practices compared with GAP recommendations (Table 1) and more detailed questions were asked about their oil palm plots such as the age of the trees, description of the plot, investment cost, price of FFB and yield. Socio-economic household variables collected are amongst others farmer's age, education, on-off farm income, land areas, agricultural training course, number of family members, number of household labour, amount of debts.
Table 1. Degree of technology based on the frequency of application of GAP in oil palm.
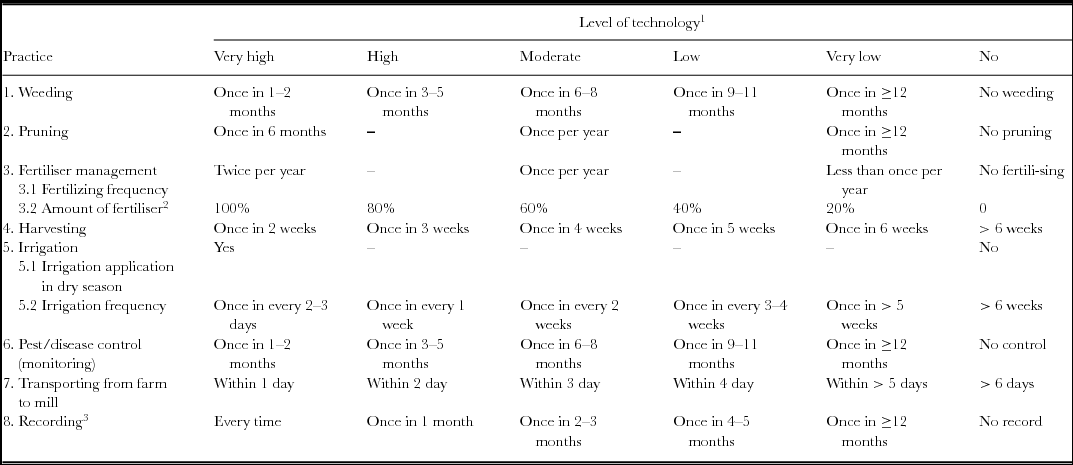
1 Classification by author;
2 Amount of fertiliser was scored separately for N, P, K, Mg and B;
3 Recording includes costs of investments, amount of input use, yields and management activities
Second, a detailed monitoring of 25 farmers took place in Phonphisai, Rattanawapi, Fao-Rai, Sega and Bueng Kan district, where oil palms had been established for 4–7 years. On these farms data collection on farmers’ management practices and yields were done through recall once every two weeks by telephone from October 2013 to September 2015 (two years). Questions referred to practices present in GAP recommendations. Triangulation of reported data took place during six monthly field visits when farmer records and fields were checked.
Weather data
Between 2006 and 2015 weather information (Table 2) was collected by a meteorological station in Nong Khai Rubber Research Centre (NKRRC), which is located at 173 m above sea level, close to the field station where the demonstration plot was located. We estimated the monthly water balance in the study area by using WB = P – ETo – DD + I (Surre, Reference Surre1968), where WB (Water balance) = the change in root zone soil water storage over the time period of interest (mm); P = daily rainfall (mm); ETo = daily reference evapotranspiration (mm) by Penman–Monteith equation (Allen et al., Reference Allen, Pereira, Raes and Smith1998); DD = daily deep drainage out of the root zone (mm); I = daily irrigation (mm). We did not distinguish between soil types and used DD = 0, assuming that no water was drained out of the root zone of the oil palm tree. There was no irrigation (I = 0). The sum of the daily outcomes was divided by the number of days to obtain the monthly values presented in Table 2.
Table 2. Annual rainfall, number of months with rainfall less than 100 mm and number of months with less than 10 rainy days for each year from 2006–2015 (a), Monthly rainfall, number of rainy days month−1, average daily temperature month−1, ETo and Water balance month−1, all for January–December in 2006–2015 (b).

Soil type
Soil in Nong Khai province is classified by LDD (2007) in Phon Phisai series and it is categorized in two horizons: the upper soil (0–50 cm) - soil textures are loamy clay, loamy sand with granules or clay with granules, soil colours are brown or dark brown with a pH of 5.0–6.5; the lower soil (50–100 cm depth) – soil textures are loamy with more granules or clay with more granules, soil colours are greyish brown or light grey with red dot of soil stones, dark brown or yellowish brown with a pH of 4.5–5.5. This soil series is created from sedimentary rock that has been eroding.
Data analysis
Data were analysed using descriptive statistics, ANOVA, t-test, correlation and regression. To assess how far farmers are from implementing GAP, we scored each farmer on the technology levels according to Table 1 (5 = very high, 0 = no application). Maximum GAP score is 70 composed of 9 × 5 (score per practice from Table 1) plus 5 × 5 (score per fertiliser, Table 3). We averaged the scores over all surveyed and all monitored farmers for each of the two monitoring years. Multiple linear regression was used to explore the relation between total GAP scores per household and socio-economic household variables (Supplementary Table S1). Qualitative data were verified through triangulation between the following data sources: survey, in-depth interviews, personal observations, government documents and the literature.
Table 3. Amount of fertiliser applied in the survey group (n = 108) and the monitored group (n = 25) compared to GAP (kg/tree/year).

Number in parentheses indicated standard deviation
1 In 2nd year additional K fertiliser was provided by external party
RESULTS AND DISCUSSION
Compliance with GAP – weeding, pruning and harvesting
Weeding was done before fertiliser application and was needed at least for the first five years after plantation because the weeds compete with young oil palm plants for water and nutrients. Farmers mainly weeded using a mowing machine and rarely used agro-chemicals. In trees of seven years of age and older weeding was no longer done because by then oil palm canopies were closed blocking sunlight to favour weed growth. Farmers started to prune oil palm leaves at 3–4 years of age. They kept 1–3 cycles of fronds to support bunches following the recommendation (DOA, 2003). Farmers are aware that severe defoliation of oil palm will reduce photosynthesis, dry matter production and yield (Corley and Tinker, Reference Corley and Tinker2016). The pruned oil palm fronds were stacked between oil palm rows to replenish organic matter and nutrients and to maintain moisture within the plot.
Fertilizing consists of spreading fertiliser (N, K and Mg) around the projection of the oil palm canopy on the ground while P fertiliser was spread on the frond stacks and boron was put in a space between a frond and oil palm trunk. Farmers did not access empty fruit bunches (EFB) after they sold fresh fruit bunches (FFB) to traders because FFB were transferred to mills in the Central area. Pests and disease within plots were surveyed every month; rats and beetles were controlled in young palm plantings using traps and chemicals in severe cases. Farmers found few shoots and branches damaged by shoot rot disease and rose beetles, and used chemical substances such as carbaryl (Sevin 85% WP) and carbosulfan (Posse 20% EC) in doses following the label. Within the 25 monitored plots no problems were found with pests and diseases.
FFBs were harvested every 2 or 3 weeks. There was no mill in the area and traders collected FFB to sell to the nearest mill which is located in the Central region. Oil palm bunches should be harvested every 15 days but the traders were not always available. When traders come early farmers tend to harvest unripe bunches in need of money. When traders come late farmers will include overripe bunches. Only 70–80 % of FFBs were of desired ripeness when harvested. The traders only reject completely unripe FFB.
The percentage of farmers that implement GAP in their plots was calculated for farmers in the survey and for the monitored plots (Figure 1). Almost all farmers of the survey and monitored group applied GAP in pest and disease control (100%), harvesting frequency (95%), time for transporting (90%) and pruning (90%). Compliance was much lower for irrigation (40%) and fertiliser application (20–40%), most farmers barely keep records (10%). The monitored farmers applied larger amounts of fertiliser than the survey farmers (Table 3). In a next step farmers’ practices were scored per technology level (Table 1). We averaged the scores over all surveyed and all monitored farmers for each of the two monitoring years (Figure 1b). Close to full compliance to GAP is found in transporting, harvesting time, weeding and pruning, but far from compliance is found for irrigation and fertiliser recommendation. Better compliance was found in monitored plots in terms of the amounts of fertiliser used than the surveyed groups. Only on 11 of the monitored plots were all oil palm practices implemented according to GAP with fertilisers and irrigation implemented at the best level. In the best plot, all GAPs were implemented properly.

Figure 1. The overall degree of implementation good agricultural practices (GAP) in oil palm in the study area for the surveyed farmers (n = 108, in a) and the monitored farmers (n = 25, in b) for two years. In (b), the dotted line is the 1st year and the solid line is the 2nd year.
Exploring the relationship between GAP scores and yield by linear regression we found for year 1 and 2 the following equations for the 25 monitored plots: for year 1, Yield = 0.34 (GAP score) + 0.9 (R2 = 0.32); and for year 2: Yield = 0.39 (GAP score) −2.9 (R2 = 0.55). Such equations tell us that higher GAP score is indeed correlated to high yield.
Socio-economic factors explaining GAP scores
We found through multiple linear regression that other crops incomes (X 14), age of oil palm after planting (X 1), oil palm training (X 22) and rice income (X 11) had the strongest relation to the GAP score (Y) per household (p < 0.01, R2 = 0.27) and the regression equation is: Y = 9.154 + 6.252 X 14 + 1.974 X 1 + 8.866 X 22 + 3.835 X 11. Only 27% of variation in GAP score is explained by the regression so other unknown factors must play a role as well. In-depth interviews on plots with high and low GAP scores confirmed the contribution of these factors to GAP adoption.
Farmers can harvest oil palm not earlier than 3–4 years after planting. During the unproductive period, the farmers have to pay the cost of chemical fertiliser, weed control, fuel of transportation to the plot, etc. without any income from the crop. The income from rice and other crops (X 14) serves as capital to support GAP in the oil palm fields at the immature stage and is gradually replaced by income from oil palm itself at the mature stage. From other studies household capital is known as an important variable for adoption of investment in plantations (Laoubi and Yamao, Reference Laoubi and Yamao2009).
Oil palm yield depends on water and fertiliser managements, which affect both quality and quantity of yield (Hartley, Reference Hartley1988). The survey showed that at the mature stage the yield and income from oil palm both determine and depend on investments in GAP. The majority of farmers with mature trees indeed stated that they used income from oil palm to pay for fertiliser in oil palm. With low revenues they applied less. When the price paid for FFB was low, the farmer did not harvest FFB because the income did not cover the harvesting cost. Farmers only fertilize when the price paid for FFB is high and worth the investment. As a consequence, many farmers did not follow the fertiliser recommendations. In Nigeria, farmers did also not adopt fertiliser recommendations when fertilisers were expensive (Ajayi and Solomon, Reference Ajayi and Solomon2010).
Age of oil palm (X 1) was another variable to adopt GAP and at different age the palms need different management. The younger palms need less fertiliser than older ones, but at the same time the younger ones need more weeding, pest and disease control than the older palms (Corley and Tinker, Reference Corley and Tinker2016; DOA, 2003). Greater palms age correlated with higher total GAP adoption scores for two reasons: 1) greater age corresponds to larger potential yield and farmers apply GAP because they know they will get good return on investment; and 2) larger yields mean increased revenues generating money to invest in fertiliser.
Training of oil palm technology (X 22) was important because oil palm was a new crop in the study area and oil palm practices differ from other crops that local farmers were familiar with such as rice, rubber, tomato and chili. Farmers’ attendance to oil palm and agricultural courses was compulsory before establishment of their plantation. During the survey, many farmers claimed nevertheless they did not know about crucial recommendations such as irrigation and fertiliser application. Others stated; however, that they knew GAP for oil palm and understood that irrigation and fertiliser application were needed for oil palm in the Northeast region. Regular support by extension officers appeared to be needed to repeat/refresh knowledge on such a new crop. Similarly, Akpan et al. (Reference Akpan, Nkanta and Essien2012) reported that increasing agricultural extension visits increased the probability of adopting fertiliser technology in Nigeria, whereas Ajayi and Solomon (Reference Ajayi and Solomon2010) stated that the majority of Nigerian farmers were not aware of some important oil palm technologies, which led to their non-adoption. The main constraint was inadequate information from the extension officers.
Rainfall and water availability affecting actual oil palm yield
The monthly amounts of rainfall for the study area for 2006–2015 are shown in Table 2. The distribution ranged between 0 and 700 mm per month and the annual rainfall averaged over 12 months would lead to the conclusion that there would be enough water available for oil palm growth (Table 2). Indicators of water shortage for oil palm production are however monthly amounts of rainfall below 100 mm (Verheye, Reference Verheye and Verheye2010) and less than 10 rainy days per month (Verheye, Reference Verheye and Verheye2010). Looking at these parameters, the conclusion is that monthly rainfall was deficient for six months based in rainfall < 100 mm month−1 (October–March) and for seven months based on less than 10 rainy days per month (October–April), as shown in Table 2. Negative values for the water balance indicated water deficit from October to April (Table 2). In summary, we conclude that GAP recommendation to apply water between October and April is needed.
Oil palm yields – groups of ages, irrigation, soil texture and location
Data were analysed by One-way Analysis of Variance with average yields (year 1 and 2) as dependent variable and age groups, irrigation, soil texture and location of the oil palm plots as explanatory variables aiming to compare means. Palm tree ages varied between 4 and 7 year and oil palm yield significantly differed per age group and between with and without irrigation (p < 0.01). Seven-years old palms had higher yield than those of the other ages (Figure 2a). The plots that received water in the dry season had significantly greater yield than the non-irrigation plots (Figure 2b). Yields did not differ per soil texture type (Figure 2c) or locations of the oil palm plantation (village, sub-district or district, data not shown). However, Corley and Tinker (Reference Corley and Tinker2016) stated that Clay Loam and Sandy Clay soil texture were very highly suitable for oil palm whereas Silt Clay Loam, Loamy Sand and Sandy Loam have high, moderate and low suitability for oil palm, respectively and Sand is an unsuitable soil texture for oil palm plantation. These classifications are also used in our study but were not found to lead to or explain any yield differences. Apparently, there are factors that compensate for unfavourable soil texture.

Figure 2. Yields in ages-oil palm (a), irrigation (b) soil texture (c); amount of fertilisers in non-irrigation and irrigation (d), relation of yield and amount of fertiliser in irrigation (e) and non-irrigation (f). A amount of (b) is not presented due to low application rats (0–0.1 kg/tree/year). Box plots, rectangle, from 25th to 75th percentile, median (cross bar), maximum and minimum values (lines above and below the box), *, ** are significant at p < 0.05, p < 0.01.
In the monitored fields farmers applied the furrow and hose system to irrigate oil palm trees every 15 and 30 days. These farmers could not provide exact values of the amount of water they applied. In case, an oil palm plantation was nearby irrigation canals, water was released to the plantation by a water pump until the water flooded the whole area. The farmer irrigated again when the plantation was dry, which would take one or two weeks. Irrigation and non-irrigation took place in the same plots over the two years. Irrigation in the dry season led to significantly greater yield (Figure 2b) with a maximum of about 29–31 Mg ha−1. We found that the farmers applied water only for plots which are located close to an irrigation area. In addition, the farmers that irrigated their plots had also other household income from rubber, cows, vegetable crops and small businesses. Somnuek et al. (Reference Somnuek, Slingerland and Grünbühel2016) and Sethaputra (Reference Sethaputra2014) reported in the study of oil palm in Nong Khai province that farmers with a positive investment attitude to oil palm had more capital available than non-investing farmers and knew about irrigation being the main limitation to oil palm growth in the Northeast. In general, water stress reduces photosynthesis which will lead to low photo assimilate supply, less female flowers and hence lower bunch number leading to poor yields (Corley and Tinker, Reference Corley and Tinker2016). Moreover, Carr (Reference Carr2011) stated that irrigation increases the percentage female flowers and reduced abortion, leading to an increase the number of oil palm fruit bunches.
Unexpected droughts can affect the production of entire countries. Siriwardhana et al. (Reference Siriwardhana, Opathella and Jha2009) reported that due to a drought period in the South of Thailand (2004–2005) oil palm yield was seasonally reduced, leading to national oil palm production to be significantly depressed from 17 to 15 Mg ha−1year−1. Research by an oil palm company in South Thailand reported that yield increased from 17 to 27 Mg ha−1 when palms received double fertilization and were irrigated with 450 Litre palm−1day−1 during the annual dry period of four months (Tittinutchanon et al., Reference Tittinutchanon, Nakharin, Clendon and Corley2008). In the Northeast of Thailand, our research area, the period with water stress is 5–8 months and therefore irrigation demand and yield response to irrigation is much higher.
Fertiliser was applied twice per year. The first application was at the beginning of the rainy season (May or June) and the second application before the end of the rainy period (September or October). Types of fertiliser that farmers applied were either chemical fertiliser or chemical fertiliser and manure. As GAP to apply N, P, K and Mg are 1.06, 0.04, 1.99, 0.18 and 0.08 kg tree−1 year−1 respectively, the amounts of all fertiliser applied were less than the recommendations for GAP (Table 3). ANOVA showed that the amount of fertiliser applied did not significantly differ per age group or per soil texture class (data no shown). Amounts of N and K (p < 0.01) and Mg (p < 0.05) applied to oil palm trees were significantly higher for irrigated (0.9, 0.8 and 0.09 kg tree−1 year−1) compared to non-irrigated (0.3, 0.3 and 0.03 kg tree−1 year−1) plots (Figure 2d). This suggests that farmers know that sufficient water is needed to allow the trees to benefit from nutrient application. It also indicates that farmers who have easily access to water resources (nearby irrigation canals and rivers) also apply fertilisers.
Correlations were investigated between oil palm yield (Mg ha−1 year−1) and actual oil palm management variables: groups of ages of oil palm, irrigation, soil texture, location of oil palm plots, amount of, N, P, K, Mg and B (kg tree−1 year−1). To examine the apparent strength of the relation between actual oil palm management variables (age of oil palm (X 1), irrigation (X 2), soil texture (X 3), amount of N (X 4), P (X 5), K (X 6), Mg (X 7) and B (X 8)) and oil palm yield (Y), a stepwise multiple regression analysis was used. The amount of N (X4) is the variable that explains the largest part of the variation (R2 = 0.43, p < 0.001) in yield and the regression equation is Y = 8.767+8.766 X 4. The contribution of the other variables was not significant.
Oil palm GAP recommended five main nutrients (N, P, Mg, K and B) but from this study we found the farmer applied mainly three fertilisers (N, P and K). Nitrogen is more often applied by the farmers because it is readily available and cheaper than P and K. While Mg and B, are minor nutrients which farmers barely apply and only use in small amounts per year (Table 3). According to the farmers these nutrients are not available in the area and/or are expensive and not really necessary (survey result). Fertilisers play an important role after the pollination to improve quality and quantity of bunches (Corley and Tinker, Reference Corley and Tinker2016). Not surprisingly, in our plots the greatest yields were achieved where irrigation and fertiliser were both applied (Figure 2e and f) but we could not statistically disentangle the effects. Looking at the single factors we found that under irrigation both the highest fertiliser application (Figure 2d) and the highest yields (Figure 2b) were found. So far, no severe symptoms of nutrient deficiency were observed in the monitored plots.
In our study, the oil palm plots were located in areas with soil textures described elsewhere as suitable or unsuitable, but we found that the oil palm yield did not differ between different soil textures. More importantly, if both irrigation and fertiliser were applied in soils with less suitable soil texture (Sandy Loam) (Figure 3a–e) the yield was comparable to or even higher than yields in the plots with a highly suitable soil texture (Silt Clay Loam or Clay Loam) probably because on the latter much less fertiliser was applied (Figure 3f–i). We can conclude that proper oil palm management may improve the yield even if oil palms are planted in unfavourable soil and rainfall conditions when irrigation and fertilisers are used.

Figure 3. Yields, amount of N, P, K and Mg in plots with (a–e) and without (f–i) irrigation and different soil textures. Graph of amount of (b) is not presented because of low amounts applied. Box plots, rectangle, from 25th to 75th percentile, median (cross bar), maximum and minimum values (lines above and below the box).
Fairhurst and McLaughlin (Reference Fairhurst and McLaughlin2009) investigated oil palm planting in degraded land and found that proper agronomic management including adequate mineral fertiliser and crop residue applications can overcome the constraints of unsuitable soil texture. They added; however, that although yields may be high, the financial returns of oil palm production in unsuitable soils are less than in suitable soils due to higher costs. In our monitored plots we found a supply of €144 worth of fertiliser in unsuitable soils which was much higher than €94 cost of fertiliser application in the most suitable soil. In unsuitable soils the investment in fertilisers led to lower financial returns (Table S2) compared to the lower investments in the most suitable soils.
CONCLUSION
Oil palm producers in the Northeast of Thailand generally complied with GAP except for fertiliser application and irrigation. In 25 selected plots, we found that better yields significantly depended on irrigation and fertiliser application which were strongly interrelated. Oil palm yield was found to have a strong correlation with N applications, which can be seen as a proxy for application of a fertiliser package of at least N, P and K fertiliser. Irrigation and fertiliser management partly overrode differences in soil texture, leading to the finding that oil palm yield in different soil textures were not significantly different. Income from rice and other crops, older oil palm trees and more knowledge of oil palm technology increased farmers GAP implementation scores. Household capital is essential for oil palm establishment whereas in the mature stage investments are gradually paid for by oil palm itself leading to upward and downward reinforcing mechanisms. Large revenues lead to greater investments and enhanced yields and revenues, but low FFB prices lead to lack of investment and depressed yields and less income in the future. Oil palm production in the Northeast of Thailand can be high despite unfavourable biophysical conditions (unsuitable soil and rainfall distribution) when GAPs are respected, especially a combination of irrigation and fertilisers. However, the costs of fertilisers and irrigation systems compared to the price of FFB affects the profitability of FFB production, which may affect farmers’ motivation to apply GAP. When the government aims for sustainable palm oil production in the Northeast for bioenergy and for an increase in farmers’ household income, it needs to invest in frequent technical support, irrigation infrastructure and affordable fertilisers. Otherwise, farmers may not apply GAP because of low returns on investments and yields will remain very modest.
Acknowledgements
This research has been supported by the Interdisciplinary Research and Education Fund (INREF) from Wageningen University and Research, the Netherlands and has been conducted as part of the SUSPENSE (towards environmentally sustainable and equitable oil palm) program. The authors wish to extend their respect and thanks to all the farmers for their co-operation during the data collection, Nong Khai Research and Development Centre under the DOA and their officers for support during the data collection. We wish to thank Professor Ken Giller for his valuable comments on this manuscript.
SUPPLEMENTARY MATERIAL
To view supplementary material for this article, please visit https://doi.org/10.1017/S0014479717000497


