INTRODUCTION
Understanding North Pacific environmental changes provides clues to prehistoric human adaptations and resilience. Peat deposits, accumulated in layers through millennia, represent a unique natural archive that preserves plant remains, mineral and organic substances, and other proxy evidence of past environments. Methods used here, including pollen analysis (Faegri and Iversen, Reference Faegri and Iversen1975; Moore et al., Reference Moore, Webb and Collinson1991), stable isotope analysis (SIA) (Croll et al., Reference Croll, Maron, Estes, Danner and Byrd2005; Maron et al., Reference Maron, Estes, Croll, Danner, Elmendorf and Buckelew2006), and Fourier transform infrared spectroscopy (FT-IR) (Holmgren and Nordén, Reference Holmgren and Nordén1988; Broder et al., Reference Broder, Blodau, Biester and Knorr2012; Krumins et al., Reference Krumins, Klavins and Seglins2012; Biester et al., Reference Biester, Knorr, Schellekens, Basler and Hermanns2014), have greatly improved paleoecological investigations of peat deposits.
Several peat deposits have been studied in the eastern Aleutians (Heusser, Reference Heusser1973) and adjacent Alaska Peninsula (Heusser, Reference Heusser1983; Jordan and Krumhardt, Reference Jordan and Krumhardt2003). These case studies reconstructed vegetation history, showing that climatic variations during the Holocene affected vegetation and caused significant changes within it. Also, volcanic activity and ash deposition had profound effects on vegetation, sometimes changing its natural successions (Heusser, Reference Heusser1990).
Seabird activities also altered wetland ecosystems, especially on smaller islands (Savinetsky et al., Reference Savinetsky, Khasanov, West, Kiseleva and Krylovich2014). Colonies of birds, including storm petrels (Hydrobates sp.), puffins (Fratercula sp.), and auklets (Aethia sp.), nesting directly on wetland areas, have deposited guano fertilizer that changed vegetation. Changes in guano amounts can be traced in peat deposits by pollen records as well as by stable nitrogen isotopic signature. Aleutian ecosystems are unique; besides prehistoric humans, no terrestrial mammals inhabited the archipelago west of Umnak Island and east of the Commander Islands at the time of Russian contact in 1741 (Crockford, Reference Crockford2012). In the absence of terrestrial predators, migratory birds used these treeless islands as nesting grounds for millennia; their impact on wetlands located close to seashores is substantial. Therefore, the presence of seabird colonies and changes in their abundance attributable to the influx of human migrants leaves a distinct signature in the stable nitrogen signature of peat (Savinetsky et al., Reference Savinetsky, Khasanov, West, Kiseleva and Krylovich2014).
Human activity is an important factor affecting ecosystems, especially such specific ones as on the islands of the Aleutian chain. Prehistoric humans were the first terrestrial predator during postglacial colonization, which affected both animals (notably bird colonies) and vegetation. For example, the Elymus-Apiaceae vegetation communities develop on territories formerly occupied by human. These communities are very different from surrounding communities and are usually referred to as “disturbance grass” (Fogarty, Reference Fogarty1991). Humans first appear in the eastern Fox Islands around 9000 yr ago (Davis and Knecht, Reference Davis and Knecht2010) and in the central Andreanof Islands by 6000–7000 yr ago (Savinetsky et al., Reference Savinetsky, West, Antipushina, Khasanov, Kiseleva, Krylovich and Pereladov2012; West et al., Reference West, Hatfield, Wilmerding, Lefevre and Gualtieri2012). The Islands of Four Mountains (IFM), located between these two larger island groups, could be a significant intermediate waypoint in the postglacial settlement of the Aleutian chain. However, recent archaeological research (Hatfield et al., Reference Hatfield, Nicolaysen, West, Krylovich, Bruner, Savinetsky and MacInnes2019) did not reveal the expected antiquity of the investigated settlements on the IFM. The earliest direct archaeological evidence for settlement here is ca. 4000 yr BP, based on three sites in the IFM (Hatfield et al., Reference Hatfield, Nicolaysen, West, Krylovich, Bruner, Savinetsky and MacInnes2019).
This study presents the results of multiproxy analysis of a peat column (CR-03) sampled on Carlisle Island (the IFM, eastern Aleutians). The CR-03 peat column was studied using pollen, carbon and nitrogen stable isotopes, C/N ratio, FT-IR analyses, and radiocarbon dating. Pollen data reflect changes in the local and regional vegetation (Heusser, Reference Heusser1973; Kaufman et al., Reference Kaufman, Axford, Henderson, McKay, Oswald, Saenger and Anderson2016); both stable carbon and FT-IR show the levels of organic substances in the peat matrix affected by changes in precipitation regimes as well as local conditions (e.g., vegetation, volcanic activity, etc.; Holmgren and Nordén, Reference Holmgren and Nordén1988; Broder et al., Reference Broder, Blodau, Biester and Knorr2012; Biester et al., Reference Biester, Knorr, Schellekens, Basler and Hermanns2014). Stable nitrogen isotopes can reveal episodes of the appearance of seabird colonies (Savinetsky et al., Reference Savinetsky, Khasanov, West, Kiseleva and Krylovich2014). Okuno et al. (Reference Okuno, Izbekov, Nicolaysen, Nakamura, Savinetsky, Vasyukov and Krylovich2017) developed an age-depth model of the CR-03 peat accumulation combining radiocarbon dating and Carlisle Island tephra chronology.
MATERIALS AND METHODS
Site description
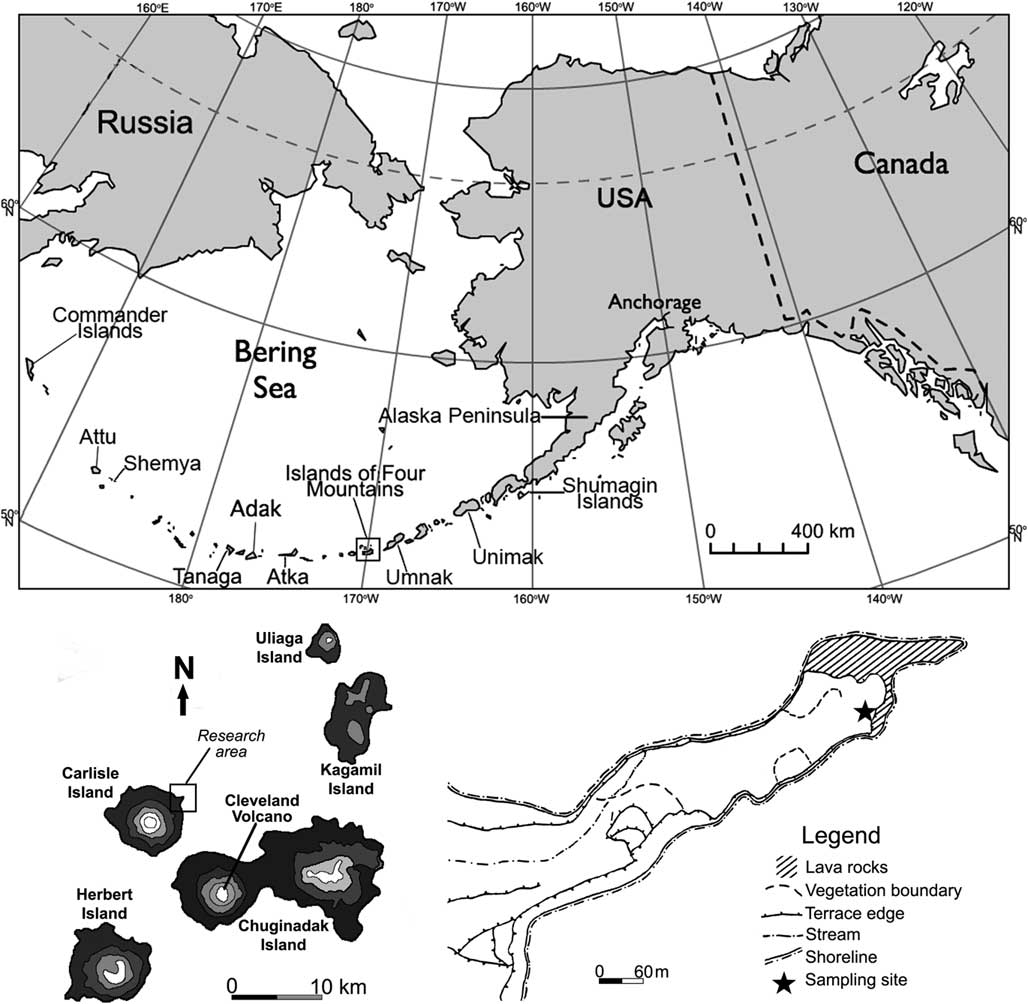
During July 2015, we collected the CR-03 core from peatland on an 800-m-long peninsula formed by a lava flow on northeastern Carlisle Island (Fig. 1). The peninsula is edged with denuded rocks and spires and creates a quiet, sheltered cove at the head of Carlisle pass. A complex archaeological site (CR-03 Village Complex; Hatfield et al., Reference Hatfield, Bruner, West, Savinetsky, Krylovich, Khasanov and Vasyukov2016) is located near that peninsula. The sampling site is located on the southeastern tip of the cape in the vicinity of the shoreline (Fig. 1). Modern vegetation at the sampling site is meadows in which dense tussocks of grasses (Poaceae) and sedges (Carex spp.) form the chief cover with the notable presence of Ranunculaceae (Talbot and Talbot, Reference Talbot and Talbot1994). The vegetation perseveres under a climate characterized by strong winds, protracted intervals of cloudiness, a mean annual temperature near 4°C, and a mean annual precipitation of about 1046 mm (Umnak Island) (Byers, Reference Byers1959). The vegetation is treeless, with pacific coastal plants predominant (Hulten, Reference Hulten1968). In village areas, the vegetation consists of the Elymus-Apiaceae community. This community is markedly distinguishable from that of the surrounding area (see Fig. 1; the dashed line marks its boundaries on the peninsula) and is commonly referred to as “disturbance grass.” The dominant species of this group are wild rye grasses (Elymus spp.) in association with various species of the Apiaceae family such as cow parsnip (Heracleum spp.), Angelica spp., hemlock parsley (Conioselinum spp.), and beach lovage (Ligusticum spp.) (Fogarty, Reference Fogarty1991).

Figure 1 Map of Aleutian Islands and location of site investigated in the Islands of Four Mountains (map of location redrawn from Fogarty [Reference Fogarty1991]).
Field methods
We sampled the peat deposit using a Russian-type corer device (5.0 cm diameter; Eijkelkamp Soil and Water, Giesbeek, the Netherlands). We took two overlapping columns in 50 cm increments for a total of 340 cm. We sampled the peat deposit until contact with a dense debris layer above bedrock. We described the deposit profile using the smoothed profile wall adjacent to the sampling site (Table 1). In the laboratory, we sampled the cored sediment in 1 cm increments for various analyses.
Table 1 Description of the sediment profile of CR-03 peat deposit.

Radiocarbon dating
We handpicked and cleaned five samples of vascular plant remains and one charcoal sample for dating by routine acid-alkali-acid treatments. Six dates from the CR-03 peat deposit are presented in Table 2. Radiocarbon dating was conducted using the accelerator mass spectrometry (AMS) technique on NEC Peletron 9SDH-2 AMS system at the Institute of Accelerator Analysis Ltd. (Japan). We used the 12C/13C ratios obtained by AMS to correct carbon isotopic fractionation when calculating conventional 14C age. Conventional 14C ages were calibrated to “calendar” years in the Bchron 4.2.6 package (Parnell, Reference Parnell2016) in R v. 3.4.1 using the IntCal13 calibration curve (Reimer et al., Reference Reimer, Bard, Bayliss, Beck, Blackwell, Ramsey and Buck2013).
Table 2 Conventional radiocarbon dates and δ13C of the samples from CR-03 peat deposit.

We created an age-depth model using the Bchron package. Correct timing of various changes in peat deposit can be evaluated on the basis of adequate age-depth models. In the last decade, significant progress has been made in age-depth model construction using computer programs employing Bayesian and Markov Monte Carlo chain approaches (Blaauw and Christen, Reference Blaauw and Christen2005; Bronk Ramsey, Reference Bronk Ramsey2008; Haslett and Parnell, Reference Haslett and Parnell2008). From these, we selected the Bchron 4.2.6 package; in contrast to the other available programs, it operates with only one assumption: that the upper strata are younger than lower (Parnell et al., Reference Parnell, Haslett, Allen, Buck and Huntley2008). The Bchron output consists of both the graphic form, where a range of the age-depth model is presented as a filled area along with radiocarbon dates, and the assessments of probabilities of true dates for certain events. The latter can be reasonably compared with dates obtained from other sources. Details of mathematical operations and algorithms related to this program can be found in Haslett and Parnell (Reference Haslett and Parnell2008).
Pollen analysis
In total, we used 53 samples (1 cm3 each) for pollen analysis at 4–5 cm intervals (excluding ash layers). Pollen sample preparation included treatment with 10% HCl, 10% KOH, and 40% HF; acetolysis; sieving; and mounting in glycerin according to the common technique (Faegri and Iversen, Reference Faegri and Iversen1975) with some additions proposed by Chambers et al. (Reference Chambers, van Geel and van der Linden2011). Identification of pollen and spore types was based on published atlases and keys (Faegri and Iversen, Reference Faegri and Iversen1975; Moore and Webb, Reference Moore and Webb1978; Moore et al., Reference Moore, Webb and Collinson1991; Demske et al., Reference Demske, Tarasov and Nakagawa2013), images from several pollen database websites (https://www.polleninfo.org/aerobiologie/pollenatlas.html [accessed 5 September 2018]; https://www.paldat.org [accessed 5 September 2018], https://globalpollenproject.org [accessed 5 September 2018]), and reference pollen and spore collection provided by Prof. Konrad Gajewski (University of Ottawa, Canada). Most of the pollen taxa were not identified beyond family level. Although pollen keys and atlases of Ericales genera (Warner and Chinnappa, Reference Warner and Chinnappa1986; Sarwar and Takahashi, Reference Sarwar and Takahashi2014) are available, we did not determine these to genera, because pollen preservation was uneven in some layers affected by ash. We counted pollen and spores under the light microscope using 400× magnification, until pollen and spore amounts of at least 500 units were reached. However, sometimes we counted up to 300 spores of “exotic” Lycopodium clavatum marker because some layers preserved low pollen and spore concentration. We calculated percentages from a sum of all identified pollen grains and spores. We calculated pollen concentrations using known numbers of “exotic” Lycopodium clavatum marker spores in the tablets (batch no. 1031), which had been added to the samples before processing (Stockmarr, Reference Stockmarr1973). We plotted diagrams using Tilia software v. 2.0.41 (Grimm, Reference Grimm2015). Palynozones were distinguished using stratigraphically constrained cluster analysis (CONISS) (Grimm, Reference Grimm2015).
SIA
We analyzed the carbon (C) and nitrogen (N) stable isotopic composition of 70 samples from the CR-03 peat core. The bulk samples (mixture of intact or semidecomposed plant remains and mineral components) were dried at 105°C. No chemical treatment was used to prevent nitrogen loss in either plant remains or peat matrix; in the latter, various organic substances could have been removed during acid or alkali processing. This approach has proved to be adequate for evaluating the stable nitrogen isotopic compositions of peat samples (Bergstrom et al., Reference Bergstrom, Stewart, Selkirk and Schmidt2002). There is no significant abundance of biogenic carbonates like mollusk shells or ostracods in the samples; thus any additional chemical treatment was not used. Samples for SIA were chosen at 10–15 cm intervals from the middle of the core and at 2–3 cm intervals from the lower core section. Between 0 and 57 cm in depth, peat development occurs after the CR-02 tephra fall, and, therefore, we chose samples every 1 cm in this deposition. Shorter intervals were chosen for samples from those layers where the largest changes in the stable isotope signature were observed. Subsamples weighing 1 g were milled. The milled samples were weighed for analysis (1.5–3 mg depending on visible estimate of ash content) and wrapped in tin capsules. The nitrogen and carbon isotopic compositions were measured with Thermo-Finnigan Delta V Plus continuous-flow isotope ratio mass spectrometer coupled with elemental analyzer (Thermo Flash 1112) in the Joint Usage Center of the Institute of Ecology and Evolution, Russian Academy of Sciences (Moscow, Russia). The isotopic composition of N and C is shown as the δ notation relative to the international standards—atmospheric nitrogen and Vienna Pee Dee belemnite, respectively. δX(‰)=[(Rsample/Rstandard) − 1] × 1000, where R is the ratio of the heavier isotope compared with the lighter isotope. Samples were analyzed with reference gas calibrated against International Atomic Energy Agency (IAEA) reference materials USGS 40 and USGS 41 (glutamic acid) and IAEA-CH3 (cellulose). We corrected the drift using an internal laboratory standard (alfalfa). The standard deviation of δ13C and δ15N values in USGS 40 (n=4–8) was <0.2‰. We calculated the isotopic compositions, the total contents of carbon and nitrogen (% N, % C), and the C/N atomic and mass ratios in all the samples (Table 3).
Table 3 Results of stable isotope analysis and C/N ratio in bulk samples of CR-03 peat deposit.

Note: Asterisk (*) indicates small peak, identification is unreliable.
FT-IR analysis
We carried out FT-IR analysis using 31 samples (see Supplementary Table 1). The bulk samples were chosen at 5–15 cm intervals. Macroscopic plant remains were removed during sampling. The samples were powdered and dried in a drying chamber at 105°C. KBr-pellet samples were prepared using the following technique (Thermo Electron Corporation, 2006) with some additions proposed by Broder et al. (Reference Broder, Blodau, Biester and Knorr2012), Krumins et al. (Reference Krumins, Klavins and Seglins2012), and Teong et al. (Reference Teong, Felix, Mohd and Sulaeman2016). KBr powder with purity appropriate for FT-IR-analyses was placed in a glass sample cup and stored in a drying chamber at 105°C during the process. The series consisted of five samples and one background KBr pellet; these were confined within six collars (diameter=12 mm) made of stainless steel and used as pellet holders. The lower die of the molding tool with a collar on it was placed on the scales prior to weighing the samples. For the pellet to determine the ambient background signal, 200 ± 0.1 mg of KBr was weighed, and the mixture of 200 ± 0.1 mg of KBr and 2 ± 0.1 mg of the sample was weighed for the sample pellets. Sample powders were mixed with KBr within the steel collar and were placed on the lower die. After the molding tool was mounted, the sample chamber was pumped out at ~300 Pa for 10 minutes. Next, a pressure of ~170 bar was applied to press the pellet for 5 minutes. The samples strutted in collars were removed and placed in individual glass sample cups and stored in a drying chamber at 105°C without lids, left open for at least 6 hours prior to measurement. After removing the glass cups from the drying chamber, the lids were closed and the samples were chilled to ambient temperature. A Thermo Scientific Nicolet 380 FT-IR spectrometer with a default transmittance accessory determined the absorbance spectra of the samples in the 4000–400/cm wavenumber range. We used 4/cm resolution and 32-scan mode with no autocorrections on water vapor or atmospheric carbon dioxide. After measuring, we placed the series again in the drying chamber, and each procedure was repeated twice more. The three spectra for each sample were subsequently averaged using the addition in OMNIC 7.3 software (Thermo Electron Corporation). Each of the averaged spectra was then baseline corrected (with the linear approximation algorithm) using the same set of baseline points and then smoothed. ChemoSpec package v. 4.4.17 (Hanson, Reference Hanson2017) was used to display the chosen spectra.
We calculated the relative contribution of several IR absorption intensities to compare their dynamics within the peat core. We chose six wavenumbers: 1053/cm (polysaccharides + ash), 1420/cm (phenolic and aliphatic structures), 1510/cm (aromatics), 1630/cm (lignin and other aromatic or aliphatic carboxylates), 2850/cm (aromatics and unsaturated aliphatics), and 2920/cm (aromatics and unsaturated aliphatics). We measured IR-absorption intensities at each of the listed wavenumbers. These were multiplied by 1000 and divided by the total absorption area of each spectrum. As an example of organic matter dynamics, one of these variables (1630/cm) is plotted against the other proxies (Fig. 5).
By using the FT-IR spectrometry proxy, we calculated a humification index (HI). The HI reveals the relation of decomposed products of organic matter to comparatively stable organic structures. The HI was calculated as the relation of absorption intensities at 1630/cm in relation to 1053/cm (Table 4) (Holmgren and Nordén, Reference Holmgren and Nordén1988; Biester et al., Reference Biester, Knorr, Schellekens, Basler and Hermanns2014).
Table 4 Spearman rank correlation matrix of CR-03 peat core measurements (R 2 values >|0.7| are bolded; statistical processing was carried out in R v. 3.4.1 (R Core Team, 2017).

RESULTS
Chronology
The CR-03 peat deposit began forming approximately 7300 cal yr BP (Fig. 2, Table 2). The deposit accumulated nearly linearly with a slight decrease in accumulation rate during 2000–1000 cal yr BP.
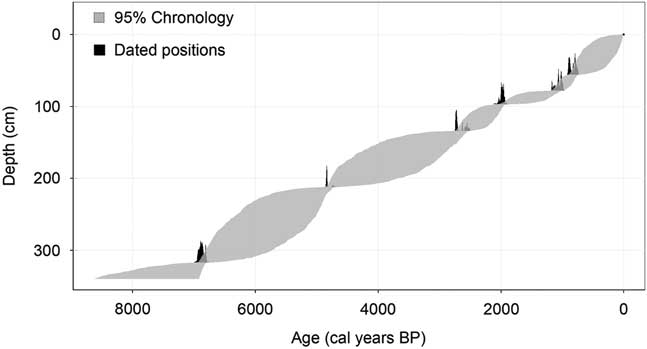
Figure 2 Age-depth model for the CR-03 peat deposit generated by Bchron 4.2.6 package (mean, 95% chronology confidence interval).
Pollen analysis
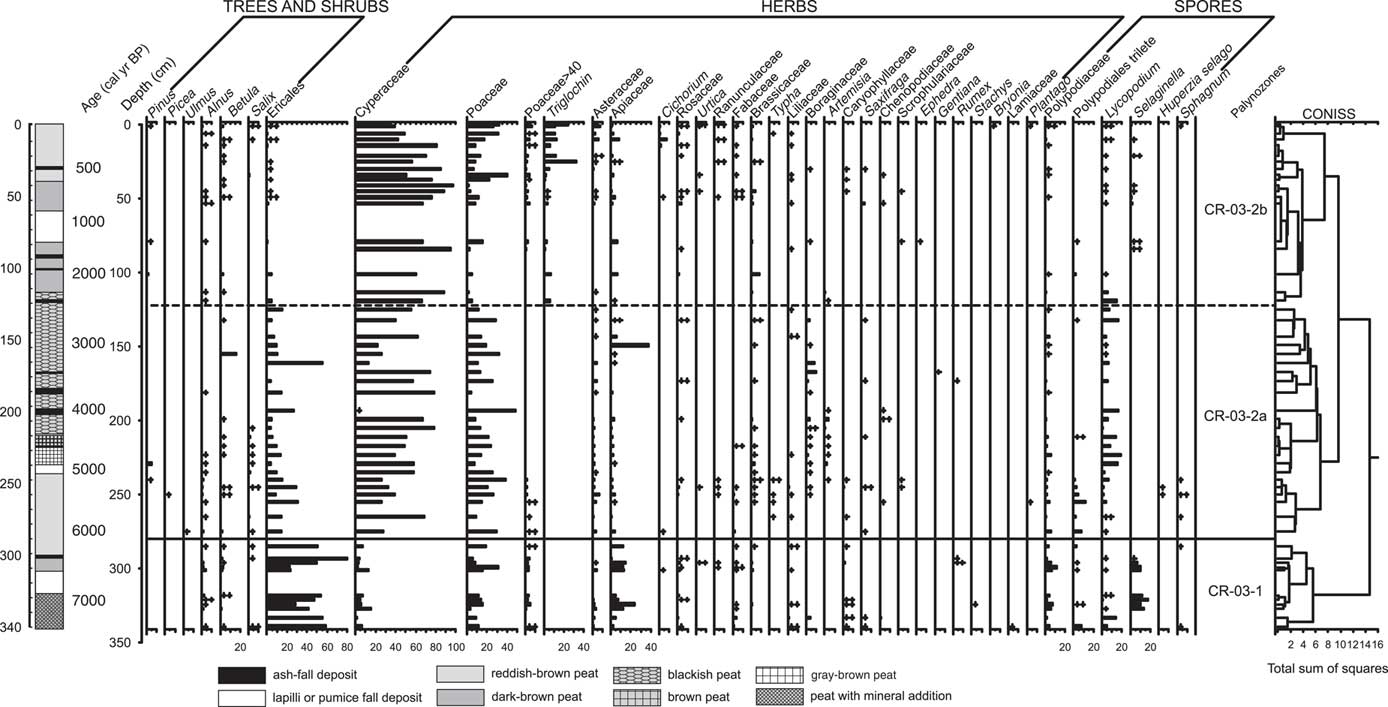
We identified a total of 40 pollen and spore types in samples from the CR-03 deposit: 7 arboreal palynotypes (trees and shrubs), 27 nonarboreal palynotypes (herbs), and 6 spore types. Ericales, Cyperaceae, and Poaceae were predominant palynotypes in the pollen spectra with the percentages varying within 0–79.5%, 2.5–94.9%, and 1.6–48.6%, respectively (Fig. 3). Total pollen concentration (TPC) varied from 2590 to 102,650 grains/cm3. A pollen concentration diagram is presented in abbreviated form and includes the most important palynotypes (Fig. 4). Based on CONISS, we define two palynozones in the CR-03 peat core. The upper palynozone was subdivided into two subzones, and these palynozones reflect a significant change in local growing conditions at ca. 6100 cal yr BP.

Figure 3 Pollen percentage diagram of CR-03 peat core, stratigraphy of peat deposit, and results of zonation with stratigraphically constrained cluster analysis (CONISS).

Figure 4 Pollen concentration diagram of CR-03 peat core, stratigraphy of peat deposit, and results of zonation with stratigraphically constrained cluster analysis (CONISS) (grains or spores per cm3).
Palynozone CR-03-1 (340–280 cm, 7300–6100 cal yr BP)
The pollen record of the CR-03 profile began about 7300 cal yr BP with a diverse fern-shrub assemblage. In this palynozone, herbaceous taxa account for 36.6%, trees and shrubs are 48.6%, and cryptogam palynotypes are 15.1% on average. The pollen composition of the first palynozone is characterized by an especially high amount of Ericales (heath) pollen. The maximal percentage of this palynotype accounts for up to 79.5% (mean 46.4%; Fig. 3) with pollen concentrations from 3340 to 24,080 grains/cm3 (Fig. 4). In this older palynozone, cryptogam palynotypes are more abundant (up to 20.1%; Fig. 3) than in the overlying zone. The high abundance of Apiaceae (parsley family) is also remarkable, up to 23.9% (10,630 grains/cm3; Fig. 4). The subdominant palynotypes in the pollen spectra, Cyperaceae (sedge family) and Poaceae (grass family), exhibit relatively low percentages in this zone (6.4% and 13.0%, respectively). There is a rather high diversity of other herbaceous palynotypes (Asteraceae, Caryophyllaceae, Liliaceae, and Rosaceae). A relatively high content of woody taxa including Alnus and Betula, probably from forested areas, is recorded in this zone (up to 4%; Fig. 3). TPC varies from 14,340 to 45,090 grains/cm3.
Palynozone CR-03-2 (280–0 cm, 6100–0 cal yr BP)
This zone is marked by a significant decrease of Ericales pollen before it completely disappears (Fig. 3). It is one of the main characteristics of the pollen record that was used to define the boundary between the two palynozones. In contrast to the disappearance of plants belonging to the heath order, sedges and grasses exhibit a remarkable rise (Fig. 3). Herbaceous taxa account for 84.8%, trees and shrubs are 9.1%, and cryptogam palynotypes are 6.1% on average. This ratio in pollen groups indicates pronounced vegetation changes: herbaceous communities, predominantly grasses and sedges, replace suffruticose communities (characterized by ferns and ericaceous shrubs). Layers in this zone possess the widest TPC ranges, ranging from 2590 to 102,650 grains/cm3. This zone is quite diverse and variable, and two subzones are defined in the profile.
Subzone CR-03-2a (280–122 cm, 6100–2450 cal yr BP)
By 6100 cal yr BP, Cyperaceae and Poaceae pollen becomes abundant (45.7% and 19.7% respectively), whereas Ericales pollen shows significant decrease (13.5%); however, Cyperaceae and Poaceae concentration is also low (10,430 and 3210 grains/cm3 respectively; Figs. 3 and 4). Both the percentage and concentration of Apiaceae pollen decrease, and nearly all the cryptogam palynotypes, except Lycopodium spores, match the Apiaceae trend (Figs. 3 and 4). The appearance of Typha and Sphagnum at the bottom of the subzone should be noted. Their appearance could indicate some continuous local waterlogged conditions; however, they quickly disappear from the pollen spectra. Some changes occur in the composition of herbaceous taxa. Caryophyllaceae, Rosaceae, and Liliaceae somewhat diminish while Asteraceae, Boraginaceae, and Artemisia occur. Single pollen grains of arboreal taxa occur in this subzone.
Subzone CR-03-2b (122–0 cm, 2450–0 cal yr BP)
After 2450 cal yr BP, Ericaceae pollen and cryptogam spores completely disappear from the spectra (Figs. 3 and 4). Frequency and concentration of both Cyperaceae and Poaceae pollen increase in this subzone and reach their maximum about 500 cal yr BP (Figs. 3 and 4). Triglochin pollen occurs in this subzone above the CR-02 tephra complex and significantly increases at approximately 400 cal yr BP (Fig. 4).
SIA
Nitrogen stable isotopic composition of the peat samples varies between 2.7‰ and 13.6‰ (mean 6.7‰) (Table 3, Fig. 5). δ15N reaches its maximum values, some greater than 10‰, in the layers located at the 340–327, 84–85, and 53–35 cm depth ranges. According to the age-depth model, these layers formed about 7300–7000, 1400, and 750–500 cal yr BP, respectively. From 6900 to 2000 cal yr BP (320–100 cm), δ15N remains comparatively constant (with the mean 4.4‰) and gradually decreases after 500 cal yr BP (Fig. 5).
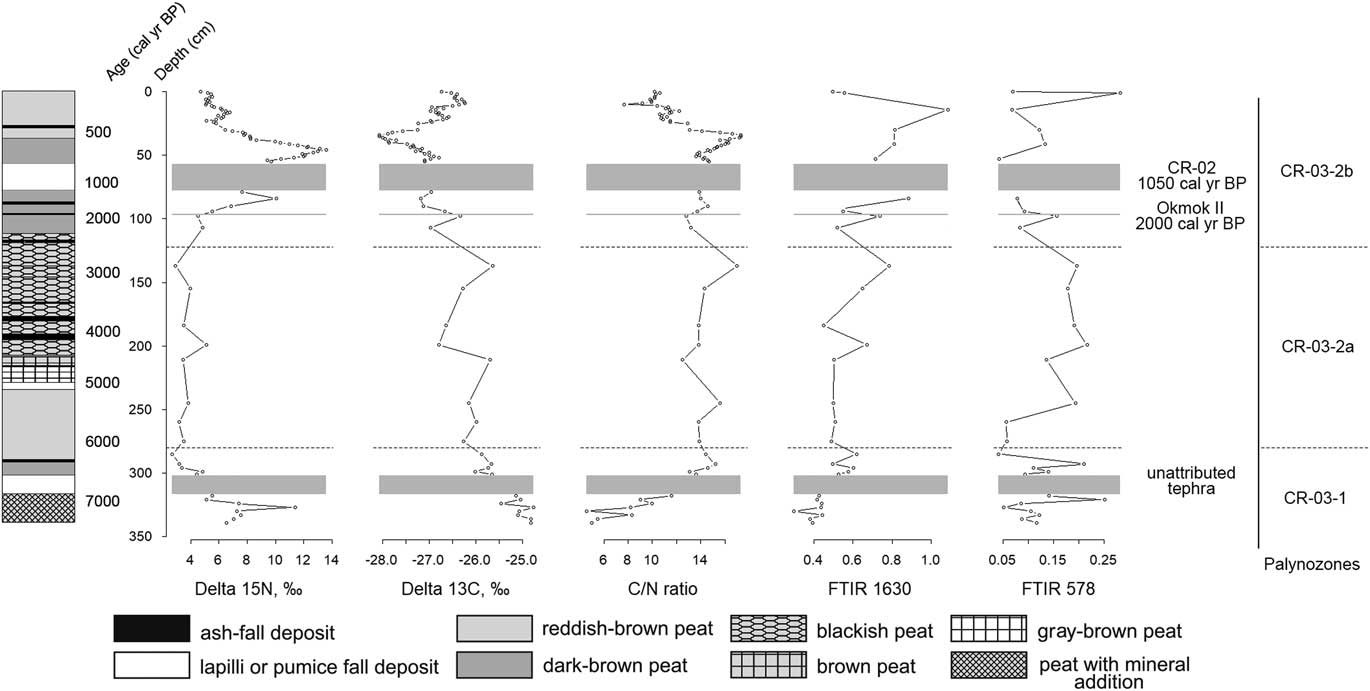
Figure 5 Stable nitrogen and carbon isotopes profiles, C/N ratio profile, and Fourier transform infrared spectroscopy (FT-IR) 1630 profile (wavenumber of aromatic groups; see text for details) of CR-03 peat deposit. Dashed lines mark the boundaries of the palynozones; gray blocks mark the thickest tephra layers.
Carbon stable isotopic composition of the CR-03 peat core samples varies between −28.1‰ and −24.8‰ (mean −26.6‰), which is typical for C3 plants (Hong et al., Reference Hong, Wang, Jiang, Lin, Hong, Zhu, Wang, Xu, Leng and Li2001) (Table 3, Fig. 5). 13C content gradually decreases up the peat profile (Fig. 5). Several marked peaks, representing relative increase of δ13C values, interrupt this decline trend. The peaks occur at approximately 4800, 2800, and 2000 cal yr BP (211, 138, and 98 cm, respectively). A pronounced δ13C decrease occurs in the samples above the CR-02 tephra complex and reaches the minimal value (−28.1‰) at approximately 500 cal yr BP (34–36 cm) (Fig. 5). δ13C increases after 500 cal yr BP.
The C/N ratio (C/N mass) of the CR-03 peat core varies from 4.6 to 17.2 (Table 3, Fig. 5). Three zones of different C/N ratio dynamics can be distinguished. The first zone extends from the bottom of the core to 301 cm (7300–6500 cal yr BP) and is characterized by general increase of the C/N ratio from 5.9 to 15.8. We see a sharp and rapid C/N ratio increase, from 5.0 to 8.3, at 333 cm depth (7200 cal yr BP) and a decrease to 4.6 at 300 cm depth (6500 cal yr BP). Thereafter, the C/N ratio begins to gradually grow.
The next zone (301–79 cm; 6500–1100 cal yr BP), containing single, thin ash layers, is relatively stable with a C/N ratio varying from 12.5 to 17.0. Three clear C/N ratio increases, with diminishing amplitudes, occur at 137 cm (2800 cal yr BP), 245 cm (5500 cal yr BP), and 293 cm (6400 cal yr BP) to 17.0, 15.6, and 15.2, respectively. Moderate declines occur at 99 cm (2030 cal yr BP), 211 cm (4800 cal yr BP), and 299 cm (6500 cal yr BP) to 2.8, 12.5, and 13.1, respectively (Fig. 5).
The third zone (57–0 cm; 850 cal yr BP to present), located above the thick CR-02 tephra, is highly dynamic compared with all other peat deposit zones; the large sample number for this part of the core could influence this activity. The C/N ratio generally declines here from 14.2 to 10.2 with a gradual increase up to 17.3 at 34–36 cm depth (~500 cal yr BP) and a sharp decrease to 7.7 at 11 cm depth (165 cal yr BP) (Fig. 5).
FT-IR analysis
We detected the main absorption intensities of bulk peat samples in the following wavenumber ranges: 3700–3000/cm, 3002–2827/cm, 1835–1491/cm, 1479–1348/cm, 811–700/cm, 676–660/cm, 660–518/cm, and 515–403/cm (with one peak at 468/cm or three peaks at 468/cm, 421/cm, and 405/cm) (Fig. 6). There are no absorption intensities detected in the wavenumber range from 2827 to 1935/cm. The broad absorption falls within the 1835–1491/cm range, with the maximum fluctuating from 1661 to 1636/cm. The shape of the region at 1479–1348/cm is similar within the core. Some spectra show three peaks here at ~1453/cm, ~1420/cm, and ~1384/cm. The highest absorption throughout the entire spectral data is in the 1344–812/cm wavenumber range with the maximum fluctuating from 1088 to 998/cm. The maximum absorption intensity is quite constant among the samples in comparison with other peaks. This band is largely single mode, but it was slightly curvaceous at some spectra with extrema at 1212/cm, 1155/cm, and 1120/cm. Three spectra from the lower section of the peat core exhibited weak splitting at 1087/cm, 1033/cm, and 1009/cm. The shape of four bands, from 811 to 403/cm, is quite regular from spectrum to spectrum.

Figure 6 Example of six baseline-corrected Fourier transform infrared spectroscopy (FT-IR) absorbance spectra of CR-03 peat samples.
Using the field core description, we divided 31 FT-IR samples into three groups for reconstruction of sedimentary history: the first consisted of 6 samples from the layers located beneath ash/lapilli/pumice layers; the second group represented 8 peat layers intercalated by thin ash layers; and the third group represented peat presumably lacking a strong volcanic ash signature (17 layers) (Table 5).
Table 5 Mean absorption intensities originating from Si-O bonds of silicates of three groups of samples. HI, humification index; IR, infrared.

DISCUSSION
Peat deposits accumulate and decompose and many external and internal driving forces affect peat evolution. Studying peat deposit changes over time—by combining proxy data from biotic (pollen, carbon, and nitrogen) and abiotic (e.g., volcanic) signals within a sedimentology context—is a promising way to reconstruct past complex ecosystems and the environment. Ultimately, our goal was to assess human migration, climate change, and geologic hazards such as volcanic eruptions, as important driving forces that changed the accumulating peat.
The CR-03 peat deposit originates from a type of peatland that is uncommon in paleoclimate reconstruction studies. For this Carlisle Island location, local geographic conditions including water flowing from the volcano slopes and good drainage from the underlying lava flow, as well as rainfall, influence the CR-03 peatland. The absence of a water table separating the catotelm and acrotelm (as in a common type of peatland like ombrotrophic peat bog), along with various sources of noise (e.g., volcanic activity) in the CR-03 peat deposit, complicates substantially our interpretation of this peatland’s dynamics.
Peat accumulation and preservation history
In order to assign chemical meaning to the absorption peaks of the wavenumber regions listed previously (see “Results”), we compared the absorption peaks of the CR-03 peat core spectra with the similar FT-IR peat studies (Holmgren and Nordén, Reference Holmgren and Nordén1988; Baes and Bloom, Reference Baes and Bloom1989; Niemeyer et al., Reference Niemeyer, Chen and Bollag1992; Broder et al., Reference Broder, Blodau, Biester and Knorr2012; Krumins et al., Reference Krumins, Klavins and Seglins2012; Biester et al., Reference Biester, Knorr, Schellekens, Basler and Hermanns2014). The wide absorption range around 3395/cm originates from the OH- stretch of various groups—phenols, aliphatic carbohydrates, and H2O (Fig. 6).
Two distinct peaks at 2925/cm and 2855/cm are strongly assigned to asymmetric and symmetric CH stretches, respectively, of -CH2- of aliphatics and are quite usual for peats (Artz et al., Reference Artz, Chapman, Robertson, Potts, Laggoun-Défarge, Gogo, Comont, Disnar and Francez2008; Broder et al., Reference Broder, Blodau, Biester and Knorr2012; Krumins et al., Reference Krumins, Klavins and Seglins2012). The following maximum of the broad absorption range (1835–1491/cm) fluctuating from 1661 to 1636/cm is generally assigned to lignin, aromatics, and aliphatic carboxylates with the main contributions of the -C=O stretch of carbonyl and carboxyl groups at 1720/cm and aromatic -C=C- stretch and/or asymmetric –COO- stretch at 1610/cm. However, Holmgren and Nordén (Reference Holmgren and Nordén1988) prefer to assign it to aromatics rather than to the –COO- stretch. Some spectra exhibit multiple distinct peaks in this region—at 1720/cm, 1650/cm, 1636/cm, 1559/cm, 1540/cm, and 1518/cm. Some of these peaks are more representative of “Carex peat” (Holmgren and Nordén, Reference Holmgren and Nordén1988) rather than “Sphagnum peat” (e.g., the peaks at 1650/cm and 1540/cm are specific for amide I and II vibrations of peptide bonds). The peaks at ~1453/cm, ~1420/cm, and ~1384/cm are specific to CH- deformations of CH3-, CH- bending of CH2, and OH deformations and phenolic CO stretch of various aliphatic and phenolic structures.
The 1344–812/cm region is the highest absorption throughout the spectra. The absorption within 1250–1000/cm is generally common for various carbohydrates and cellulose particularly because of OH- vibrations of –COOH and -C-O- stretch (polysaccharides, aliphatic ethers and esters, and primary and secondary alcohols). However, the main signal of volcanic ash (Djobo et al., Reference Djobo, Elimbi, Tchakoute and Kumar2016) is also located in this region of IR wavenumbers because of SiO and Al-O vibrations of alumosilicates around 1014/cm. For the CR-03 peatland, volcanic tephra contributed significantly to the FT-IR spectral data (Table 5, Fig. 6) in which this volcanic input created partial overlap of an aluminosilicate signal with carbohydrate vibrations. However, we cannot confidently estimate the influence of ash without a special technique to identify ash concentration like that used by Broder et al. (Reference Broder, Blodau, Biester and Knorr2012). This circumstance complicates the interpretation of the sedimentation history of the CR-03 peat deposit because Cleveland volcano on Chuginadak Island is currently one of the most active stratovolcanoes in the Aleutian chain (Werner et al., Reference Werner, Kern, Coppola, Lyons, Kelly, Wallace, Schneider and Wessels2017), although its prehistoric record of activity is only now being described (Pekar et al., Reference Pekar, Nicolaysen, Bridges and Dehn2005; Neal et al., Reference Neal, Izbekov and Nicolaysen2015). Volcanic eruptions destroy the surrounding vegetation by covering it with tephra (Collins, Reference Collins1969; Edwards et al., Reference Edwards, Dugmore and Blackford2004; Hotes et al., Reference Hotes, Grootjans, Takahashi, Ekschmitt and Poschlod2010), and the ash itself strongly affects substrate chemistry (Mizota and van Reeuwijk, Reference Mizota and van Reeuwijk1989; Tsutsuki and Kuwatsuka, Reference Tsutsuki and Kuwatsuka1992). Consequently, ash modifies the conditions for plant growth and various soil processes, ultimately affecting decomposition of organic matter and pollen preservation (Hulten, Reference Hulten1974; Broder et al., Reference Broder, Blodau, Biester and Knorr2012).
In this case, visual description is insufficient in estimating ash content, and the techniques, including precise microanalysis or analyses of various metals, are required to determine the complex ash depositional history following volcanic eruptions (Zoltai, Reference Zoltai1989; Broder et al., Reference Broder, Blodau, Biester and Knorr2012).
Peaks from 811 to 403/cm are usually not of interest to peat scholars, who focus on organic compounds, because this wavenumber range of IR spectra shows a high intensity of mineral absorption (Biester et al., Reference Biester, Knorr, Schellekens, Basler and Hermanns2014). The strong alumosilicates band at 1014/cm presumably overlaps all CO and OH vibrations of polysaccharides. In contrast, two peaks at 545/cm and 578/cm, specific for Si-O bonds of silicates, likely do not overlap with any organics and could be used to estimate the ash signal separately from the organic signal (Djobo et al., Reference Djobo, Elimbi, Tchakoute and Kumar2016). The absolute absorption intensities of SiO are similar when comparing the two groups influenced by ash or other volcanic products (Table 5). The third group, which presumably was not affected or much less affected by volcanic materials, showed much less SiO absorption (Table 5). All of the relative absorptions at the selected wavenumbers, except 1053/cm and also HI, strongly and negatively correlate with core depth (R 2 value varies from 0.69 to 0.76; see Table 4). Along with C and N percentages, they reflect the total decrease of all the organics with depth, but 1053/cm absorption intensity does not correlate with depth in the same way. If we choose only those 17 samples that came from layers that visibly contain no volcanic contaminants (Table 5), the trend of HI is similar to 1630/cm shown in Figure 6 and indicates the loss of organic matter from the top to the bottom of the core.
The C/N ratio, along with δ13C, is useful in evaluating rates and levels of decomposition (Biester et al., Reference Biester, Knorr, Schellekens, Basler and Hermanns2014). In reconstructing the decomposition, if a peat layer records a relative loss of C with respect to N, then this indicates peat mass loss (Kuhry and Vitt, Reference Kuhry and Vitt1996; Hornibrook et al., Reference Hornibrook, Longstaffe, Fyfe and Bloom2000). Within the same layer that shows decrease in C/N, the δ13C usually increases with decomposition because of isotopic fractionation by microorganisms; these selectively use the lighter carbon isotope (12C) in degradation reactions (Kalbitz et al., Reference Kalbitz, Geyer and Geyer2000). Both δ13C and FT-IR 1630/cm trends indicate the loss of organic matter. The absence of a depth-dependent trend in C/N data contradicts this; thus in this particular case, it means that C/N data reflect some other factor(s) not associated with decomposition processes taking place in this peat deposit. We examined how δ13C, % C, % N, and selected FT-IR absorption intensities for organic compounds correlated with the core depth (Table 4).
In our case, this correlation reflects a time-dependent decomposition process rather than humidity. At the CR-03 deposit, the C/N ratio does not exhibit a pronounced declining trend (Fig. 5). The peat deposit grew quickly because of optimum growing conditions and because the rate of decomposition was low. These cooler and wetter conditions could lead to relatively increased dead biomass accumulation.
Paleoenvironmental reconstruction
Peat accumulation at CR-03 began at approximately 7300 cal yr BP. When the peat deposit began to form, Ericales dwarf shrubs dominated (Figs. 3 and 4) indicating heath vegetation. Peat cores from Tanaga Island (Anderson and Bank, Reference Anderson and Bank1952) and the Alaska Peninsula (Jordan and Krumhardt, Reference Jordan and Krumhardt2003) also show the same initial stage of plant succession. At the same time, sedge-grass communities dominate the initial stage of peat core formation from Umnak, Atka, Attu, and Adak Islands (Heusser, Reference Heusser1973, Reference Heusser1978, Reference Heusser1985, Reference Heusser1990). Such differences could have been caused, on the one hand, by the different timing of initial peat accumulation and, on the other hand, by the different location and/or bedrock of their formation. Thus, the peat deposits from Umnak, Atka, and Adak began to form at the early Holocene (at ca. 9000–10,000 yr BP) when climatic conditions were postglacial and different than the following 2000–3000 yr (Heusser, Reference Heusser1973, Reference Heusser1978). Furthermore, these peatlands formed at the wet lake margins, whereas the CR-03 peat core originated from peatland located on a lava flow. Hulten (Reference Hulten1974) suggested that pioneer vegetation, populating firm lava strata, often consists of shrublike vegetation. Well-drained substrates with low fertility produced by lava flow were suitable for heath communities, as we see with the predominance of Ericales and the presence of Caryophyllaceae and Asteraceae pollen at the initial stage of the CR-03 peat core.
The predominance of heath communities could be evidence of cold conditions (Heusser, Reference Heusser1978, Reference Heusser1985, Reference Heusser1990; Jordan and Krumhardt, Reference Jordan and Krumhardt2003)—for example, conditions compatible with Holocene glacier advances dated at 7500–5500 yr BP (Black, Reference Black1981). However, other studies—for example, sea surface temperature (Caissie et al., Reference Caissie, Brigham-Grette, Lawrence, Herbert and Cook2010; Harada et al., Reference Harada, Katsuki, Nakagawa, Matsumoto, Seki, Addison, Finney and Sato2014) and chironomids data for eastern Beringia (Kaufman et al., Reference Kaufman, Axford, Henderson, McKay, Oswald, Saenger and Anderson2016)—suggest that the maximum temperature occurred during the middle Holocene (7000–5000 cal yr BP) and gradually decreased over time. Furthermore, the regional vegetation changes could have been influenced by humidity, which can be linked to intensity and location of the Aleutian Low (Hare and Hay, Reference Hare and Hay1974), rather than by temperature. The Aleutian Low is a low-pressure system located near the Aleutian Islands and is one of the largest atmospheric circulation patterns in the Northern Hemisphere (Rodionov et al., Reference Rodionov, Bond and Overland2007). During a severe Aleutian Low, especially conspicuous in wintertime, cyclones affect the eastern Aleutian Islands, resulting in increased storm frequency and heavier rainfall 9600–4000 cal yr BP (Krawiec et al., Reference Krawiec, Kaufman and Vaillencourt2013). Reconstruction of precipitation changes for Adak Island (the central Aleutian Islands) showed changes in humidity and storm frequency but revealed no marked trend (Krawiec et al., Reference Krawiec, Kaufman and Vaillencourt2013; Krawiec and Kaufman, Reference Krawiec and Kaufman2014).
Instead of sensitivity to regional temperature or precipitation, a microclimate effect such as wind may have initiated a heath-dominated ecosystem. Heaths are also widely distributed in windy locations, where the strong winds become a limiting factor for the other plants (Daniëls et al., Reference Daniëls, Talbot, Talbot and Schofield2004), while some Ericales species (especially Empetrum) are uniquely able to endure winds of high intensity over prolonged periods (Heusser, Reference Heusser1978). The highest concentration of alder and birch pollen at the bottom of the CR-03 peat core (Fig. 3) is most likely the result of long-distance transportation (Hulten, Reference Hulten1968) from Alaska or the eastern Aleutians by strong winds (Heusser, Reference Heusser1978). Interestingly, a high concentration of Apiaceae pollen and fern spores was identified among the numerous Ericales pollen. This evidence suggests that approximately 7000–6000 yr ago ericaceous shrubs covered the flat plateau at the top of the Carlisle peninsula, and apiaceous plants and ferns grew in some depressions. Many islands in the Aleutians exhibit similar plant communities (Heusser, Reference Heusser1973, Reference Heusser1978, Reference Heusser1985, Reference Heusser1990; Garroutte and Ickert-Bond, Reference Garroutte and Ickert-Bond2013).
It should be noted that communities of nitrophilous plants with a predominance of Apiaceae and ferns are abundant in the CR-03-1 palynozone (Fig. 4), which indicates a rich nitrogen habitat. Such habitat is associated with large nearby bird nesting colonies (Byrd, Reference Byrd1984; Garroutte and Ickert-Bond, Reference Garroutte and Ickert-Bond2013). The high value of δ15N (Table 3, Fig. 5) in the lower layers of the CR-03 peat deposit confirms the presence of a large seabird colony and accumulation of guano, which resulted in significant fertilization at the initial stage of CR-03 peat core (Szpak et al., Reference Szpak, Millaire, White and Longstaffe2012). The maximum concentrations of Apiaceae pollen and fern spores (Fig. 4), as well as the highest values of δ15N (up to 11.4‰; Table 3, Fig. 5), occur ca. 7100–7000 cal yr BP.
Savinetsky et al. (Reference Savinetsky, Khasanov, West, Kiseleva and Krylovich2014) found that δ15N of the nearshore peat deposit on Shemya Island has the potential to record a collapse in seabird nesting colonies, and this has been attributed to human appearance on the island. At the same time, seabird nitrogen fertilization did not affect the Shemya peatland located at the interior of the island (Savinetsky et al., Reference Savinetsky, Khasanov, West, Kiseleva and Krylovich2014). Because colonial seabirds nest near the shore, peatland located inland never received an infusion of nitrogen. Thus, the δ15N of the inland peat remained constant at ~0‰ over its entire deposition history (9000 cal yr BP to present) regardless of human presence or absence.
In contrast, the CR-03 peatland is directly adjacent to the shore, and its δ15N has the potential to record human impact on seabird populations. In the CR-03 peat deposit, δ15N decreased to ~4–5‰ by ca. 6900 cal yr BP (Fig. 5), which could suggest that the size of seabird nesting colonies had dramatically decreased, but some colonial nesting birds remained and continued to regularly fertilize the soil at the CR-03 peatland site. We expected that humans might have negatively affected seabird populations on Carlisle Island beginning as early as 6900 cal yr BP. The eastward neighbor Fox Islands were first inhabited some 9000–8000 cal yr BP (Davis and Knecht, Reference Davis and Knecht2010; Hatfield, Reference Hatfield2011), and westward Adak Island in the central Aleutians was inhabited ~6700 cal yr BP (Hatfield, Reference Hatfield2011). So we suggest that the IFM were inhabited by 6900 cal yr BP, when the δ15N decline in the CR-03 peat deposit is observed. However, there are no other signs of human presence (archaeological or geomorphological) on the IFM at this time (Hatfield et al., Reference Hatfield, Nicolaysen, West, Krylovich, Bruner, Savinetsky and MacInnes2019; Persico et al., Reference Persico, Lanman, Loopesko, Bruner and Nicolaysen2018). The first archaeological traces of human occupation occur at about 4000 cal yr BP (Hatfield et al., Reference Hatfield, Nicolaysen, West, Krylovich, Bruner, Savinetsky and MacInnes2019). Perhaps the islands were inhabited earlier and that evidence has been buried or eroded (Persico et al., Reference Persico, Lanman, Loopesko, Bruner and Nicolaysen2018). Further research at sites with older soil deposition may result in extended time depth for the human occupations in these islands (Hatfield et al., Reference Hatfield, Nicolaysen, West, Krylovich, Bruner, Savinetsky and MacInnes2019).
The presence of Selaginella spores in the lowest zone of the CR-03 peat deposit (CR-03-1 palynozone; Figs. 3 and 4) is notable. This vascular cryptogam plant, Selaginella selaginoides, the most common Selaginella species on the Aleutian Islands (Tatewaki and Kobayashi, Reference Tatewaki and Kobayashi1934; Hulten, Reference Hulten1968; Shacklette et al., Reference Shacklette, Durrell, Erdman, Keith, Klein, Krog, Persson, Skuja and Weber1969; Byrd, Reference Byrd1984), inhabits open shores and poorly developed soils (Kisieliene et al., Reference Kisieliene, Stancikaite, Merkevicius and Namickiene2005), which took place at the initial stage of the CR-03 peat core. Heusser (Reference Heusser1990) suggests that Selaginella selaginoides arrived at the Aleutians after glaciation very recently (at about 3000–4000 yr BP) and that the species in the Aleutians is derived from a Japanese or Asiatic source and has been slow to migrate eastward during the Holocene (Heusser and Igarashi, Reference Heusser and Igarashi1994). Our pollen data refute this speculation because spores of Selaginella are noted on Carlisle Island at least 7000 yr ago, supporting a westward migration of Selaginella from northwestern North America after deglaciation.
Circa 6100 cal yr BP, sedge-grass communities began replacing heath vegetation (Fig. 3). Pollen concentrations of Cyperaceae and Poaceae (Fig. 4) did not significantly increase, but at the same time, Sphagnum and Typha appear in the pollen spectra, which is a good marker of wetlands. The presence of Sphagnum, Typha, Cyperaceae, and Polypodiaceae trilete spores are indicative of moist meadows (Jordan and Krumhardt, Reference Jordan and Krumhardt2003). The development of wetlands could occur both as a result of climate amelioration and as a result of changes in the hydrologic regime of the CR-03 site. Jordan and Krumhardt (Reference Jordan and Krumhardt2003) suggest a warming climatic trend between 6200 and 3200 yr BP.
Heusser (Reference Heusser1973, Reference Heusser1985, Reference Heusser1990), Jordan and Krumhardt (Reference Jordan and Krumhardt2003), and Krawiec and Kaufman (Reference Krawiec and Kaufman2014) noted that approximately 6000 yr ago wind strength decreased. With decreasing winds, alder and birch pollen no longer found its way to the IFM; this change is reflected in our pollen records where their concentration is greatly reduced (Figs. 3 and 4). Under the ameliorated conditions, the importance of willow (Salix spp.) in tundra increased and willow thickets could have developed (Heusser, Reference Heusser1973). Willow communities, capable of formation under calmer conditions, were present on Umnak Island from approximately 8500 to 3500 cal yr BP (Heusser, Reference Heusser1973). Some decrease in Ericales pollen can also be explained by decreasing wind strength. Moisture-loving and tall herbaceous vegetation of sedge-grass communities partially replaced the heaths in response to reduced wind activity and to the climate humidification and warming about 6100 yr ago (Jordan and Krumhardt, Reference Jordan and Krumhardt2003).
Wetlands remained until 5300 yr BP, and then Sphagnum, Typha, and Polypodiaceae trilete spores disappeared from the spectra. The presence of Boraginaceae, Artemisia, and Lycopodium suggests dryer environments between 5300 and 4500 cal yr BP. Jones et al. (Reference Jones, Peteet, Kurdyla and Guilderson2009) suggest dryer climatic conditions between 5500 and 4000 cal yr BP.
According to reconstructions, the eastern Aleutian Islands became more humid and cooler around 4000 cal yr BP, and circulation patterns became similar to today’s atmospheric conditions (Caissie et al., Reference Caissie, Brigham-Grette, Lawrence, Herbert and Cook2010; Krawiec et al., Reference Krawiec, Kaufman and Vaillencourt2013; Harada et al., Reference Harada, Katsuki, Nakagawa, Matsumoto, Seki, Addison, Finney and Sato2014; Krawiec and Kaufman, Reference Krawiec and Kaufman2014; Kaufman et al., Reference Kaufman, Axford, Henderson, McKay, Oswald, Saenger and Anderson2016). This 4000-yr boundary is not well reflected in the Carlisle vegetation history, but there are some changes in pollen spectra since 4500 yr BP. Artemisia and Boraginaceae pollen disappear from the CR-03 pollen spectra, which can be an indicator of some humidification as these plants occupy mostly more xeric habitat (Jordan and Krumhardt, Reference Jordan and Krumhardt2003). Also, the disappearance of Salix may indicate some cooling in the region.
However, C/N ratios in the CR-03 peat core remain relatively stable from approximately 6100 to 2000 cal yr BP (Fig. 5). These nearly constant C/N ratios, with only single peaks and valleys, could represent insignificant plant community changes as well as fluctuating conditions of organic matter decomposition (Broder et al., Reference Broder, Blodau, Biester and Knorr2012). Yet pollen spectra of the CR-03 peat core between 4500 and 2450 cal yr BP are characterized by very low TPC as well as by abrupt changes both in the concentrations of individual taxa and their percentage, which may be the result of local conditions (i.e., regular volcanic activity; Hulten, Reference Hulten1974; Heusser, Reference Heusser1978, Reference Heusser1990). The result of the regular ash falls is a frequent condition of patch dynamics (Pickett, Reference Pickett1980), whereby seral heterogeneity in the plant communities is maintained through disturbance (Heusser, Reference Heusser1990). At CR-03, volcanic eruptions and depositions of ash triggered rhysiums—specific vegetation succession following volcanic eruptions (Lincoln et al., Reference Lincoln, Boxshall and Clark1985)—and would explain low TPC and absence of pronounced trends in the individual taxa dominance. Despite periodic tephra falls, ericaceous pollen remained present in the CR-03 pollen spectra. Heusser (Reference Heusser1990) suggests that Ericales (especially, Empetrum) percentages increased following some ash falls, for example, at the Atka Island. At CR-03, plant species from Ericales and some taxa were pioneers on erupted substrates similar to Kamchatka (Hulten, Reference Hulten1974) and expanded from time to time. In other cases, as at Kodiak Island, no increase in Ericales occurred after tephra deposition (Peteet and Mann, Reference Peteet and Mann1994). There is no evidence thus far of eruptions of Carlisle volcano in the Holocene (Persico et al., Reference Persico, Lanman, Loopesko, Bruner and Nicolaysen2018) that could have directly influenced the Carlisle Island vegetation. The eruptions of other volcanoes (especially Cleveland volcano on the Chuginagak Island) were apparently not very destructive to vegetation; therefore, sharp changes in vegetation because of volcanism are not observed.
Significant changes in the CR-03 peat deposit occurred at approximately 2450 cal yr BP. At this time, Ericales pollen and cryptogam spores completely disappeared from the spectra (Figs. 2 and 3). The sedge communities with grasses and some forbs became predominant. These meadows dominated by Cyperaceae are indicative of the cooler and wetter conditions of the Neoglacial (Heusser, Reference Heusser1973, Reference Heusser1983). The glacial advances associated with the Neoglacial event occurred in the Aleutians and western Alaska Peninsula after about 3000 yr BP (Thorson and Hamilton, Reference Thorson and Hamilton1986; Jordan and Krumhardt, Reference Jordan and Krumhardt2003), and Persico et al. (Reference Persico, Lanman, Loopesko, Bruner and Nicolaysen2018) note that a glacier was on Carlisle volcano during the Neoglacial.
Because δ15N (Fig. 4) gradually increased above the Okmok II tephra layer that originated from Okmok caldera (Umnak Island) (Larsen et al., Reference Larsen, Neal, Schaefer, Begét and Nye2007), we suggest there was an insignificant decline in human occupation in the vicinity of CR-03 after the volcanic eruption dated ca. 2000 cal yr BP (Okuno et al., Reference Okuno, Izbekov, Nicolaysen, Nakamura, Savinetsky, Vasyukov and Krylovich2017), which allowed seabird populations to recover and fertilize the peat. δ15N slightly decreased about 1200 cal yr BP (Fig. 5) that probably occurred because of some human impact. Because the Okmok II ash layer evident in the Ulyagan village is quite thin, a direct ecological and human mortality impact is unlikely (Hatfield et al., Reference Hatfield, Nicolaysen, West, Krylovich, Bruner, Savinetsky and MacInnes2019); however, there is a significant gap in the human occupation sequence in the archaeological complex between 2100 and 1950 BP correlating with the Okmok II eruption (Hatfield et al., Reference Hatfield, Nicolaysen, West, Krylovich, Bruner, Savinetsky and MacInnes2019).
δ15N dramatically increased (up to 13‰) after CR-02 tephra fall (1050 cal yr BP; Okuno et al., Reference Okuno, Izbekov, Nicolaysen, Nakamura, Savinetsky, Vasyukov and Krylovich2017) between 1050 and 500 cal yr BP (Fig. 5). We suggest that the rise of δ15N reflects the expansion of the seabird nesting colonies as a result of the lack of human predation as people disappeared from the Carlisle Island vicinity because of the Cleveland volcano eruption (CR-02) at ca. 1050 cal yr BP (Okuno et al., Reference Okuno, Izbekov, Nicolaysen, Nakamura, Savinetsky, Vasyukov and Krylovich2017). Another gap in the human occupation sequence dates from 1700 to 1000 BP (Hatfield et al., Reference Hatfield, Nicolaysen, West, Krylovich, Bruner, Savinetsky and MacInnes2019), correlating with the rise in δ15N.
A significant rise of Poaceae and Cyperaceae pollen concentration (Fig. 4) occurred above the CR-02 tephra layer. Decreased precipitation and cooler conditions during the early Little Ice Age (LIA) attributable to a stronger Aleutian Low are described in numerous studies (Vaillencourt, Reference Vaillencourt2013; Kaufman et al., Reference Kaufman, Axford, Henderson, McKay, Oswald, Saenger and Anderson2016). Glacier readvance occurred on the Carlisle volcano during the LIA (Persico et al., Reference Persico, Lanman, Loopesko, Bruner and Nicolaysen2018). There is decline of δ13C (Fig. 4) in the CR-03 peat core ca. 1050–500 cal yr BP, which might be caused by rapid accumulation of grass and sedge phytomass. Because of cooler and dryer conditions at this time, phytomass did not decompose (Loisel et al., Reference Loisel, Garneau and Hélie2009). This is also confirmed by a significant increase in the C/N ratio (Fig. 5).
In the CR-03 peat deposit, δ15N rapidly decreased after ca. 500 cal yr BP (Fig. 5) because of severe human predation. In unit 5 at the Ulyagan archaeological site on Carisle Island, Krylovich et al. (Reference Krylovich, Vasyukov, Khasanov, Hatfield, West and Savinetsky2018) identified an abundance of storm petrel remains in midden deposits that formed 500–300 cal yr BP. Ulyagan unit 2, dating to ca. 150 cal yr BP, reflects sparse amounts of storm petrel remains (Krylovich et al., Reference Krylovich, Vasyukov, Khasanov, Hatfield, West and Savinetsky2018). This combined evidence suggests that a large nesting seabird colony, which had once deposited large amounts of guano onto the landscape and ultimately into the peat deposit, was significantly reduced in size. This seabird reduction ultimately resulted in the low δ15N in uppermost levels of the CR-03 peat deposit. It is possible that such major changes in seabird colony size result from changing environmental conditions (i.e., climate change during the LIA with or without the impact of human predation). However, very little is known about storm petrel ecology. The few ecological studies and observations have not yet revealed a relationship between population dynamics of the storm petrel and climatic variations. Predators are still the main influencing factor for storm petrels, and humans were the only predators in the Four Mountains at this time (Byrd et al., Reference Byrd, Renner and Renner2005).
We propose that hunter-gatherers returned to Carlisle Island ca. 600 yr after the Cleveland volcanic eruption (1050 cal yr BP) that produced the CR-02 ash and significantly reduced the sizable seabird population, just as they had after the volcanic explosion that created the Okmok II tephra layer. Although Black (Reference Black1981) suggests that people could immediately return to an island following volcanic eruptions, the CR-03 peat suggests that some time passed between volcanic eruptions and island resettlement.
The increasing trend of δ13C after 500 cal yr BP to present (Fig. 4) can still be linked with decreases in grass and sedge concentrations. Occurrence of Triglochin, exclusive to wet habitats, after 400 cal yr BP and the appearance of Typha and Sphagum (Figs. 3 and 4) may indicate a relative increase in local eastern Aleutian humidity at approximately 400 cal yr BP (Hulten, Reference Hulten1968). It may be indicative of the wet late phase of the LIA, caused by a weakened Aleutian Low between 400 and 100 cal yr BP (Vaillencourt, Reference Vaillencourt2013).
CONCLUSIONS
This study reveals 7300 yr of eventful history recorded by the Carlisle Island peatland. The CR-03 peat core constitutes a complex deposition of peat material that has accumulated and developed through various climate regimes, volcanic eruptions, changes in seabird fertilization, and indirect anthropogenic activity. Our data and interpretations indicate that heath plant communities comprised the initial stage in the environmental history of Carlisle Island coastal habitats, and this pioneer vegetation stage has also been noted on Tanaga Island and the Alaska Peninsula. Initial peat deposits on other islands (Umnak, Atka, Attu, and Adak Islands) are characterized by sedge-grass communities. Such differences could have been caused by variations in the timing of peat accumulation or by different locations and bedrock foundations of their formation. The CR-03 peat deposit began accumulation in (1) generally more severe climate 7300–6100 cal yr BP, with associated strong winds, and (2) relatively reduced moisture conditions on lava flow surfaces that primarily enabled successful growth of Ericales heath communities.
The proxy data suggest that significant environmental changes occurred at 6100 cal yr BP when sedge-grass communities began replacing heath vegetation. As evidenced by changes in the pollen spectra, the climatic amelioration with decreasing winds took place at this time. The 4000-yr boundary when the climate of eastern Aleutians became cooler and more humid is not well reflected in the Carlisle vegetation history, but there are some changes in pollen spectra after 4500 yr BP that reflect some increased humidity and cooling conditions. Other vegetation changes observed in the CR-03 core at this time cannot be directly associated with climate because frequent volcanic activity influenced vegetation varieties, growth, and decomposition and also TPC. Significant changes in the CR-03 peat deposit occurred at approximately 2450 cal yr BP when there is some evidence of cooler and wetter conditions of the Neoglacial.
CR-03 peat records provide information about behaviors of both humans and large seabird colonies, which correlates with other paleoenvironmental studies. Relatively high values of heavy nitrogen isotope (up to 11‰) observed at 7100–7000 cal yr BP reflect fertilization of seabird nesting colonies near the coastal location of the CR-03 peat core. Conversely, the δ15N of the inland peat on Shemya Island remained constant at ~0‰ over its entire deposition time (Savinetsky et al., Reference Savinetsky, Khasanov, West, Kiseleva and Krylovich2014). At the same time, communities of nitrophilous plants with a predominance of Apiaceae and ferns are abundant, which indicates a rich nitrogen habitat. Significant decrease in δ15N (~50%) ca. 6900 cal yr BP could indicate that humans colonized Carlisle Island and began hunting seabird colonies around this time, even though no archaeological or geomorphological evidence for this early settlement of the IFM exists (Hatfield et al., Reference Hatfield, Nicolaysen, West, Krylovich, Bruner, Savinetsky and MacInnes2019; Persico et al., Reference Persico, Lanman, Loopesko, Bruner and Nicolaysen2018). The first physical traces of human occupation occurred at 4000 cal yr BP (Hatfield et al., Reference Hatfield, Nicolaysen, West, Krylovich, Bruner, Savinetsky and MacInnes2019). Perhaps the islands were inhabited earlier and that evidence has been buried or eroded (Persico et al., Reference Persico, Lanman, Loopesko, Bruner and Nicolaysen2018). This scenario of depressed δ15N and, by inference, of low seabird population lasted until the most significant regional volcanic eruptions, which deposited Okmok II and CR-02 tephra layers at ca. 2000 and 1050 cal yr BP, respectively. We infer both ash falls significantly decreased human populations in the vicinity of CR-03 peatland and decreased hunting pressure on seabirds. This terrestrial, multiproxy climate record fills a substantial spatial gap in records used to understand Pacific Ocean response to global climate.
Application of multiple proxies (radiocarbon dating, pollen analysis, C/N ratio, analysis of stable C and N isotopes composition, and FT-IR spectrometry) has proved to be useful for determining climatic, biological, volcanic, and human variations during the Holocene, but clarification of the details of these changes may come from other techniques. These include identification of trace and heavy metals, loss on ignition, gas chromatography mass spectrometry, macrofossil identification, and diatom analysis.
ACKNOWLEDGMENTS
This research was funded by the National Science Foundation, Office of Polar Programs (OPP#1301927, OPP#1301925, and OPP#1301929), Grant RFBR Nos. 15-04-07969, 15-04-09024, and 18-04-00782, Keck Geology Consortium (REU#1358987), with additional funding and support from the Russian Programs “Biodiversity” and “Origin and Evolution of Biosphere.” The authors are very thankful to Maria B. Nosova for her help in conducting pollen analysis and Evgeniy N. Antonov, Andrey O. Alexeev, Olga Rusakova, Alexei V. Tiunov, and Mikhail I. Makarov for helpful advising. The authors are grateful to Kirsten Nicolaysen for her assistance and constructive comments. Work was conducted in collaboration with the Aleut Corporation, the Alaska Volcano Observatory, and the Alaska National Maritime Wildlife Refuge. Any opinions, findings, and conclusions or recommendations expressed in this material are those of the author(s) and do not necessarily reflect the views of the National Science Foundation.
SUPPLEMENTARY MATERIAL
To view supplementary material for this article, please visit https://doi.org/10.1017/qua.2018.114