


Introduction
The bogue Boops boops (Linnaeus, 1758) belongs to the Sparidae family and represents the most popular species in the Mediterranean Sea (El-Maremie & El-Mor, Reference El-Maremie and El-Mor2015). This species is distributed widely throughout the eastern Atlantic Ocean, Black and Mediterranean seas, including Tunisian waters (Amira et al., Reference Amira, Alioua and Harchouche2019). On the Tunisian coast, it is one of the most common and commercially important species, with landings of about 3397 tons in 2015 (Ider et al., Reference Ider, Ramdane, Mahe, Dufour, Bacha and Amara2017). In addition, this is a demersal species, as well as semi-pelagic, gregarious, and lives on all types of the bottom substrata, including mud, rock, sand and seagrass beds (Ceyhan et al., Reference Ceyhan, Ertosluk, Akyol and Özul2018; Şimşek et al., Reference Şimşek, Çiloğlu, Yildirim and Pekmezci2018). It is commonly found at depths between 50–350 m and in coastal waters, it sometimes moves in aggregations, ascending mainly to the surface at night (Rachid et al., Reference Rachid and Boutiba2014; Ider et al., Reference Ider, Ramdane, Mahe, Dufour, Bacha and Amara2017). Pollard et al. (Reference Pollard, Carpenter and Russell2014) reported that B. boops grows rapidly in length during the first year of life, where it reaches 53.49% of its final growth length and can live up to 7 years. In Egypt, Azab et al. (Reference Azab, El-Far and El-Sayed2019) stated that its total length ranged from 9.3–23 cm and the total weight varied between 7.4–133.1 g, while the length-weight relationship revealed a tendency towards isometric growth. They also said that its longevity is 4 years and the length at first capture and maturity is 12.5 and 13.2 cm, respectively, while the total mortality rate is 2.26 y−1. Nevertheless, Khemiri et al. (Reference Khemiri, Gaamour, Zylberberg, Meunier and Romdhane2005) and Monteiro et al. (Reference Monteiro, Bentes, Coelho, Correia, Gonçalves, Lino, Ribeiro and Erzini2006) indicated that its sexual maturity appears between 1 and 3 years of age, with a length of about 15.2 cm. Along the Mediterranean coast in Benghazi, El-Maremie & El-Mor (Reference El-Maremie and El-Mor2015) reported that it feeds on a wide range of prey species, including Crustacea, Porifera, Coelenterata, seagrasses, Mollusca and Protozoa, while along the Algerian coast, it is omnivorous and feeds on benthic (Crustacea, Mollusca, Annelida, Sipuncula, Plantae) and pelagic prey (Siphonophorae, Copepoda, eggs) (Derbal & Kara, Reference Derbal and Kara2008). Jawad (Reference Jawad2003) analysed the asymmetry in some bilateral characters of samples collected from coastal waters near Benghazi City, Libya, and found the highest level of asymmetry in the post-orbital length character, while he observed the lowest level in the eye lens diameter and weight. Additionally, Ider et al. (Reference Ider, Ramdane, Mahe, Dufour, Bacha and Amara2017) analysed the variability of the otolith shape in three populations along the Algerian coast and observed a significant difference between the left and right otoliths, adding that the shape is influenced by the fish length and the sampling location, but it is not related to sex and age.
In Tunisian waters, however, Anato & Ktari (Reference Anato and Ktari1986) studied the age and growth of B. boops using otolith and scale reading and found that the age of first sexual maturity is between the 13th and 15th months after birth and the linear growth and weight of females slightly increase over males during the first four years of life. Similarly, Khemiri et al. (Reference Khemiri, Gaamour, Zylberberg, Meunier and Romdhane2005) determined the age and growth in four areas along the Tunisian coast by studying signs of growth in cross-sections of otoliths and reported that the hyaline zone deposits annually from November to April and that the increases in length and age fit the Von Bertalanffy equations. Additionally, Cherif et al. (Reference Cherif, Zarrad, Gharbi, Missaoui and Jarboui2008) analysed the length-weight relationship of individuals in the Gulf of Tunis and found a high degree of a positive correlation between total length and total weight (P > 0.05). Moreover, the infection of gallbladder of B. boops by Ceratomyxa ghannouchensis and C. pallida parasites has been confirmed in the Gulf of Gabes by Thabet et al. (Reference Thabet, Abdel-Azeem Abdel-Baki, Harrath and Mansour2019).
Anatomically, otoliths are structures found in the inner ear cavity of all teleost fish and functionally serve as a balance organ and also aid in hearing. Traditionally, they have been used to gather information about taxonomy, age and fish size (Mendoza, Reference Mendoza2006). Age, growth and mortality rates are the most influential life history characteristics that control the productivity of fish populations. Besides age and growth determination, otoliths have been the object of study in many different fields, such as fish biology (hearing and balance in fish), larval fish ecology, species identification, fish stock identification, and environmental reconstruction of fish habitats (Mendoza, Reference Mendoza2006).
During the last decades, study of the morphological characteristics of otoliths, in particular their shape, length, width, area, thickness and weight, has been used to test both genetic and environmental stressors and as a bioindicator to test the differentiation of populations and the variance in stock discrimination studies using Elliptical Fourier analysis (EFA) (Valentine et al., Reference Valentine, Soule and Samollow1973; Campana & Casselman, Reference Campana and Casselman1993; Begg & Waldman, Reference Begg and Waldman1999; Torres et al., Reference Torres, Lombarte and Morales-Nin2000; Smith et al., Reference Smith, Robertson, Horn, Bull, Anderson, Stanton and Oke2002; Panfili et al., Reference Panfili, Durand, Diop, Gourene and Simier2005; Turan, Reference Turan2006; Jawad et al., Reference Jawad, Al-Mamry and Al-Busaidi2010, Reference Jawad, Al-Mamry, Hager, Al-Mamari, Al-Yarubi, Al-Busaidi and Al-Mamary2011, Reference Jawad, Sadighzadeh and Al-Mamary2012a, Reference Jawad, Al-Mamry, Al-Mamary and Al-Hasani2012b, Reference Jawad, Mehanna, El-Regal and Ahmed2012c, Reference Jawad, Gnohossou and Tossou2016, Reference Jawad, Gnohossou and Tossou2020; Vignon & Morat, Reference Vignon and Morat2010; Cañás et al., Reference Cañás, Stransky, Schlickeisen, Sampedro and Fariña2012; Jawad, Reference Jawad2012, Reference Jawad2013; Lord et al., Reference Lord, Morat, Lecomte-Finiger and Keith2012; Treinen-Crespo et al., Reference Treinen-Crespo, Villegas-Hernández, Guillén-Hernández, Ruiz-Zárate and González-Salas2012; Mahe et al., Reference Mahe, Evano, Mille and Bourjea2014; Trojette et al., Reference Trojette, Fatnassi, Ben Alaya, Mahouachi, Chalh, Quignard and Trabelsi2014, Reference Trojette, Ben Faleh, Fatnassi, Marsaoui, Mahouachi, Chalh, Quignard and Trabelsi2015; Abu El-Regal et al., Reference Abu El-Regal, Jawad, Mehanna and Ahmad2016; Brophy et al., Reference Brophy, Haynes, Arrizabalaga, Fraile, Fromentin, Garibaldi, Katavic, Tinti, Karakulak, Macías, Busawon, Hanke, Kimoto, Sakai, Deguara, Abid and Santos2016; Hüssy et al., Reference Hüssy, Mosegaard, Albertsen, Nielsen, Hemmer-Hansen and Eero2016; Rebaya et al., Reference Rebaya, Ben Faleh, Allaya, Khedher, Marsaoui, Chalh, Quignard and Trabelsi2016, Reference Rebaya, Ben Faleh, Allaya, Kheder, Trojette, Marsaoui, Fatnassi, Chalh, Quignard and Trabelsi2017; Al-Busaidi et al., Reference Al-Busaidi, Jawad and Al-Balushi2017; Fatnassi et al., Reference Fatnassi, Kheder, Trojette, Mahouachi, Chalh, Quignard and Trabelsi2017; Ider et al., Reference Ider, Ramdane, Mahe, Dufour, Bacha and Amara2017; Khedher et al., Reference Khedher, Ben Faleh, Fatnassi, Rebaya, Chalh, Quignard and Trabelsi2017; Rodgveller et al., Reference Rodgveller, Hutchinson, Harris, Vulstek and Guthrie2017; Chakour & Elouizgani, Reference Chakour and Elouizgani2018; Khemiri et al., Reference Khemiri, Gaamour, Ben Abdallah and Fezzani2018; Kontaş et al., Reference Kontaş, Bostanci, Yedіer, Kurucu and Polat2018; Mejri et al., Reference Mejri, Trojette, Allaya, Ben Faleh, Jmil, Chalh, Quignard and Trabelsi2018; Reference Mejri, Trojette, Jmil, Ben Faleh, Chalh, Quignard and Trabelsi2020; Wang et al., Reference Wang, Wang, Lv and Li2018; Ben Mohamed et al., Reference Ben Mohamed, Mejri, Ben Faleh, Allaya, Jmil, Rebaya, Chalh, Quignard and Trabelsi2019; Fashandi et al., Reference Fashandi, Valinassab, Kaymaram and Fatemi2019; Jmil et al., Reference Jmil, Ben Faleh, Rebaya, Allaya, Ben Mohamed, Trojette, Chalh, Quignard and Trabelsi2019; Mahé et al., Reference Mahé, Ider, Massaro, Hamed, Jurado-Ruzafa, Goncalves, Anastasopoulou, Jadaud, Mytilineou, Elleboode, Ramdane, Bacha, Amara, De Pontual and Ernande B2019; Puentes et al., Reference Puentes, Rojas, Pavolini, Gutiérrez and Villa2019; Osman et al., Reference Osman, Farrag, Mehanna and Osman2020). Indeed, these studies have shown that the otolith shape is species-specific (Sadighzadeh et al., Reference Sadighzadeh, Valinassab, Vosugi, Motallebi, Fatemi, Lombarte and Tuset2014) and that variability in the otolith shape, structure and development is influenced by ontogenetic, genetic and environmental factors (Campana & Casselman, Reference Campana and Casselman1993; Cardinale et al., Reference Cardinale, Doering-Arjes, Kastowsky and Mosegaard2004; Vignon & Morat, Reference Vignon and Morat2010; Vignon, Reference Vignon2015; Hüssy et al., Reference Hüssy, Mosegaard, Albertsen, Nielsen, Hemmer-Hansen and Eero2016; Ider et al., Reference Ider, Ramdane, Mahe, Dufour, Bacha and Amara2017; Fashandi et al., Reference Fashandi, Valinassab, Kaymaram and Fatemi2019), as well as by sex, growth, maturity and pattern of fishery exploitation (Begg & Brown, Reference Begg and Brown2000), or by individual characteristics, e.g. the individual genotype (Jawad et al., Reference Jawad, Gnohossou and Tossou2020) or the physiological state (Campana & Neilson, Reference Campana and Neilson1985). But the possible cause of intra-individual variation, particularly the asymmetry in shape between the right and left otoliths, has been poorly studied (Mille et al., Reference Mille, Mahe, Villanueva, De Pontual and Ernande2015). Under normal conditions, the three orthogonal semi-circular otoliths at both sides of the head are morphologically symmetrical (Panfili et al., Reference Panfili, De Pontual, Troadec and Wright2002), although there are some inter-specific modifications in the size and shape (Popper & Lu, Reference Popper and Lu2000), but a weight difference; i.e. mass asymmetry, between masses of the left and right otoliths has also been observed (Ambuali et al., Reference Ambuali, Jawad and AL-Mamry2011; Jawad et al., Reference Jawad, Al-Mamry, Al-Mamary and Al-Hasani2012b, Reference Jawad, Mehanna, El-Regal and Ahmed2017, Reference Jawad, Gnohossou and Tossou2020; Jawad, Reference Jawad2013; Jawad & Sadighzadeh, Reference Jawad and Sadighzadeh2013; Al Balushi et al., Reference Al Balushi, Jawad and Al Busaidi2017; Dkhili et al., Reference Dkhili, Bouriga, Fatnassi, Ben Mohamed, Quignard and Trabelsi2018; Yedier et al., Reference Yedier, Bostancı, Kontaş, Kurucu and Polat2018). This fluctuation in mass asymmetry is assumed to reflect the developmental disorders of fish caused by different types of stress, such as genetic or environmental stress (Valentine et al., Reference Valentine, Soule and Samollow1973; Grønkjaer & Sand, Reference Grønkjaer and Sand2003), and is either large (Scherer et al., Reference Scherer, Helling, Clarke and Hausmann2001) or small (Takabayashi & Ohmura-Iwasaki, Reference Takabayashi and Ohmura-Iwasaki2003). Functionally, the increase or decrease in the asymmetry of the otolith mass can negatively affect other activities essential to the life of the fish, especially the sense of hearing, balance and linear acceleration (Popper & Lue, Reference Popper and Lu2000; Panfili et al., Reference Panfili, Durand, Diop, Gourene and Simier2005; Yedier et al., Reference Yedier, Bostancı, Kontaş, Kurucu and Polat2018).
Geographically, the Tunisian shores are a border area between the basins of the eastern and western Mediterranean and contain many coastal lagoons. The environmental features of these coastal lagoons, including shallow water, strong seasonal temperature gradient, salinity, wind stress and tidal effects, lead to great variability in the short spatial and temporal scales of the communities (Panigrahi et al., Reference Panigrahi, Achraya, Panigrahi, Nayak, Banarjee and Sarkar2007). The Bizerte and Kelibia lagoons are two of these coastal lagoons located in north-east Tunisia. Previous ecological studies on these two lagoons have shown that these lagoons differ from each other in their environmental characteristics, particularly in temperature, salinity and currents (Béjaoui et al., Reference Béjaoui, Harzallah, Moussa, Chapelle and Solidoro2008, Reference Béjaoui, Ferjani, Zaaboub, Chapelle and Moussa2010, Reference Béjaoui, Ben Ismail, Othmani, Ben Abdallah-Ben Hadj Hamida, Chevalier, Feki-Sahnoun, Harzallah, Ben Hadj Hamida, Bouaziz, Dahech, Diaz, Tounsi, Sammari, Pagano and Bel Hassen2019; Alves Martins et al., Reference Alves Martins, Zaaboub, Aleya, Frontalini, Pereira, Miranda, Mane, Rocha, Laut and El Bour2015; Jamila et al., Reference Jamila, Mouldi and Moncef2016; Kaouèche et al., Reference Kaouèche, Bahri-SfarI, Hammami and Ben Hassine2017; Zaafrane et al., Reference Zaafrane, Maatouk, Akrout, Trabelsi and Drira2019). Besides, the Bizerte lagoon is subjected to various anthropogenic pressures that include urbanization, industrial activities, naval and commercial shipping harbours, as well as contamination with chemicals and heavy metals (Barhoumi, Reference Barhoumi2014). The environmental changes in the two lagoons produce variations in the phenology of fish that allows adaptation to environmental change by adjusting their physiology and behaviour to the effects of environmental variation, leading to changes in morphology, reproduction and survival (Stearns, Reference Stearns1983; Meyer, Reference Meyer1987).
In the context of the influence of environmental factors on the shape of the otolith, several authors have suggested that environmental factors, such as water temperature, salinity, food availability, depth, and substrate type are the main factors that are likely to be responsible for the differences in otolith shape between conspecific individuals (Begg & Brown, Reference Begg and Brown2000; Torres et al., Reference Torres, Lombarte and Morales-Nin2000; Cardinale et al., Reference Cardinale, Doering-Arjes, Kastowsky and Mosegaard2004; Gagliano & McCormick, Reference Gagliano and McCormick2004; Mérigot et al., Reference Mérigot, Letourneur and Lecomte-Finger2007; Hüssy, Reference Hüssy2008; Morat et al., Reference Morat, Letourneur, Nérini, Banaru and Batjakas2012). In Tunisian waters, recent investigations have described that the otolith shape is likely correlated with the variation in environmental conditions (Trojette et al., Reference Trojette, Fatnassi, Ben Alaya, Mahouachi, Chalh, Quignard and Trabelsi2014, Reference Trojette, Ben Faleh, Fatnassi, Marsaoui, Mahouachi, Chalh, Quignard and Trabelsi2015; Rebaya et al., Reference Rebaya, Ben Faleh, Allaya, Khedher, Marsaoui, Chalh, Quignard and Trabelsi2016, Reference Rebaya, Ben Faleh, Allaya, Kheder, Trojette, Marsaoui, Fatnassi, Chalh, Quignard and Trabelsi2017; Fatnassi et al., Reference Fatnassi, Kheder, Trojette, Mahouachi, Chalh, Quignard and Trabelsi2017; Khedher et al., Reference Khedher, Ben Faleh, Fatnassi, Rebaya, Chalh, Quignard and Trabelsi2017; Khemiri et al., Reference Khemiri, Gaamour, Ben Abdallah and Fezzani2018; Mejri et al., Reference Mejri, Trojette, Allaya, Ben Faleh, Jmil, Chalh, Quignard and Trabelsi2018, Reference Mejri, Trojette, Jmil, Ben Faleh, Chalh, Quignard and Trabelsi2020; Ben Mohamed et al., Reference Ben Mohamed, Mejri, Ben Faleh, Allaya, Jmil, Rebaya, Chalh, Quignard and Trabelsi2019; Jmil et al., Reference Jmil, Ben Faleh, Rebaya, Allaya, Ben Mohamed, Trojette, Chalh, Quignard and Trabelsi2019).
Despite these studies, the variability of the otolith shape and size in B. boops is still poorly understood in Tunisian waters. Therefore, the present study was conducted to determine for the first time (1) the variation in otolith shape, length, width and area within and between populations of the Bizerte and Kelibia marine stations located in north-east Tunisia and (2) to assess the relationship between the saccular otolith mass asymmetry (OMA) and the total fish length (TL).
Materials and methods
Study area
The Bizerte (37°18′N 09°35′E) and Kelibia (36°83′N 11°11′E) stations are located in the Bizerte (37°11′20.4′′N 9°51′16.2′′E) and Kelibia (36°51′0′′N 11°6′0′′E) lagoons situated in north-east Tunisia. In the Bizerte lagoon, the salinity ranged from 33–38‰ and the water temperature from 11.18–26.12°C (Dridi et al., Reference Dridi, Romdhane and Elcafsi2007), however, Béjaoui et al. (Reference Béjaoui, Ferjani, Zaaboub, Chapelle and Moussa2010) stated that the gradient salinity of the water ranged from 20–40 psu and the temperature varied between 11.18–26.12°C (Béjaoui et al., Reference Béjaoui, Harzallah, Moussa, Chapelle and Solidoro2008). In addition, Kaouèche et al. (Reference Kaouèche, Bahri-SfarI, Hammami and Ben Hassine2017) reported that the water temperature ranges from 15–16°C and that the salinity is 37.5‰ in the Bizerte lagoon. However, in the Kelibia lagoon, the water temperature ranged from 12.6–22.8°C, and the salinity varied from 35.4‰ in the winter to 37.5‰ in the summer (Boulajfene et al., Reference Boulajfene, Strogyloudi, Lasram, El Mlayah, Vassiliki-Angelique and Zouari-Tlig2019).
Sample collection
A total of 254 adult samples of Boops boops were collected in Tunisian seawater from the Bizerte and Kelibia stations in 2019 (Figure 1), with a total length (TL) ranging from 142–188 mm. Samples of each station were classified into three groups, I, II and III, based on TL (Table 1). Samples were caught by gillnets using coastal boats ranging from 5–13 m in length. In the laboratory, a status of sexual maturity that starts with a total length (TL) of ~138–152 mm (Anato & Ktari, Reference Anato and Ktari1983; Khemiri et al., Reference Khemiri, Gaamour, Zylberberg, Meunier and Romdhane2005; Monteiro et al., Reference Monteiro, Bentes, Coelho, Correia, Gonçalves, Lino, Ribeiro and Erzini2006; Bottari et al., Reference Bottari, Micale, Liguori, Rinelli, Busalacchi, Bonfiglio and Ragonese2014) was examined. The TL was measured using an ichthyometer and total weight (TW) was recorded, and the values from the two parameters were rounded to the nearest 0.01 mm and 0.1 g, respectively (Table 1).
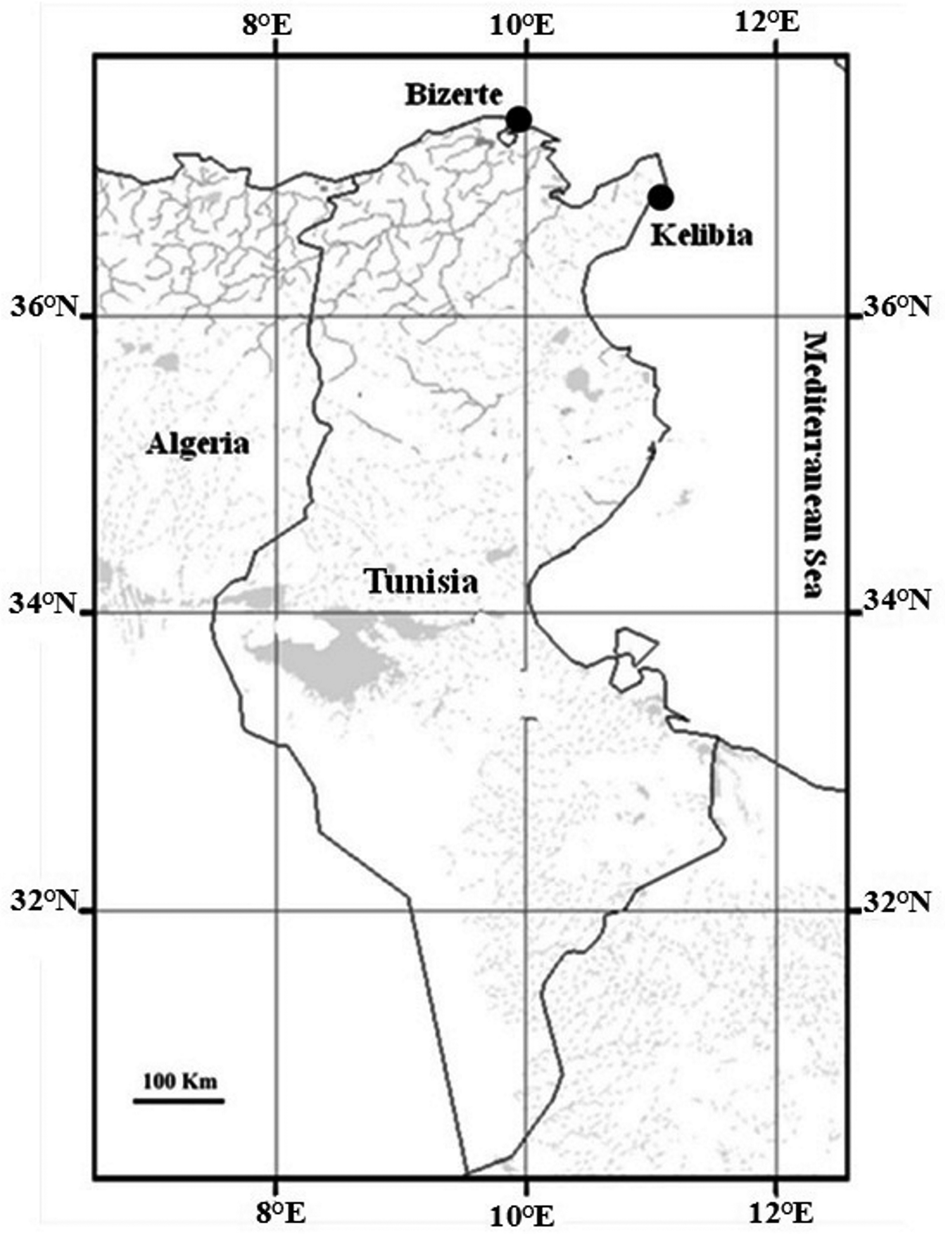
Fig. 1. Boops boops Linnaeus, 1758, sampling sites from which samples were collected from the Bizerte and Kelibia marine stations in Tunisia.
Table 1. Number (N), range of total length (TL, mm) and total weight (TW, g) of Boops boops samples collected from the three groups of the Bizerte and Kelibia stations

Otolith extraction
Right and left otoliths were removed from all fish samples collected from the two stations, washed with distilled water, stored in Eppendorf tubes, and kept in dry storage for 24 h to eliminate moisture. Subsequently, weights of the right and left otoliths were taken using an electronic balance with an accuracy of 0.0001 g.
Otolith shape analysis
Otoliths were positioned onto a microscope slide with the sulcus directed down and the rostrum pointed in the same direction to minimize distortion errors in the normalization process. Subsequently, they were examined under a dissecting microscope at 40× magnification with a black background and photographed using a digital camera (Samsung HD with a resolution of 16 megapixels). The images of otoliths were processed by the software Adobe Photoshop CS6, which transforms the original image of the otolith into a binary image. Afterwards, the images of shapes were analysed using the software SHAPE Ver. 1.3 (Iwata & Ukai, Reference Iwata and Ukai2002). The contour shape of each otolith (Figure 2) was evaluated by elliptical Fourier analysis (FDA). The method of elliptical Fourier descriptors (FDs) was used following the procedures suggested by Kuhl & Giardina (Reference Kuhl and Giardina1982), whereby the chain-coding algorithm was used based on the binary contour projection for each otolith and was calculated using SHAPE software. The chain-coder provides the normalized EFDs coefficients through a discrete Fourier transformation (DFT) of the chain-coded contour. The FDs technique describes the outline based on harmonics and generates 20 harmonics for each otolith. Each harmonic consists of four coefficients (A, B, C and D), resulting in 80 coefficients per otolith generated by projecting each point of the outline onto the axes (x) and (y). The higher the number of harmonics, the greater the accuracy of the outline description. Each otolith was normalized for size and orientation by the program, which causes the degeneration of the first three FDs derived from the first harmonic to fixed values A 1 = 1, B 1 = 1 and C 1 = 0. Therefore, each sample was represented by 77 coefficients for the shape analysis. The four Fourier coefficients (A, B, C and D) calculated the Fourier power (FPn), the percentage Fourier power (FP%), and the cumulative percentage of the Fourier power (FPn% cumulative). The relevant formulas were:
 $$\hbox{FP}n = \displaystyle{{A_n^2 + B_n^2 + C_n^2 + D_n^2 } \over 2}$$
where An, Bn, Cn and Dn are the Fourier coefficients.

Fig. 2. Boops boops Linnaeus, 1758, photograph of the right and left otoliths showing the biometric parameters examined: length (Lo), width (Wo) and area (Ao). Scale bar: 1 mm.
Cumulative percentage of Fourier power  $\hbox{PF}\percnt = 100\hbox{P}\hbox{F}_n\cdot &eqbreak;\left({\sum\nolimits_1^n {\hbox{P}\hbox{F}_n} } \right)^{\ndash 1}$
 $$\hbox{P}\hbox{F}_n\percnt = \sum\nolimits_1^n {\hbox{P}\hbox{F}_n\percnt } $$
The power of the cumulative Fourier average was then calculated to fix the number of harmonics. The threshold of 99.99% of the total power was chosen to determine the number of harmonics required (Pothin et al., Reference Pothin, González–Salas, Chabanet and Lecomte–Finiger2006).
Statistical data analysis and variables normalization
The analytical design was designed to detect differences in the contour shape of the otoliths from populations of the two stations through the non-parametric generalized discriminant function analysis (DFA) (Anderson & Robinson, Reference Anderson and Robinson2003). The effect of locations on elliptical Fourier descriptors was first tested by multivariate analysis of variance (MANOVA). After that, all shape variable values were checked for normality; if the values did not follow the normal distribution, a transformation of Box-cox (Box & Cox, Reference Box and Cox1964) was performed. Finally, a Shapiro–Wilks' λ test was applied to test the normal distribution and homogeneity of the variance in the values of the otoliths' shape variables. The DFA was performed with the normalized elliptical Fourier descriptors coefficients (77 coefficients per otolith) to illustrate the similarities and differences between the samples either at the same station and/or at both stations. The goal of the DFA was to investigate the integrity of pre-defined groups of individuals belonging to a particular geographic population by finding linear combinations of descriptors that maximize the Wilks' λ (Ramsay & Silverman, Reference Ramsay and Silverman2005). The Wilks' λ test assesses the performance of the discriminant analyses. This statistic is the ratio between intra-group variance and total variance and provides an objective method for calculating the corrected percentage chance for agreement. The Fisher's (Reference Fisher1936) distance was also calculated to characterize the similarity (symmetry) and variability (asymmetry) between the right and left otoliths and between the right-right (R-R) and left-left (L-L) otoliths from the same side of all fish samples from the two stations. All these statistical analyses were performed using XLSTAT 2010 and Statistica v.12 (StatSoft, Inc., http://www.statsoft.com).
Biometric analysis
Biometric parameters of the otoliths, including length (Lo), width (Wo) and area (Ao) (Figure 2) were determined using ImageJ software. The mean values of the three parameters were analysed using Student's t-test to determine the differences (asymmetry or symmetry) between the right and left otoliths within the population of each station and between the right-right and left-left otoliths between the populations of the two stations. In addition, otoliths from fish samples of each station were classified into three groups, I, II and III, corresponding to the three TL groups, each with a margin of length equal to 12 mm. Afterwards, the fluctuating asymmetry (FA) between the right and left otoliths was calculated for each biometric parameter by applying the following formula given by Palmer (Reference Palmer and Markow1994):
 $$\hbox{FA} = \hbox{mean right otolith - left otolith}$$
The inter-group differences were tested with Student's t-test and represented by described statistical Box plots. The results were fed into Microsoft Excel and processed by XLSTAT 2010 software.
Otolith mass asymmetry
The OMA (X) was calculated according to the following equation: X = (M R−M L)/M, where M R and M L are the otolith masses of the right and left paired otolith organs, and M is the mean mass of the right and left paired otoliths. Theoretically, the X value can vary between −2 to + 2, whereas X = −2 or X = 2 represent the maximal asymmetry; i.e. absence of one otolith. A positive value of X means that the M R is larger than the M L paired otolith mass and a negative sign means the opposite, whereas the X = 0 means the absence of the mass asymmetry; i.e. M R = M L.
The relationship between the right and left otolith mass asymmetry (OMA) and TL was calculated according to the formula given by Yedier et al. (Reference Yedier, Bostancı, Kontaş, Kurucu and Polat2018); X = a.TL + b, where ‘a’ is a constant characterizing the growth rate of the otolith and ‘b’ is a constant for the given locality. The relationship was estimated using linear regression analysis (LRA). The difference between OMA and TL from all groups within each population of the two stations was statistically tested for significance using the Student's t-test. In addition, the absolute value of the species otolith mass asymmetry |X| was calculated as the average individual's values from all populations (Jawad & Sadighzadeh, Reference Jawad and Sadighzadeh2013).
Results
Otolith shape analysis
The Shapiro–Wilks' λ test confirmed that all shape variance values were normally distributed in the three groups of each population with a P-value > 0.05. In addition, the Wilks' λ test values showed that there was an asymmetry between the right and left otoliths, as well as between otoliths of the same right-right and left-left sides between the three groups of the Bizerte and Kelibia populations (P < 0.0001, Table 2). Similarly, the Fisher distance matrix of the shape variance also revealed an apparent asymmetry between the right and left otoliths within the three groups of the Bizerte population (Fisher distance value = 2.27; P < 0.0001). However, on the contrary, clear symmetry was detected between the right and left otoliths within the Kelibia population (Fisher distance value = 1.28, P = 0.07; P > 0.05, Table 3).
Table 2. Wilks' λ test of the otoliths shape variance distance approximation values of Boops boops samples collected from the Bizerte and Kelibia stations

Table 3. Fisher distance values (below diagonal) and P-values (above diagonal) of shape variance between the right and left otoliths of Boops boops samples collected from the Bizerte and Kelibia stations

K, Kelibia; B, Bizerte; R, Right; L, Left.
The barycentre projection showed that the three groups of the two populations were discriminated by the two axes F1 (96.69%) and F2 (3.16%) with a total value of 99.85% (Figure 3). Additionally, the two axes showed two otoliths groups corresponding to the populations of Kelibia and Bizerte. Of these two axes, the F1 placed the population of Kelibia in the positive part and the population of Bizerte in the negative part. However, the F1 axis separated the right and left otoliths within each population.

Fig. 3. Boops boops Linnaeus, 1758, discriminant function analysis (DFA) showing the barycentre projection of the right (R) and left (L) sides of otoliths samples collected from the Bizerte (B) and Kelibia (K) marine stations.
Otolith biometric analysis
Results of Student's t-test of the biometric measurements showed no significant variation in Lo; i.e. there was symmetry, between the right and left otoliths within the three groups of both the Kelibia (P = 0.94; P > 0.05, range 3.28 ± 0.88–3.29 ± 0.93 mm) and Bizerte populations (P = 0.06; P > 0.05, range 2.35 ± 0.62–2.39 ± 0.61 mm) (Figure 4, Table 4). On the other hand, slight differences in Wo were found between the right and left sides within the three groups of both the Kelibia (range from 1.88 ± 0.57 to 1.83 ± 0.58 mm) and Bizerte populations (range from 1.47 ± 0.39 to 1.46 ± 0.39 mm) (Figure 5). Student's t-test showed that these differences were significant (P = 0.01; <0.05); i.e. there was an asymmetry, between the right and left otoliths within the Kelibia population, however, they were not significant (P = 0.09; P > 0.05); i.e. there was symmetry, within the Bizerte population (Table 4). However, the mean values of the right and left Ao ranged from 3.65 ± 1.90 to 3.67 ± 1.92 mm within the groups of the Bizerte population, whereas they varied from 6.86 ± 4.48 to 6.75 ±4.42 mm within those of the Kelibia population (Figure 6). Student's t-test confirmed that these slight differences in Ao between the right and left otoliths were not significant (P = 0.06 and 0.08, respectively, P > 0.05); i.e. there was symmetry, within both the populations of Kelibia and Bizerte (Table 4).
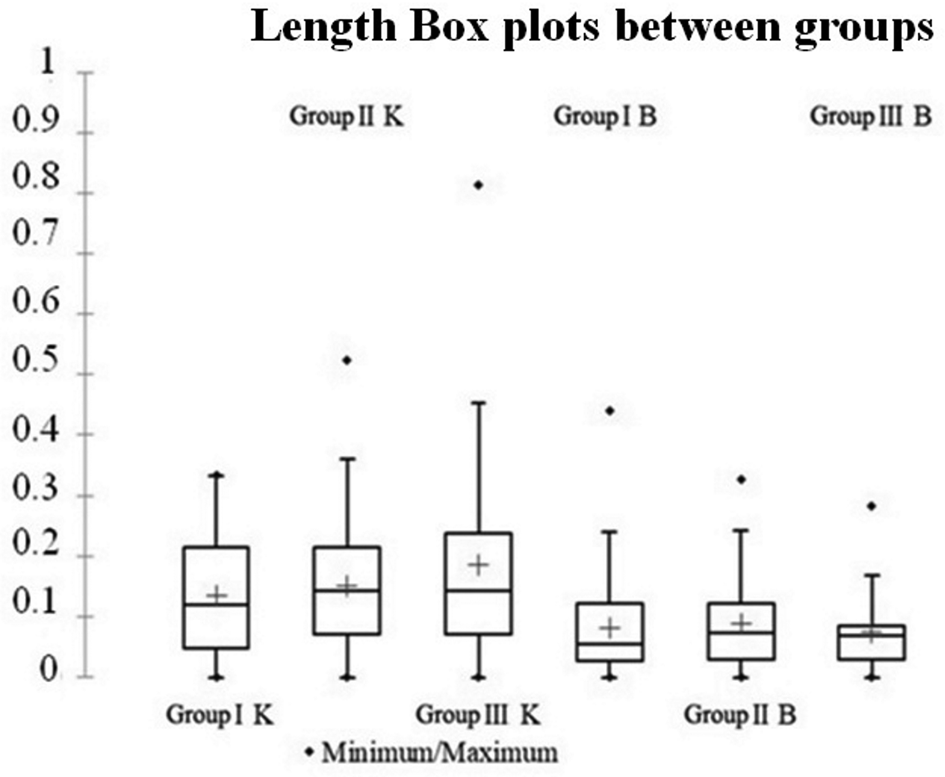
Fig. 4. Boops boops Linnaeus, 1758, box plots of the mean values of length (in mm) of the right (R) and left (L) sides of otoliths sampled from the three groups of the Bizerte (B) and Kelibia (K) marine stations.

Fig. 5. Boops boops Linnaeus, 1758, box plots of the mean values of width (in mm) of the right (R) and left (L) sides of otoliths sampled from the three groups of the Bizerte (B) and Kelibia (K) marine stations.

Fig. 6. Boops boops Linnaeus, 1758, box plots of the mean values of area (in mm) of the right (R) and left (L) sides of Boops boops otoliths sampled from the three groups of the Bizerte (B) and Kelibia (K) marine stations.
Table 4. Student's t-test P-values of the otoliths length (Lo), width (Wo) and area (Ao) of Boops boops samples collected from the Bizerte and Kelibia stations

K, Kelibia; B, Bizerte; R, Right; L, Left.
Otolith biometric and TL analyses
In the three groups of the Bizerte population, the highest level of Lo asymmetry was detected at a TL mean ranged from 165–177 mm, while the lowest was shown at a mean of 178–188 mm. For the Wo, the highest level was found between the three groups at a TL mean between 178 and 188 mm and the lowest was at a mean between 152 and 164 mm. For the Ao, the highest and lowest levels were found between the three groups at TL means between 152 and 164 mm and 178 to 188 mm, respectively (Table 5).
Table 5. Summary of TL range values (mm) and minimum, maximum, and mean values ± standard deviation (SD) of the right and left otolith length (Lo), width (Wo) and area (Ao) of the three groups of Boops boops populations of the Bizerte and Kelibia stations

In the three groups of the Kelibia population, however, the highest and lowest levels of Lo asymmetry were recorded between the three groups at TL; means varied from 168–180 mm and 142–154 mm, respectively, compared with means of 155–167 mm and 142–154 mm, respectively, for the Wo and 142–154 mm and 168–180 mm, respectively, for the Ao (Table 5). Statistical analysis of the results of biometric parameters in relation to the means of TL using Student's t-test showed no significant differences (P > 0.05) between the three groups of the Bizerte and Kelibia populations (Table 6). However, by using box plots, these differences were statistically significant (P < 0.05) (Figures 4–6).
Table 6. Student's t-test and P-values of the right and left otolith length (Lo), width (Wo) and area (Ao) between the three groups of Boops boops populations of the Bizerte and Kelibia stations

Relationship between OMA and TL
The mean values of TL ranged from 152–188 mm between the three groups of the Bizerte population, whereas the mean values of OMA (X) ranged from 0.025 ± 0.0001 in group III to 0.033 ± 0.003 in group I, with an average mean value of 0.029. However, the means of TL varied from 142–180 mm between the three groups of the Kelibia population and the mean value of X differed between 0.012 ± 0.03 in group I to 0.032 ± 0.004 in group II, with an average mean value of 0.025. Thus, there was a decrease in X as the total length increased. In addition, the absolute value of the species otolith mass asymmetry |X| was 0.027 ± 0.008. Moreover, the determination of the relationship between the OMA and TL between the three groups of each population using LRA revealed that there was no relationship between the two parameters in the Bizerte population (the regression equation (Y) ranged from −0.098X + 0.070 in group I to Y = 0.264X – 0.17 in group II and the determination coefficient (R 2) differed from 0.004 in group I to 0.047 in group III, t-test, P > 0.05). Similarly, no relationship was distinguished between the two parameters within the three groups of the Kelibia population (Y differed from −0.098X + 0.035 in group III to 0.071X – 0.04 in group I and R 2 varied from 0.001 in groups I and III to 0.054 in group II, t-test, P > 0.05) (Tables 7 and 8).
Table 7. Summary of the relationship between total length range (TL in mm) and otolith mass asymmetry (OMA). The minimum, maximum and mean ± standard deviation (SD) values, the linear regression analysis (LRA) parameters, and Student's t-test P-values between the left and right otoliths in the three groups of Boops boops populations of the Bizerte and Kelibia stations are given

Table 8. Student's t-test and P-values of the otolith mass asymmetry (OMA) between the three groups of Boops boops populations of the Bizerte and Kelibia stations

Discussion
Elliptical Fourier analysis revealed an asymmetry in the contour shape between the right and left otoliths within the Bizerte population, as well as between the otoliths from the same right-right and left-left sides between the Bizerte and Kelibia populations. However, a symmetry of the shape between the right and left otoliths was detected within the Kelibia population. These results of the contour shape asymmetry are in agreement with those published on the sparid Oblada melanura (Barhoumi et al., 2014), Diplodus annularis (Trojette et al., Reference Trojette, Ben Faleh, Fatnassi, Marsaoui, Mahouachi, Chalh, Quignard and Trabelsi2015) and Pagellus erythrinus (Mejri et al., Reference Mejri, Trojette, Allaya, Ben Faleh, Jmil, Chalh, Quignard and Trabelsi2018, Reference Mejri, Trojette, Jmil, Ben Faleh, Chalh, Quignard and Trabelsi2020), which are cohabiting different habitats in Tunisian waters, as well as on the B. boops sampled from three locations along the Algerian coast (Ider et al., Reference Ider, Ramdane, Mahe, Dufour, Bacha and Amara2017) and from the Gulf of Tunis (Mahé et al., Reference Mahé, Ider, Massaro, Hamed, Jurado-Ruzafa, Goncalves, Anastasopoulou, Jadaud, Mytilineou, Elleboode, Ramdane, Bacha, Amara, De Pontual and Ernande B2019). Similarly, asymmetry of the otolith shape has also been found in other species that live elsewhere outside of Tunisian waters, such as Gadus morhua (Campana & Casselman, Reference Campana and Casselman1993), Clupea harengus (Turan, Reference Turan2000), Lophius piscatorius (Cañás et al., Reference Cañás, Stransky, Schlickeisen, Sampedro and Fariña2012), Haemulon plumieri (Treinen-Crespo et al., Reference Treinen-Crespo, Villegas-Hernández, Guillén-Hernández, Ruiz-Zárate and González-Salas2012), Sicyopterus species (Lord et al., Reference Lord, Morat, Lecomte-Finiger and Keith2012), Xiphias gladius (Mahe et al., Reference Mahe, Evano, Mille and Bourjea2014), Baltic cod (Hüssy et al., Reference Hüssy, Mosegaard, Albertsen, Nielsen, Hemmer-Hansen and Eero2016), Thunnus thynnus (Brophy et al., Reference Brophy, Haynes, Arrizabalaga, Fraile, Fromentin, Garibaldi, Katavic, Tinti, Karakulak, Macías, Busawon, Hanke, Kimoto, Sakai, Deguara, Abid and Santos2016), Albatrossia pectoralis (Rodgveller et al., Reference Rodgveller, Hutchinson, Harris, Vulstek and Guthrie2017), Solea lascaris (Chakour & Elouizgani, Reference Chakour and Elouizgani2018) and Engraulis encrasicolus (Khemiri et al., Reference Khemiri, Gaamour, Ben Abdallah and Fezzani2018).
Additionally, the examination of the biometric dimensions of the otoliths showed that the highest level of asymmetry between the two populations was in Ao followed by Lo and Wo, but a significant asymmetry was found only in the Wo between the right and left otoliths (P = 0.01; <0.05) within the Kelibia population. However, on the contrary, apparent symmetry was detected between the right and left otoliths within the Bizerte population (P = 0.19; P > 0.05). Moreover, no significant differences (P > 0.05) were found in both of the Lo and Ao between the right and left otoliths either within or between the two populations. Indeed, the asymmetry observed here between the right and left otoliths within the Kelibia population has previously been recorded in some fish species for which data are available, which could accommodate the susceptibility of the Wo to immediate fluctuations in the environment. Thus, this significant difference in the Wo value can be used as an actual biomarker of stress in the Kelibia environment. In contrast, the Lo showed the lowest bilateral asymmetry values in both populations examined, which suggests that this character may be less subjected to environmental stress factors, including pollution. Alternatively, this lower bilateral asymmetry value can be explained by the fact that the developmental period of the otolith length may not be consistent with the presence of adverse environmental events (Jawad, Reference Jawad2003). As previously mentioned by Helling et al. (Reference Helling, Hausmann, Clarke and Scherer2003), the apparent effect of bilateral asymmetry in fish otoliths is abnormal swimming activity and interference with correct sound localization, resulting in the inability of the individuals to integrate with the environment in which they live (Lychakov & Rebane, Reference Lychakov and Rebane2005). In addition, in comparison with our results, similar and/or differential results have been obtained by several authors for many fish species. For example, Mejri et al. (Reference Mejri, Trojette, Jmil, Ben Faleh, Chalh, Quignard and Trabelsi2020) examined asymmetry in the otolith shape, length, width and area in P. erythrinus collected from the Gulf of Tunis and found intra- and inter-population asymmetry in these characters, except the surface, and discussed this fluctuating asymmetry in view of the developmental instability induced by genetic and environmental stress. Jawad (Reference Jawad2012) mentioned that the level of asymmetry in the otolith width is the highest among the length and width values of Lutjanus bengalensis collected from the Muscat coast on the sea of Oman, with a trend towards increasing asymmetry in the length and width as the fish increases in length, adding that this asymmetry is attributed to the various pollutants present in the area. Similarly Jawad (Reference Jawad2012) and Jawad et al. (Reference Jawad, Sadighzadeh and Al-Mamary2012a) in Sardinella sindensis and Sillago sihama collected from the Persian Gulf near Bandar Abbas and Jawad et al. (Reference Jawad, Gnohossou and Tossou2020) in Sarotherodon melanotheron and Coptodon guineensis examined from Lake Ahémé and Porto-Novo Lagoon, Bénin, found the same results, except that a trend of increase in the value of asymmetry with fish length has been observed in the otolith width only. However, Al-Busaidi et al. (Reference Al-Busaidi, Jawad and Al-Balushi2017) reported that both the length and width measurements of the otolith estimated from L. ehrenbergii in the Sea of Oman at Muscat City are good indicators for fish length and there is symmetry between the left and right otoliths. In addition, Kontaş et al. (Reference Kontaş, Bostanci, Yedіer, Kurucu and Polat2018) investigated the fluctuating asymmetry of the otolith area, length, perimeter and width in four groups of Merlangius merlangus collected from the Middle Black Sea and declared that the otolith area had the highest asymmetry, while the length had the lowest. Also, they added that there is no significant relationship between the asymmetry values of the four otolith characters and the total length and that the asymmetry in these characters may be a result of the stress from different pollutants in the Black Sea. Moreover, Chakour & Elouizgani (Reference Chakour and Elouizgani2018) recorded significant asymmetry between the otolith length, perimeter and width in three groups of S. lascaris captured in three main harbours of the Moroccan Central Atlantic coast and concluded that the differences between these characters can be related to the environmental specificity and adaptation of each population to its environment. Furthermore, Abu El-Regal et al. (2016) found an asymmetry in the length and width of the otolith in Chlorurus sordidus and Hipposcarus harid examined from Hurghada, Red Sea coast of Egypt, and detected an increase of asymmetry as the fish length (age) increased and attributed the possible cause of the asymmetry in the two species to the presence of pollutants in the area.
As previously mentioned in the Bizerte lagoon, the water temperature ranges from 15–16°C, the salinity is 37.5‰ (Kaouèche et al., Reference Kaouèche, Bahri-SfarI, Hammami and Ben Hassine2017) and it is contaminated by persistent organic (POPs) and metal pollutants, and nutrients and their concentrations are generally high at the surface of the water during the rainy season, which is characterized by the abundance and quality of food (Zrafi-Nouira et al., Reference Zrafi-Nouira, Khedir-Ghenim, Zrafi, Bahri, Cheraeif, Rouabhia and Saidane-Mosbah2008; Barhoumi, Reference Barhoumi2014; Alves Martins et al., Reference Alves Martins, Zaaboub, Aleya, Frontalini, Pereira, Miranda, Mane, Rocha, Laut and El Bour2015; Jamila et al., Reference Jamila, Mouldi and Moncef2016). However, in the Kelibia lagoon, the water temperature ranged from 12.6 to 22.8°C, the salinity varied from 35.4‰ in winter to 37.5‰ in summer, and it is mostly polluted with biological and biochemical pollutants that showed rates of variation over the seasons of the year (Boulajfene et al., Reference Boulajfene, Strogyloudi, Lasram, El Mlayah, Vassiliki-Angelique and Zouari-Tlig2019). Indeed, Fablet et al. (Reference Fablet, Chessel, Carbini, Benzinou and De Pontual2009) declared that temperature is probably the indirect factor most affecting otolith growth. This is because fish species are very sensitive to temperature variations and respond to a change of only 0.03°C (Trojette et al., Reference Trojette, Ben Faleh, Fatnassi, Marsaoui, Mahouachi, Chalh, Quignard and Trabelsi2015). In addition, salinity can directly affect the habitats and indirectly affect the chemical composition and shape of the otoliths (Rebaya et al., Reference Rebaya, Ben Faleh, Allaya, Kheder, Trojette, Marsaoui, Fatnassi, Chalh, Quignard and Trabelsi2017). Moreover, Martin & Wuenschel (Reference Martin and Wuenschel2006) claimed that the variation in the chemical composition of the otolith is probably related to the differences between the responses of the individuals to the influence of the salinity interaction on temperature and the concentration of some common elements, such as Cl, Mg, K, Na and Ca. Therefore, we can conclude that the variation in the otolith shape and size detected here either between the right and left sides or between the same right-right and left-left sides within and between the three groups of the Bizerte and Kelibia populations can be explained in view of the variation in environmental parameters, such as water temperature, salinity, depth and feeding conditions (Cañás et al., Reference Cañás, Stransky, Schlickeisen, Sampedro and Fariña2012). Other factors can also be considered, such as the life-history traits associated with the otolith shape (Mérigot et al., Reference Mérigot, Letourneur and Lecomte-Finger2007) and biological and behavioural characteristics, such as the type of swimming activity (Lord et al., Reference Lord, Morat, Lecomte-Finiger and Keith2012). This effect of environmental factors on the shape of otolith in Tunisian waters has also been previously recognized in P. erythrinus (Mejri et al., Reference Mejri, Trojette, Allaya, Ben Faleh, Jmil, Chalh, Quignard and Trabelsi2018), D. annularis (Trojette et al., Reference Trojette, Ben Faleh, Fatnassi, Marsaoui, Mahouachi, Chalh, Quignard and Trabelsi2015) and O. melanura (Barhoumi et al., Reference Barhoumi, Khoufi, Kalai, Ouerhani, Essayed, Zaier, Jaziri, Ben Meriem and Fehri-Bedoui2018).
Previous studies on the size and morphology of the otoliths have shown that the intra-population variation may reside in inter- and intra-individual and even inter-population variations (Mejri et al., Reference Mejri, Trojette, Allaya, Ben Faleh, Jmil, Chalh, Quignard and Trabelsi2018, Reference Mejri, Trojette, Jmil, Ben Faleh, Chalh, Quignard and Trabelsi2020). Of these variations, Panfili et al. (Reference Panfili, Durand, Diop, Gourene and Simier2005) pointed out that the intra-individual variation represents the fluctuating asymmetry of the otoliths. In the present study, the analysis of the biometric results indicated significant asymmetry in the Wo between the right and left sides within the Kelibia population. Moreover, the Wo showed relatively lower Student's t-test values (0.01) compared with those of Lo (0.94) and Ao (0.08). Thus, we can assume that this asymmetry is most likely due to the vulnerability of the individual who may develop asymmetry in both sides of the otolith under stress conditions (Jawad et al., Reference Jawad, Al-Mamry, Hager, Al-Mamari, Al-Yarubi, Al-Busaidi and Al-Mamary2011). In this regard, Jawad et al. (Reference Jawad, Al-Mamry, Hager, Al-Mamari, Al-Yarubi, Al-Busaidi and Al-Mamary2011) and Mejri et al. (Reference Mejri, Trojette, Jmil, Ben Faleh, Chalh, Quignard and Trabelsi2020) concluded that there is a direct relationship between environmental stress and asymmetry in the morphology of fish species. Indeed, the environmental stress can arise from the pollution of seawater and sediments with heavy metals, organic matter and hydrocarbons (Zrafi-Nouira et al., Reference Zrafi-Nouira, Khedir-Ghenim, Zrafi, Bahri, Cheraeif, Rouabhia and Saidane-Mosbah2008; Khenfech & Boumaiza, Reference Khenfech and Boumaiza2011; El Zrelli et al., Reference El Zrelli, Rabaoui, Ben Alaya, Daghbouj, Castet, Besson, Michel, Bejaoui and Courjault-Radé2018; Boulajfene et al., Reference Boulajfene, Strogyloudi, Lasram, El Mlayah, Vassiliki-Angelique and Zouari-Tlig2019). Thus, the status of pollution has become a usual event for the Kelibia population and may be responsible for the asymmetry detected in the Wo. Moreover, some authors have claimed that genetic factors may be responsible for the asymmetry in both sides of the otolith (Panfili et al., Reference Panfili, Durand, Diop, Gourene and Simier2005), however, these factors cannot be discussed here due to the lack of genetic data on B. boops from Tunisia.
On the other hand, in analysing the relationship between the OMA and the TL within and between the Bizerte and Kelibia populations, it was found that the mean values of the TL ranged from 142–188 mm, while for the OMA (X) they varied between 0.025 ± 0.0001 in group III to 0.033 ± 0.003 in group I, with an average value of 0.029 ± 0.003 between the three groups of the Bizerte population. However, the X varied between 0.012 ± 0.03 in group I and 0.032 ± 0.004, and the average value was 0.025 ± 0.014 between the three groups of the Kelibia population. Besides, the average |X| value was 0.027 ± 0.008. Moreover, although the X decreased as the total length increased, no significant relationship was found between the two parameters within and between the three groups of the Bizerte and Kelibia populations, where the average mean value of R 2 was 0.02 (range = 0.001–0.054) and P was 0.45 (range = 0.080–0.849; P > 0.05). In comparison with previous studies, Lychakov et al. (Reference Lychakov, Rebane, Lombarte, Fuiman and Takabayashi2006) in roundfishes, Lychakov et al. (Reference Lychakov, Rebane, Lombarte, Demestre and Fuiman2008) in flatfishes, Jawad et al. (Reference Jawad, Al-Mamry, Al-Mamary and Al-Hasani2012b) in L. bengalensis, Ambuali et al. (Reference Ambuali, Jawad and AL-Mamry2011) in Rastrelliger kanagurta, Jawad (Reference Jawad2013) in Carangoides caeruleopinnatus, Jawad & Sadighzadeh (Reference Jawad and Sadighzadeh2013) in Liza klunzingeri, Al Balushi et al. (Reference Al Balushi, Jawad and Al Busaidi2017) in L. ehrenbergii, Jawad et al. (Reference Jawad, Mehanna, El-Regal and Ahmed2017) in C. sordidus and H. harid and Jawad et al. (Reference Jawad, Gnohossou and Tossou2020) in S. melanotheron and C. guineensis, reported that, although the average value of the otolith mass increased with the fish length, it did not depend on the fish length and otolith growth rate, and its mean value differed between −0.2 and + 0.2. However, Dkhili et al. (Reference Dkhili, Bouriga, Fatnassi, Ben Mohamed, Quignard and Trabelsi2018) compared the OMA between three pelagic Sardina pilchardus, Trachurus mediterraneus and L. aurata and three benthic Gobius niger, Mullus barbatus and Trachinus draco species and declared that the |X| values are under 0.05 in the six species and a significant difference is found between the pelagic and benthic species (P < 0.05). Also, they added that the OMA varied from −0.0258 to 0.3379 and did not depend on the fish length, and there is no significant difference between sexes. In addition, Yedier et al. (Reference Yedier, Bostancı, Kontaş, Kurucu and Polat2018) described that the X values differed between −0.25483 and +0.41220 in S. solea populations and both the X and |X| are not related to the total length. Interestingly, Lychakov et al. (Reference Lychakov, Rebane, Lombarte, Fuiman and Takabayashi2006) attributed the absence of the relationship between the OMA and TL to (1) the feasible genetic factors, (2) the small size of the samples and (3) the narrow range of the size in the samples. In the present study, the latter two factors played a vital role in the analysis, since the number of the specimens analysed was less than 150 specimens per population, and the range of variation in the size was generally not very close, where the TL ranged from 142–188 mm between the Bizerte and Kelibia populations. Regarding the difference in the values of X between the left and right sides of the otoliths, the present value (range 0.012–0.033) falls between −0.2 and +0.2 described by those previously mentioned authors, but the current mean values were less than those reported by Lychakov et al. (Reference Lychakov, Rebane, Lombarte, Demestre and Fuiman2008) in the flat- and roundfishes (0.070 ± 0.006 and 0.040 ± 0.006, respectively) and Lychakov et al. (Reference Lychakov, Rebane, Lombarte, Fuiman and Takabayashi2006) in a large number of marine species (0.05). According to the mathematical model suggested by Lychakov et al. (Reference Lychakov, Rebane, Lombarte, Demestre and Fuiman2008), the relatively large values of the otolith mass asymmetry can affect acoustic performance and are accountable for the irregular fish swimming behaviour. Additionally, Scherer et al. (Reference Scherer, Helling, Clarke and Hausmann2001) on trout, salmon and Xiphophorus helleri suggested that fish individuals with high OMA always show abnormal swimming compared with those with normal otolith. In the present study, the X decreased as the TL increased, a case that is not concordant with that recorded by Lychakov & Rebane (Reference Lychakov and Rebane2004), as well as those previously mentioned authors. As a rule, Lychakov & Rebane (Reference Lychakov and Rebane2004, Reference Lychakov and Rebane2005) showed in their mathematical model that the acoustic and vestibular functionality of a fish ear can decrease due to the otolith mass asymmetry. Nevertheless, Lychakov et al. (Reference Lychakov, Rebane, Lombarte, Fuiman and Takabayashi2006) pointed out that in the majority of fish species, as well as those studied here, the saccular OMA is very low (|X| < 0.5), regardless of the fish length; this low level of OMA is characteristic of the utricular and lagenar otoliths. On the contrary, Lychakov & Rebane (Reference Lychakov and Rebane2005) showed that only fish with the largest otoliths and |X| > 0.2, in contrast to the case here, could theoretically have problems with sound processing due to the unsuitability and incongruity of the movement of the two otoliths on both sides of the head. Therefore, most teleost species can avoid functional disability by having an OMA below the critical value. Lychakov & Rebane (Reference Lychakov and Rebane2000, Reference Lychakov and Rebane2004) studied the effect of the OMA on the vestibular function of fish and showed in their mathematical model the response of the ellipsoid-shaped otolith to the action of the force of gravity. Besides, they calculated the difference between the static displacement of the right and left ellipsoid-shaped otoliths and found that it depends on the OMA, and concluded that such a displacement difference can be a cause of the different discharge features of the paired otolithic organs and hence the functional otolith asymmetry.
In conclusion, the results of this investigation contribute to the knowledge of the otolith shape and metric data that are perfect tools in discriminating and detecting the fluctuating asymmetry between the right and left otoliths in the B. boops populations. The asymmetry detected here in the otolith shape and width can be related to environmental factors, such as water temperature, salinity, depth, feeding conditions and pollutants. Also, no relationship was found here between the OMA and the TL, a result that can be explained by the narrow range of variation in the size of the B. boops samples analysed. Despite this study, future studies including the examination of other shape indices, such as the shape factor, circularity, ellipticity and rectangularity, as well as the microchemical and genetic analyses, are required to understand better the origin of the fluctuating asymmetry between the otolith pairs of B. boops in Tunisia.
Acknowledgements
The authors are grateful to all the people and fishermen who helped us collect samples from the Bizerte and Kelibia marine stations, where this study was conducted. We also thank the anonymous reviewers who reviewed our paper for their very useful and informative comments.


