


The social need for interaction and belonging is one of the most basic characteristics of the human race, especially when it comes to close relationships (Dibble, Levine, & Park, Reference Dibble, Levine and Park2012). As many other species, humans are known for having strong group bonding, and they may be developed among people with different levels of closeness. The fact is that being either about close friends and family members, or mere acquaintances, the scientific interest in studying the importance of relationships in people’s lives has been present in the academic literature for more than two decades (Berscheid, Snyder, & Omoto, Reference Berscheid, Snyder and Omoto1989).
According to Greenberg (Reference Greenberg, Cassidy and Shaver1999), the human psychological development is strictly connected to the quality of attachment surrounding people’s relationships. These interpersonal relationships have been categorized as friendships or love partnerships, and have been studied by several fields in Psychology, such as theories of social exchange and reinforcement (Rodrigues, Assmar, & Jablonski, Reference Rodrigues, Assmar and Jablonski2013). However, it is important to highlight that each relationship has its own level of closeness, so not all of them are equally close, and this variation may cause significant impact on the range of interpersonal and social phenomena (Dibble et al., Reference Dibble, Levine and Park2012).
In this direction, some authors claim that closeness may or may not be related to the levels of intimacy between the people involved in the relationship. According to Sternberg (Reference Sternberg1988), these two constructs may be connected in loving relationships, for instance, acting like conceptual twins. However, other types of relationships may be evenly close, but not intimate. This could be the case of close friends or co-workers, who may vary in the level of closeness, but without sharing intimacy (Dibble et al., Reference Dibble, Levine and Park2012).
One of the essential aspects for the development of a close relationship is the strength of emotional bond between people, and how much knowledge you have about yourself and about the other person. In other words, Kelley et al. (Reference Kelley, Berscheid, Christensen, Harvey, Huston, Levinger and Peterson1983) define closeness as a degree of mutual dependence of behavior, cognition and affectivity, also considering how much one person affects the other. Moreover, the levels of closeness transcend relationship types, making it possible for people of the same sex, parents and children, friends, lovers or colleagues to experience it, even though this might happen in different ways (Afifi & Schrodt, Reference Afifi and Schrodt2003). In summary, among many construct that may influence in how close people are, such as passion, commitment, and intimacy, the main correlation is that the more interdependence there is between people, the closer they will be (Maxwell, Reference Maxwell1985). Finally, Aron and Aron (Reference Aron, Aron, Fletcher and Fitness1996) postulate that closeness is an approach based on the statement that once individuals have close relationships to others, they will include the other in the self.
Considering the importance of closeness to the study of relationships, personal or social, it is essential to measure this construct properly. Over the years, some interesting measures of closeness have been developed, such as the Relationship Closeness Inventory (RCI; Berscheid et al., Reference Berscheid, Snyder and Omoto1989) and the Inclusion of Other in the Self Scale (IOS; Aron, Aron, & Smollan, Reference Aron, Aron and Smollan1992). The RCI is composed by three subscales designed to measure the kinds of activities that one performs in order to cause impact on others, the frequency of this impact, and its strength. To answer the inventory, participants should keep a relational other in mind, fulfilling a self-report questionnaire with the focus on common activities and behaviors. Even though this is a widely used measure, some of its limitations consist in the lack of content about modern forms of interaction between people, in the outsider’s perspective of its measurement, and in its multidimensionality (Dibble et al., Reference Dibble, Levine and Park2012).
In order to fill these gaps, Aron et al. (Reference Aron, Aron and Smollan1992) developed the IOS, claiming that the previous measure embraced only characteristics of North Americans, and that the time to complete the survey was not appropriate (10–15 minutes). In this direction, the IOS is composed by single items, where participants are required to select Venn-like diagrams representing their relationships with other people, from zero to almost completely overlapped diagrams. For this measure, one of the main criticisms refers to its lack of reliability.
Both of the previously exposed information on closeness inspired the development of a new measure, which intended to gather the essential aspects highlighted by Berscheid et al. (Reference Berscheid, Snyder and Omoto1989) and Aron et al. (Reference Aron, Aron and Smollan1992), and to bring improvements regarding psychometric properties, especially with reference to reliability and unidimensionality. With these aspects in mind, Dibble et al. (Reference Dibble, Levine and Park2012) developed the Unidimensional Relationship Closeness Scale (URCS), a measure applicable to several types of relationships, varying from completely strangers to extremely close people. This measure is described with greater details as it follows.
The unidimensional relationship scale
Being composed by 12 items, the URCS is a Liker-Type self-report scale, and it has the aim to create a general score for closeness, where the score of 1.0 indicates the lack of closeness between people, and the score of 7.0 indicates a strong level of closeness. According to the authors, this measure focuses on specific aspects of relationships that could be essential to the understanding of interdependence, and its interest is emphasized by its items, which were either inspired by previous authors, such as Maxwell (Reference Maxwell1985), and Walker and Thompson (Reference Walker and Thompson1983), or developed by the authors themselves.
For the development of the URCS and to verify its psychometric adequacy, Dibble et al. (Reference Dibble, Levine and Park2012) performed several studies, each one of them with a different type of relationship: romantic couples (192 university students accompanied by their significant others), friends (330 women accompanied by female friends), family (155 university students, keeping a family member in mind), and strangers (170 university students). For all of the different groups, Confirmatory Factor Analyses (CFA) confirmed the clear consistency of a unidimensional fit for the URCS. Furthermore, regarding the reliability of the measure, the Cronbach’s alphas were higher than .90 for all the different samples as well.
In summary, considering the importance of different types of relationships in people’s lives, and adding the essential aspect of closeness, the current study was developed. Therefore, considering that in Brazil there is not yet a measure embracing all of these features, this paper aimed to adapt the Unidimensional Relationship Closeness Scale (URCS) to the Brazilian context, gathering evidences of its psychometric properties. The method and results are described below.
Method
Participants and procedure
The participants were university students from Brazil (n = 468; age, M = 21.2, SD = 5.24; 71.1% female), and 45.5% of them were in a relationship when they answered the questionnaire. They completed a paper and pencil survey composed by the URCS, the Basic Values Survey, and demographic questions, as described below.
Measures
Unidimensional relationship closeness scale (URCS, Dibble et al., Reference Dibble, Levine and Park2012) (Appendix A)
This measure is composed by 12 items in a 7 points Likert scale (ranging from 1 “strongly disagree” to 7 “strongly agree”). In the original study the internal consistence for this measure was satisfactory, and it presented a robust goodness-of-fit index in a confirmatory factor analysis (CFI = .960, RMSEA = .055).
Basic values survey (BVS; Gouveia, Milfont, & Guerra, Reference Gouveia, Milfont and Guerra2014)
The BVS is an 18-item instrument which evaluates six subfunctions of values (interactive, normative, suprapersonal, existence, excitement, and promotion). Each subfunction is composed by three items and they are assessed through a 7 points Likert scale (ranging from 1 “not at all important” to 7 “of the utmost importance”).
Data analysis
Exploratory factor analysis
Aiming at identifying the URCS factor solution, an Exploratory Factor Analysis (EFA) and a Confirmatory Factor Analysis (CFA) were performed. For that, we randomized the full sample and divided it into two equal halves. The EFA was conducted with the first half (n 1 = 234). Factors were extracted thought the Principal Axis Factoring (PAF) and the Hull method (HM) was used as a criterion of factor retention. According to Lorenzo-Seva, Timmerman, and Kiers (Reference Lorenzo-Seva, Timmerman and Kiers2011) the HM is one of the most reliable factor retention methods. To analyze the data with the HM, Lorenzo-Seva and Ferrando (Reference Lorenzo-Seva and Ferrando2013) developed the Factor software, which can be downloaded for free at (http://psico.fcep.urv.es/utilitats/factor/).
Confirmatory factor analysis
Using the Mplus software (version 7.31) a CFA was performed with the second half of the sample (η2 = 234). For that, we used the Robust Maximum Likelihood (Robust-ML) as the extraction method, and the following fit indices: Satorra-Bentler chi-square (Sχ2) significance test, comparative fit index (CFI), Tucker-Lewis Index (TLI), standardized root mean square residual (SRMR), and root mean square error approximation (RMSEA). According to several authors, each one of these fit indices has a cut-off criterion to be considered suitable: χ2 must be non-significant, the CFI and TLI values must be higher than .90 or close to .95, the SRMR values must be .08 or less, and the RMSEA values must lower than .06, being acceptable values lower than .10 for small samples and small degrees of freedom (Brown & Moore, Reference Brown, Moore and Hoyle2012; Kenny, Kaniskan, & McCoach, Reference Kenny, Kaniskan and McCoach2015; Tabachnick & Fidel, Reference Tabachnick and Fidell2013).
Factorial invariance
A Multi-group Confirmatory Factor Analysis was conducted on Mplus (version 7.31) with the same sample used for the CFA in order to confirm if the structure of the URCS is invariable across gender, and between people that are or are not in a romantic relationship. For that, we considered SRMR, RMSEA, and CFI as the goodness-of-fit indices for the unconstrained model. Model fit differences were assessed through ΔSRMR (the values must be smaller than or equal to .03; Chen, Reference Chen2007) and ΔRMSEA (the values must be smaller than or equal to .015; Chen, Reference Chen2007).
Convergent validity
Convergent validity was assessed through Pearson’s correlations between the URCS and the BVS. We expected positive and significant correlations between the general URCS factor and the interactive values.
Test-retest
In order to confirm the temporal validity of the URCS, three different analyses were performed: Spearman’s correlations, paired sample t test and intraclass correlations. For the last analysis, we selected the two-way mixed method and the absolute agreement type.
Results
Exploratory and confirmatory factor analysis
The exploratory factor analysis was performed with the first half of the sample. Initially, the adequacy of performing this analysis was verified, presenting satisfactory results [KMO = .92 and Bartlett, χ2(66) = 1639.5, p < .001]. Then, we used PAF to extract the factors and HM to select the number of common factors. Results clearly showed a one-factor solution (Table 1).
Table 1. Factorial structure of the URCS

To confirm these initial findings a confirmatory factor analysis (Figure 1) was performed using the second half of the sample. As the authors of the original version of the URCS suggest (Dibble et al., Reference Dibble, Levine and Park2012), and in accordance with our previous findings, the one-factor solution was corroborated. The following indicators were obtained for the estimator Robust-ML: Sχ2(54) = 120.31, p < .001, CFI = .937, TLI = .923, SRMR = .041, RMSEA = .072 (IC90% = .055 | .090).

Figure 1. Factorial structure of the URCS scale.
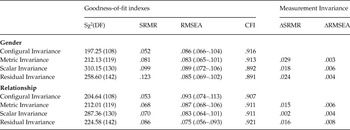
Factorial invariance
Having known that the structure of the URCS presents good fit indices regarding its structure, we performed a Multi-group Confirmatory Factor Analysis to confirm if such structure is invariant across different groups. The results presented satisfactory indices for configural, metric, scalar, and residual invariance (Chen, Reference Chen2007). These results showed a full invariance of the URCS when gender (male and female) and relationship status (yes and no) were compared (Table 2).
Table 2. Fit indexes for the MGCFA for the URCS
Test-retest
To provide evidence of temporal stability we conducted a second application of the survey in a sample of 36 university students (age, M = 20.8, SD = 6.28; 80.6% female). Results showed that the general factor of the URCS from the first time is strongly correlated with the second time, one month later (r spearman = .698, p < .001). We also performed a paired sample t test analysis to assess the differences of means between time 1 and time 2. As expected, the results were not significant [t(35) = –.884, p = .383]. Finally, we assessed the intraclass correlation coefficient (ICC; Two-way mixed) to provide extra evidence for the URCS temporal reliability. Results presented high intraclass correlation (ICC = .903, p < .001).
Convergent validity
To provide convergent validity evidence for the URCS we used the BVS, with special interest in the interactive subfunction, which is related to the regulation of interpersonal relationships (Gouveia, Reference Gouveia2013). For that, we used the entire sample of the present research. Thus, as expected, the URCS presented significant and positive correlations with interactive values for both females and males (Table 3). Our findings also revealed that for the female group, having a close relationship with their partners or families is also related to normative and existence values. These results will be discussed later on.
Table 3. Correlations between URCS and BVS

Note: *p < .05, **p < .01, ***p < .001. Female sample below and Male sample above.
Discussion
The present research aimed to provide evidences of construct validity and internal consistency for the URCS in the Brazilian context. Initially, we performed an Exploratory Factor Analysis (PAF) for the extraction of factors, and the Hull method for the retention of the number of factors. As expected, a single dimension emerged with all items loading satisfactorily in a one-factor solution and presenting a high reliability coefficient, just like in the study of the elaboration of the scale, proposed by Dibble et al. (Reference Dibble, Levine and Park2012).
Although the EFA is an important statistical approach to determine the structure of a measure, as the name of the analysis suggests, it is an exploratory tool used when the researcher does not have a theory that justifies the structure proposed, or empirical findings that provide solid evidence for the factor solution of the scale (Brown, Reference Brown2006). This analysis is also used as an initial step to confirm or refute a factor solution of an existent measure once it is a data driven approach without an initial specification about the number of common factors, or a stipulation about the pattern related to the link between common factors and the observed variables (items; Brown & Moore, Reference Brown, Moore and Hoyle2012).
Considering the initial findings provided by the EFA, we decided to perform a more robust analysis in order to confirm the previous results. Therefore, we used a CFA (Estimator Maximum Likelihood) as the second approach to determine the factor solution of the URCS to the Brazilian context. In the CFA, the researcher specifies in advance the number of factors to test and the pattern of factor loadings (Brown & Moore, Reference Brown, Moore and Hoyle2012). As expected, the one factor solution was corroborated with satisfactory adjustment indicators (Hair, Black, Babin, Anderson, & Tatham, Reference Hair, Black, Babin, Anderson and Tatham2010). It is important to note that no error correlation was required, indicating the quality of the measure.
After corroborating the one-factor structure through EFA and CFA, we provided evidence of factorial invariance. Our findings suggest that the URCS structure has the same meaning when different groups are considered. These results were clearly consistent with the Multi-groups CFA conducted by Dibble et al. (Reference Dibble, Levine and Park2012), providing an acceptable fit to the fully equivalent model across different groups.
Test-retest and convergent validity of the URCS were also provided. For the first analysis, we found a high Spearman’s correlation between the URCS general factor from time 1 and time 2. The Spearman’s correlation is a nonparametric analysis that assesses how well two variables are related without considering the frequency distribution of these variables (Houke & Kossowski, Reference Houke and Kossowski2011). In addition, we showed that there is no difference between the means from time 1 and time 2 (paired sample t test), and both times presented a high intraclass correlation (model two-way mixed). These findings suggest that the measure is trustable across the time.
Regarding the convergent validity, we correlated the URCS with the BVS. We were specifically interested in the link between the URCS and the interactive subfunction, because the values that compose this subfunction are essential to establish, regulate and maintain interpersonal relationships, and represent needs of belonging, love and affiliation (Gouveia, Reference Gouveia2013). Thus, it is expected that people who score high in closeness will be more likely to endorse interactive values, coherently with the social orientation. In fact, people who have high scores on these values give more importance to having social contacts (Gouveia, Milfont, Vione, & Santos, Reference Gouveia, Milfont, Vione and Santos2015). For instance, individuals who score high on interactive values present more intentions to constitute family (Milfont, Gouveia, & Costa, Reference Milfont, Gouveia and Costa2006). In our findings, the link between these two variables was significant, attesting the convergent validity of the URCS.
A curious result was found in the link between the normative and existence subfunctions and the URCS in the female sample. For these two subfunctions, results were positive and significant. These outcomes suggest that differences of gender could play a relevant role in the matter of human relationship intimacy. As Brazil is a country with high gender inequality (United Nations Developed Program, 2009), the male dominance can influence the females to live a relationship in a submissive way, as the man is considered the provider (justifying the existence correlation) and chief of the family to whom the woman must obey (justifying the normative correlation, for more information about human values, see Gouveia et al., Reference Gouveia, Milfont and Guerra2014). Nevertheless, these results must be better explored in future studies, considering a bigger sample and more robust analysis. In sum, taking into account all the procedures performed in this research, we conclude that the URCS has been shown to be psychometrically adequate to be used in the Brazilian context.
Appendix A
Escala Unidimensional de Proximidade no Relacionamento – versão brasileira.
Instrução. As questões a seguir referem-se a seu relacionamento com seu parceiro romântico [caso não tenha, considere um amigo próximo ou familiar]. Por favor, pense sobre o seu relacionamento com seu parceiro romântico ao pontuar às afirmações com a escala de respostas a seguir.

01. ____ Eu tenho um relacionamento próximo com meu/minha parceiro(a).
02. ____ Quando estamos separados, eu sinto muita falta do meu/minha parceiro(a).
03. ____ Meu/Minha parceiro(a) e eu revelamos coisas pessoais importantes um para o outro.
04. ____ Meu/Minha parceiro(a) e eu temos uma forte ligação.
05. ____ Meu/Minha parceiro(a) e eu queremos passar tempo juntos.
06. ____ Eu tenho certeza do meu relacionamento com meu/minha parceiro(a).
07. ____ Meu/Minha parceiro(a) é uma prioridade em minha vida.
08. ____ Meu/Minha parceiro(a) e eu fazemos muitas coisas juntos.
09. ____ Quando eu tenho tempo livre eu escolho gastá-lo com meu/minha parceiro(a).
10. ____ Eu penso muito sobre meu/minha parceiro(a).
11. ____ Meu relacionamento com meu/minha parceiro(a) é importante na minha vida.
12. ____ Eu considero meu/minha parceiro(a) quando tomo decisões importantes.


