

There are many indicators of sediment transport and mobility in all water depths. These indicators are variable depending on the environmental conditions: from coastal areas; the Continental Shelf; tidal flats; and the Continental Margin downslope to the Ocean Basins. In all of these areas, the seabed sediment may be mobile, and this mobility will be exhibited in many different forms. There is a lot of published information on these features going back well over half a century; one such detailed account can be found in Reineck & Singh (Reference Reineck and Singh1973).
In this paper we present an analysis of areas of large sand deposits on the Continental Shelf environment of the North Sea, reporting what has been found and how these features have changed over a five-year period. In these areas, the mobility of the sand deposits is manifested in several forms, including sandbanks, sand waves and small to large-form sand ripples (see Reineck & Singh (Reference Reineck and Singh1973) for definitions of these features). Due to the very strong currents which occur in this region, both the physical size and the migration rates of these bedforms are variable.
Sandbanks can cover huge areas, with their length reaching hundreds of kilometres, and heights of tens of metres (Kenyon et al. Reference Kenyon, Belderson, Stride, Johnson, Nio, Schuttenhelm and Van Weering1981). These sandbanks are often associated with protected marine species, and many are designated as Special Areas of Conservation (SACs) by the JNCC (EC Habitats Directive 92/43/EEC, 1992). Nevertheless, despite their size and mobility, many offshore developments have taken place in such areas, and they pose a significant potential hazard to both permanent and temporary seabed structures.
Of similar interest, in terms of their size and potential impact on planned developments, is the presence of large sand waves. Again, these can consist of large volumes of mobile sand; from our experience of forty years of surveying in the North Sea, sand waves can reach in excess of 15 m in height, and they can persist for tens of kilometres. They often form into sand wave fields, with the sand waves exhibiting many complex shapes.
The rate of migration of these large sand waves has been monitored and measured in many studies. This has involved detailed analysis of grain sizes, current velocity, etc., and has included studies of the relationship between sand wave heights, particle size, water depth and current flow regimes. These measurements have shown that, on a small scale, sand waves can travel at speeds greater than 1 cm/s (Reineck & Singh Reference Reineck and Singh1973). Recent studies on migration rates on a large scale in the southern North Sea, Knaapen (Reference Knaapen2005), showed rates up to 10 m/year, and Van Dijk & Kleinhans (Reference Van Dijk and Kleinhans2005) reported that for coastal areas migration reached up to 20 m/year. The effect of storm surges can also be significant in terms of movement and height of these features, with even greater migration rates recorded (Van Lancker Reference Van Lancker1999).
Several studies have involved monitoring movements of these large sand waves over many years. Also, with the availability of accurate tide gauges, it has been possible in some cases to relate these migration rates and their directions to the observed tidal fluctuations. For example, Nemeth et al. (Reference Nemeth, Hulscher and de Vriend2002) suggested that sand waves always migrate downstream, i.e., in the direction of the steady current, at typical rates of several metres per year. However, Besio et al. (Reference Besio, Blondeaux and Vittori2004) have since shown that sometimes sand waves can migrate upstream; i.e., against the residual currents. This can be explained in terms of the interaction of different tidal constituents; in particular the strength of the residual current with respect to the amplitude of the quarter-diurnal tide constituent and by the phase shift between the semi-diurnal and quarter-diurnal tide constituents.
In terms of planning for the installation of seabed infrastructure for the offshore Oil and Gas and Windfarm industries, there is the potential to do much research and study prior to choosing locations for these sites. However, the current situation is that many developments have gone ahead without sufficiently taking into account the effects of this seabed instability. In fact, in the Round 1 and 2 windfarm developments, many sites were deliberately chosen to be situated on top of large sandbanks, and the resulting problems encountered had to be dealt with after the event.
1. Offshore infrastructure
1.1. Oil and gas
The Southern North Sea gas fields were developed in the 1970s and 1980s and many of the prospects occurred in areas of sandbanks or sand wave fields (Fig. 1). The initial development involved the emplacement of just a single jack-up rig on the seabed for a short period of time – typically a month or so – and as long as features such as steep slopes or an uneven seabed could be avoided, the migration effects of the seabed sediments were not critical. When the field was subsequently developed, a more permanent structure in the form of a platform had to be installed. The fact that only one or two structures were required, and that there was a certain amount of flexibility in choosing the location, meant that sometimes the worst areas could be avoided. Nevertheless, the industry has had to deal with the effects of seabed scouring around platforms sited in these areas and it has been able to do so very well, as evidenced by the lack of damage to infrastructure over this period. Remedial action, such as the use of rock dumping or mattresses, has been very effective in limiting the scouring process. Figure 1 shows a platform that has been in place for several decades, and the effects of scour and also sand transport which have impacted on the platform are evident.
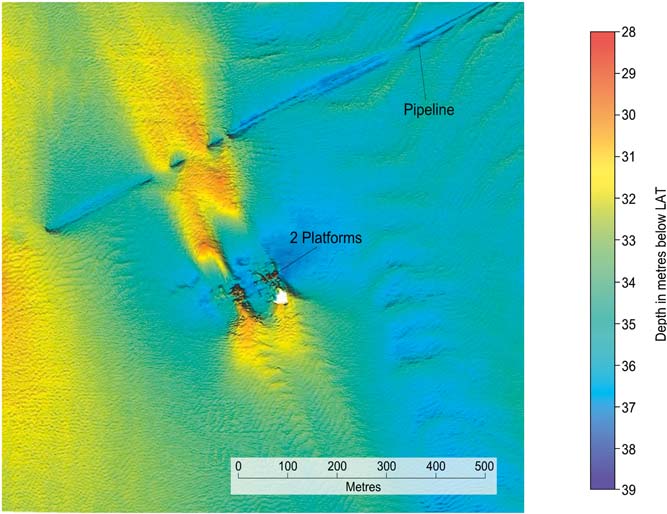
Figure 1 Illustrating scouring around pipeline and sand build up around two existing platforms.
Also in evidence is how this mobile seabed has affected the pipeline which runs NE/SW across the area. Pipelines are relatively robust and can withstand a reasonable amount of such seabed movement and, during the planning stage, particularly large sand wave fields are almost always avoided, as the route of the pipeline to shore can often have a reasonable amount of flexibility. Even so, in this example, the effect sand movement has had is clearly visible, and therefore these pipelines need annual inspections to check for areas of freespan, which could have serious consequences if not monitored and remedied.
1.2. Windfarms
The problems facing the Windfarm industry are in many ways similar to those faced by the Oil and Gas industry decades earlier. But in one way they are significantly different, namely in the number of structures that are needed to be placed on the seabed. Many of the earlier windfarms were quite small, consisting of 20–30 turbines. The present sites being developed have plans for the installation of several hundred in some cases. This poses a different challenge to that of a single piece of infrastructure on the seabed. Also, the means of getting the energy ashore is by electric cables, both in between the turbines and from windfarm to shore. Electric cables are a lot less solid than a 30-inch pipeline.
The following case studies are interesting because of both the location of the windfarm sites and the time interval between successive surveys, enabling understanding of the large scale movements of the surficial sands. Due to client confidentiality, it is not possible to illustrate the geographical location of either of these case studies.
2. Case Study 1
A windfarm development off the east coast of the UK was initially surveyed in 2004. The principal aim of the survey was to provide detailed information on the bathymetry, seabed morphology and obstructions and shallow geology in the survey areas, using industry- standard multi-beam echo sounder (MBES), side scan sonar, boomer and magnetometer equipment. Bathymetry data were collected using a Geoswath MBES system, which operates at a frequency of 250 kHz. Bathymetry data were tidally reduced, processed and gridded using a 1 m bin size.
In 2009, the area was resurveyed in order to investigate a proposed cable route between the landfall and the site of the windfarm, and to assist in meeting the Food and Environment Protection Act (FEPA) licence requirements for environmental monitoring, specifically to assist with detection of Annex 1 habitats, such as those created by the presence of the marine polychaete worm Sabellaria spinulosa. In addition to MBES, side scan sonar, boomer and magnetometer equipment, underwater cameras and grab equipment were used as part of the environmental investigations. The MBES system used for the survey was a hull-mounted Kongsberg Simrad EM3002D, operating at a frequency of 307 kHz, with a quoted depth resolution of 10 cm, and data were gridded using a 2 m bin size.
The windfarm is split into two main areas, each dominated by a sandbank which runs NNE/SSW through the site. Figure 2 shows the bathymetry over the two areas. The survey areas are approximately 10×12 km and 8×5 km, and water depths range from 5 m to 40 m LAT.
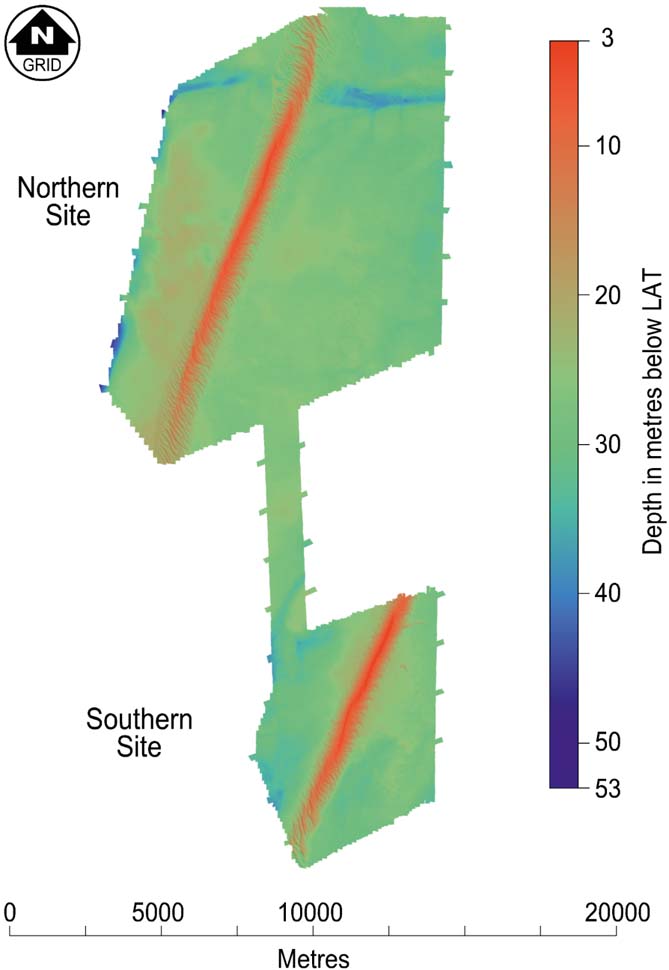
Figure 2 Bathymetric overview of the northern and southern sites.
Away from the sandbanks, which are both covered by a series of sand waves, seabed gradients are generally less than 1° and, of course, ideal for the siting of the turbines. The sandbanks themselves are some 15–20 m thick, and the sand wave heights are typically around 6 m (Fig. 3).

Figure 3 Boomer data example over the sandbank, showing the base of the sandbank and the thickness of sand cover over the sandbank and associated sand waves.
For the southern area, Figure 4 shows a seabed gradient image over the site. This more clearly demonstrates that outside of the sandbank and sand wave field, the seabed is relatively flat. Here there is just a veneer of sand overlying a substrate of firm to hard clay. Of interest are the two somewhat isolated features to the east of the sandbank, and these are discussed separately below.

Figure 4 Seabed gradient over the southern site. Red areas have gradients of >10°.
Because we had access to the 2004 data, we were able to study in detail how the superficial sands of the sandbanks and sand waves had moved during this five-year period. But first, we needed to be confident that any changes in position were real, and not due to errors in the navigation data. Both surveys used standard DGPS networks with expected ∼2 m accuracy. But we were fortunate in that there were two clearly identifiable wrecks on site, so we were able to do a comparison of the positions of these between the two datasets to confirm the precision of the positioning between the two surveys. Figure 5 shows one of these comparisons. We found that the sandbanks themselves had not changed their position; but for the sand waves, the situation was very different.
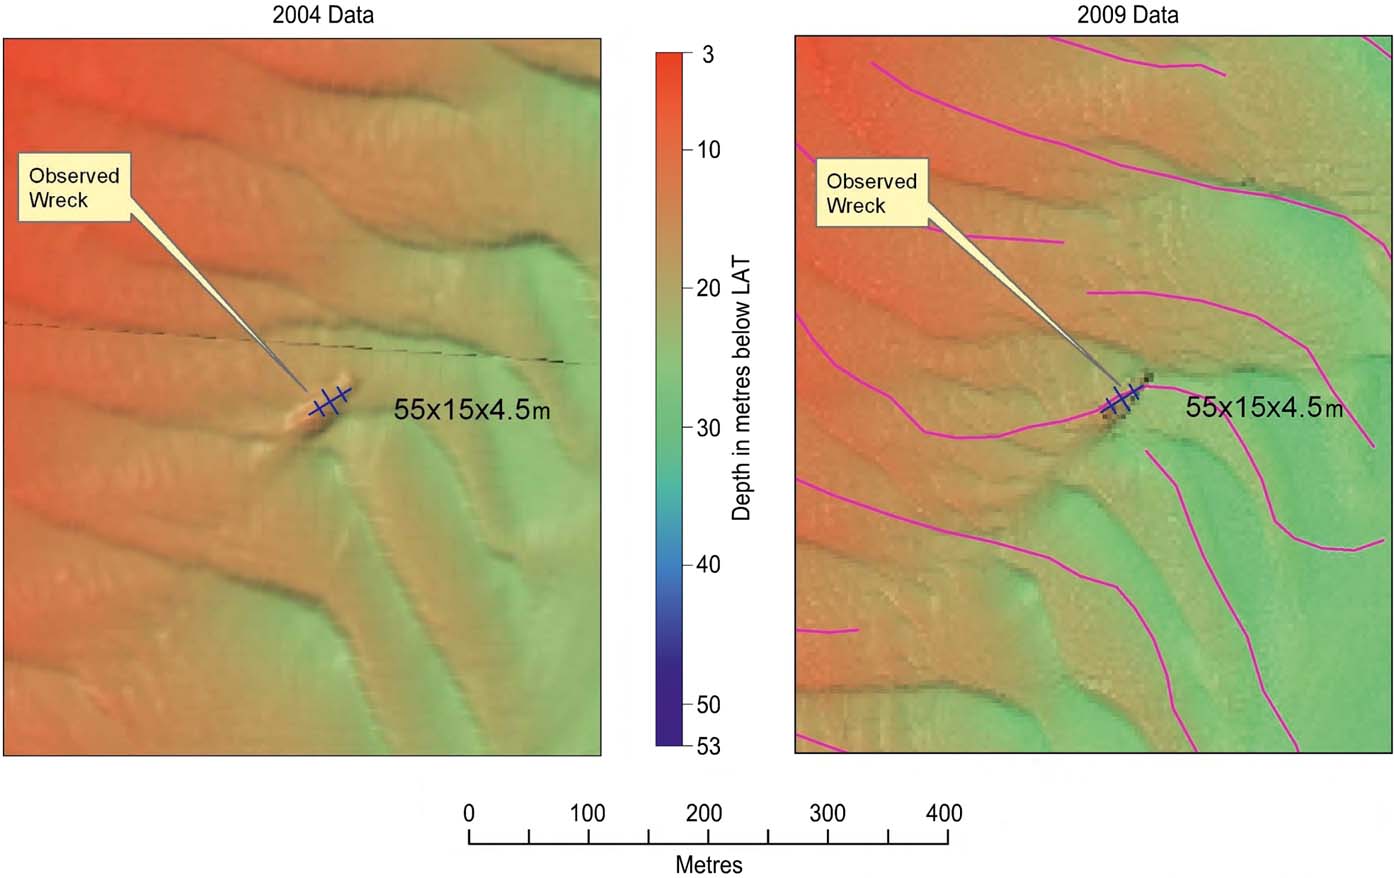
Figure 5 Positioning comparison between the 2004 and 2009 survey datasets, using a known wreck as the reference position. Purple lines on the 2009 data are example positions of some of the sand wave crests on the 2004 data. All crest positions were manually derived.
First, the shapes and orientation of many of these had altered considerably in some cases. Figure 6 shows a comparison illustrating this, where the shape and distribution of the sand waves make them almost unrecognisable over the five-year period.
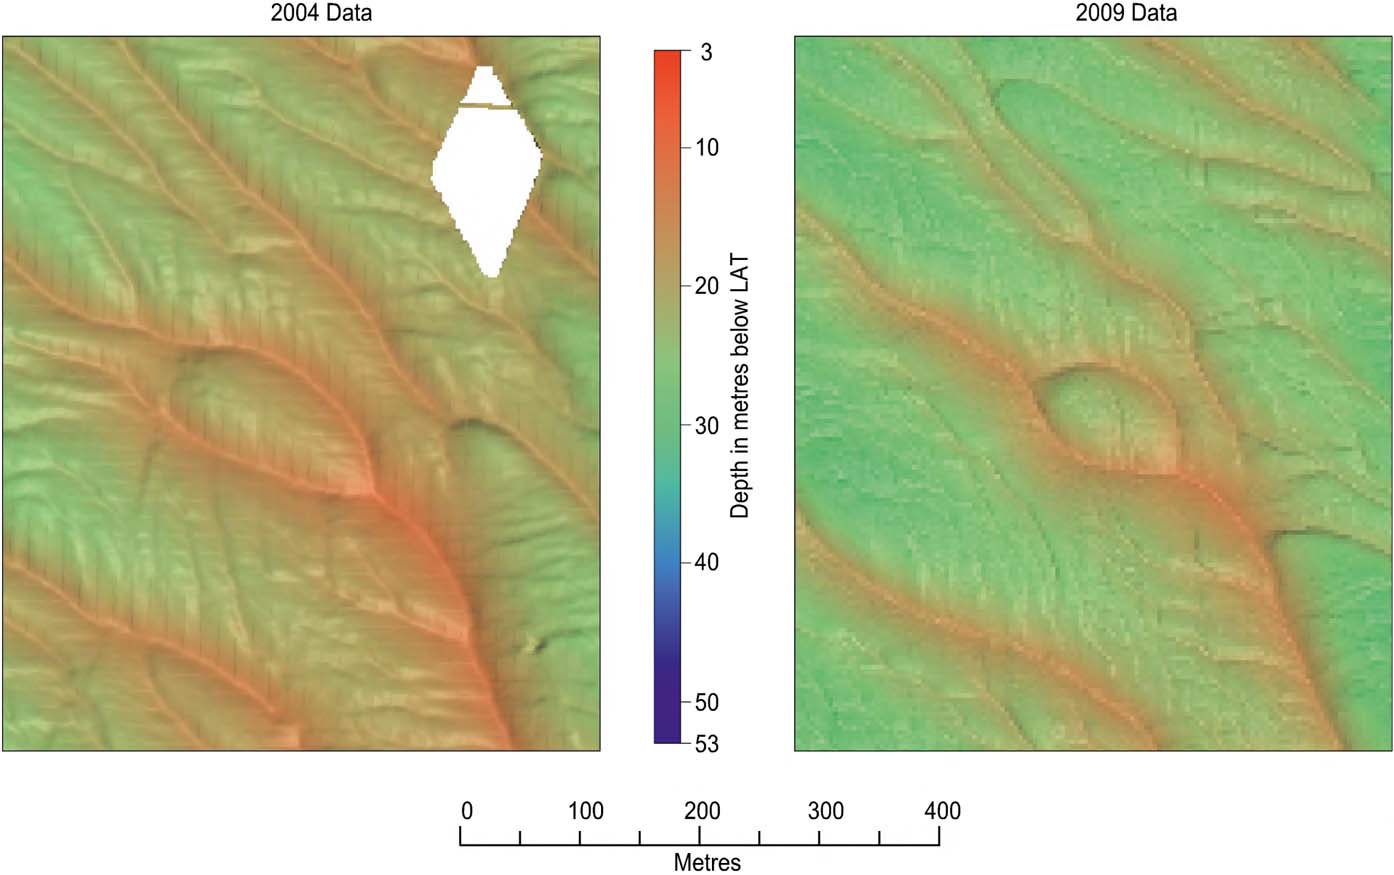
Figure 6 Typical sand wave changes between the two datasets over the five-year period.
Of more significance is the amount and direction of migration of the sand waves that has taken place. Over both of the sites, the sand waves in general have migrated from the NNE to the SSW on the eastern flank of the sandbanks, and from the SSW to the NNE on the western flanks. This suggests that the dominant currents are in a clockwise rotational direction around the sandbanks. Also, the rate of migration has been much greater in the north and central areas of the sandbank, and fairly limited in the extreme southern end (Fig. 7). In the northern and central areas, the average change in crest positions is around 45 m over the five years, with a maximum of 72 m; whereas in the south it is an average of only 20 m.
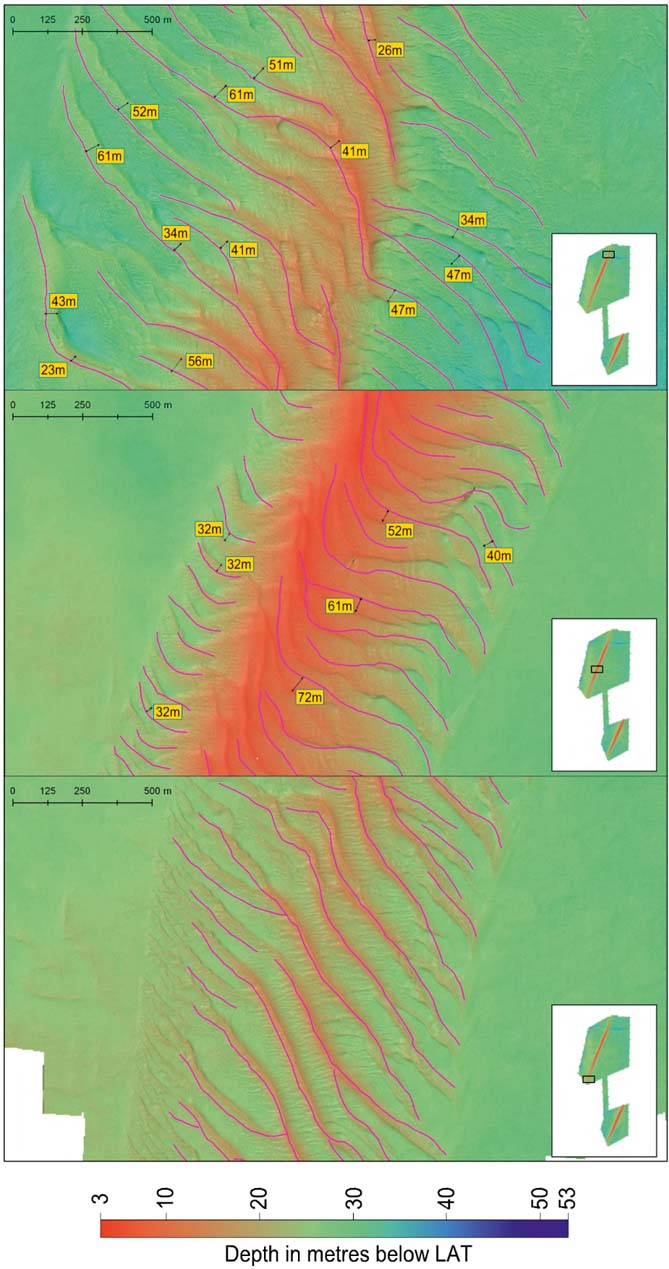
Figure 7 Showing migration of sand waves in the north, centre and south of the northern site. Purple lines are the positions of the sand wave crests on the 2004 data, superimposed on the 2009 data. Crest movements are much greater in the north and centre of the site.
These migration rates of ∼70 m in five years, i.e., 14 m/yr, are consistent with much of the research previously quoted on sand wave migration rates. However, there are two areas of particular interest in the southern site that were referred to earlier. The first of these is shown in Figure 8. This is an elongated sand body some 750 m long and up to 3 m in height, which seems to have spread eastwards from the main sandbank. As can be seen on Figure 8, this whole sand body has migrated to the SSW at a rate of 25 m/yr. An even more striking feature is the isolated sand body (Fig. 9), along with its appearance on the sonar data (Fig. 10). This is clearly a good example of a submarine barchan.
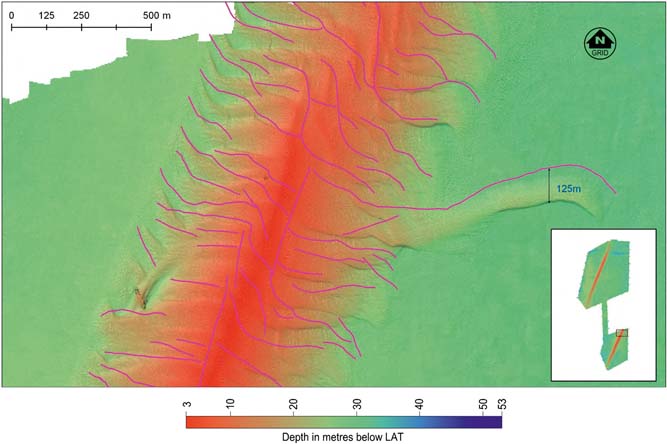
Figure 8 Showing migration of detached sand body of 125 m over the five year period. Purple lines are the positions of the sand wave crests on the 2004 data, superimposed on the 2009 data.
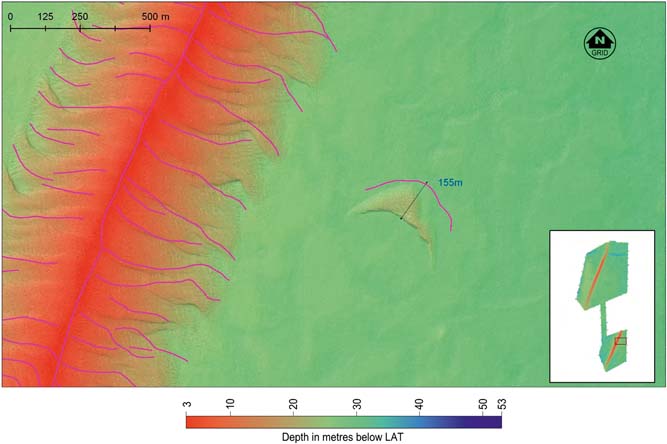
Figure 9 A submarine barchan which has migrated 155 m in five years. Purple lines are the positions of the sand wave crests on the 2004 data, superimposed on the 2009 data.
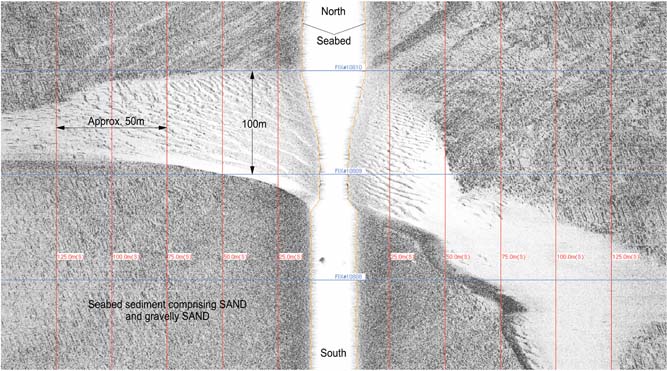
Figure 10 Showing the appearance of the submarine barchan on side scan sonar.
These features are more common on land, and indeed their migration characteristics have been studied for over a hundred years (Beadnell Reference Beadnell1910). Barchans have also been identified on Mars and Titan, and their characteristics studied and compared with those found on Earth (Bourke Reference Bourke2010). But perhaps the most eye-catching of these subaerial barchans is the large barchan in Tunisia at the site of the filming of Star Wars Episode 1. This barchan has migrated at an average rate of ∼15 m/yr between 2004 and 2009 – coincidentally the same period of this study – and is about to encroach on the Mos Espa buildings as depicted in the film (Lorenz et al. Reference Lorenz, Gasmi, Radebaugh, Barnes and Ori2013). They have estimated a sand transport flux of 50 m3/m/yr for this barchan.
Submarine barchans from other localities have also been recorded. Thus Todd (Reference Todd2005) has studied a group of such barchans on the Scotian shelf. In this case it is suggested that they are not relict features, but he had no historical evidence to show migration rates. He was able to make a series of measurements of the typical dimensions, in particular the length L (along-current flow direction), the width W (distance between horns) and the height H of the slip face. The range of the ratio of W to H values for the submarine barchans is shown to be completely different to those of subaerial barchans (Todd Reference Todd2005, fig. 7). When the values of W (380 m) and H (5 m) from our barchan are plotted on this graph they fall close to the range of values derived from the Scotian barchans.
The barchan on this windfarm site is clearly an active feature. It is completely detached from the main sandbank and sand wave field, and has migrated 155 m over five years, equivalent to 31 m/yr.
Based on the dimensions of the barchans, it is possible to estimate the volume of sediment which has moved between successive surveys. This barchan is approximately 100 m long by 380 m wide, with a height of around 5 m. Figure 11 shows the seabed profile over this, which clearly illustrates the detached nature of the feature. We have calculated the volume of sand contained within this yielding a volume of approximately 80,000 m3, which has migrated on average over 30 m in a year. This equates to a sand transport flux, based on theoretical calculations in, for example, Andreotti et al. (Reference Andreotti, Claudin and Douady2002), of the order of 330 m3/m/yr; i.e., some six times those of the ‘Star Wars’ barchan.
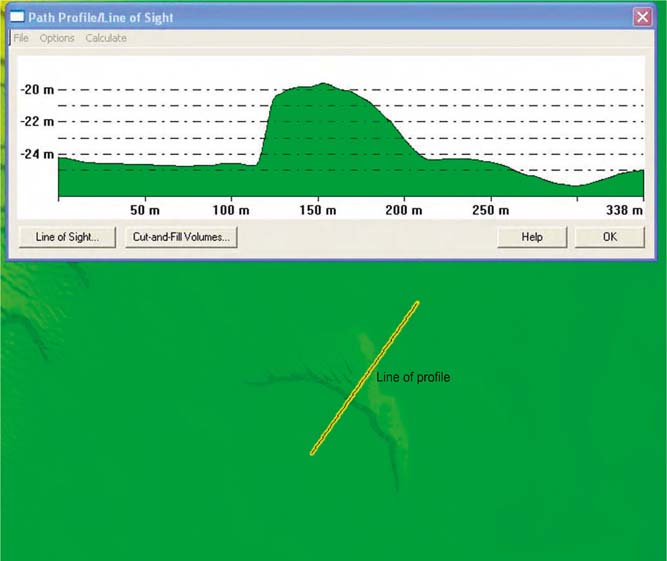
Figure 11 Bathymetric profile showing the general shape of the submarine barchan illustrated in Figure 10.
2.1. Summary
We have shown that, over a five-year period, there has been a consistent migration and re-distribution of the superficial sand in this area. Those sand waves that are superimposed on the sandbanks are controlled by the currents on and around the sandbanks, and have shown a general migration direction to the NNE on the western flank of the sandbank and to the SSW on the eastern flank, suggesting a predominant clockwise current around the sandbanks; the rate of movement is considerably less at the southern end of the sandbanks, and greatest in the central and northern parts. The results also show that the behaviour of two features which have become removed from the main sandbank has been more extreme, and these features need to be taken into account when planning the turbine positions, all of which are located off the main sandbanks.
3. Case Study 2
This is also based on a windfarm development off the east coast of the UK. An initial survey was undertaken in 2007, following on from an earlier environmental survey in 2005, and for this the scope of work called for seabed information with which to identify hazards and constraints for siting wind turbines. The principal aim of the survey was to provide detailed information on the bathymetry, seabed morphology and obstructions in the survey area, using a hull-mounted Kongsberg Simrad EM3002D MBES, operating at a frequency of 307 kHz, an EdgeTech 4200 FS digital side scan sonar and magnetometer equipment.
The area was resurveyed in 2012 with the objective of comparing the pre-construction debris, the morphology and the Sabellaria spinulosa surveys of 2005 and 2007, to identify all hazards or obstructions on the seabed around the wind farm and export cable route, and to compare these results with the pre-construction surveys. The investigation utilised the same MBES, side scan sonar and magnetometer equipment as was used in the earlier survey.
The survey was conducted over an area measuring 9 km × 4.7 km. Water depths within the area range from 14 m to 28 m LAT, and the main feature across the site is a series of E–W trending sand waves. These reach up to 3 m in height and have gradients of up to 20°. This is best illustrated by the seabed gradient over the site (Fig. 12). There are some flat areas away from the sand waves themselves, but the turbines have been emplaced in a fairly regular grid over the whole site, including those regions covered by the sand waves.
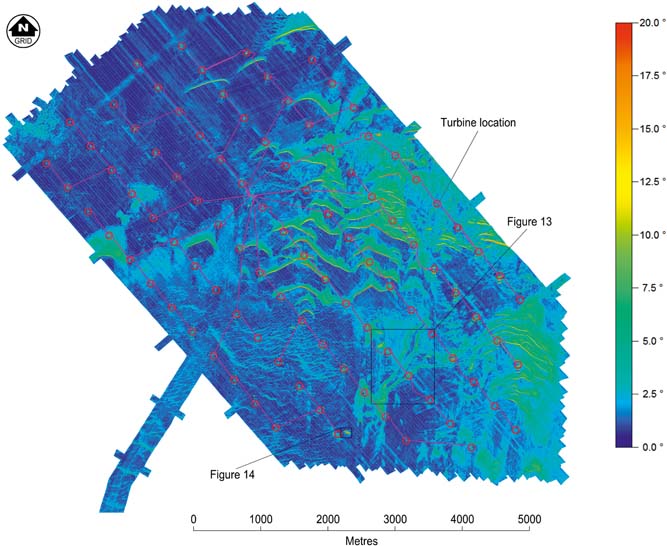
Figure 12 Seabed gradient over the second windfarm site. Red areas have gradients of >20°.
Two other features of note identified during the survey were a NE–SW-trending channel in the centre of the site (Fig. 13), and a visible wreck. The position and shape of the channel was unchanged over the five-year period. The wreck enabled a comparison between the repeat surveys which, like the previous case study, gave confidence in the positioning accuracy between the two survey datasets. Figure 14 shows the sonar image of the wreck, and Figure 15 shows the bathymetric surface difference over the wreck between the surveys.
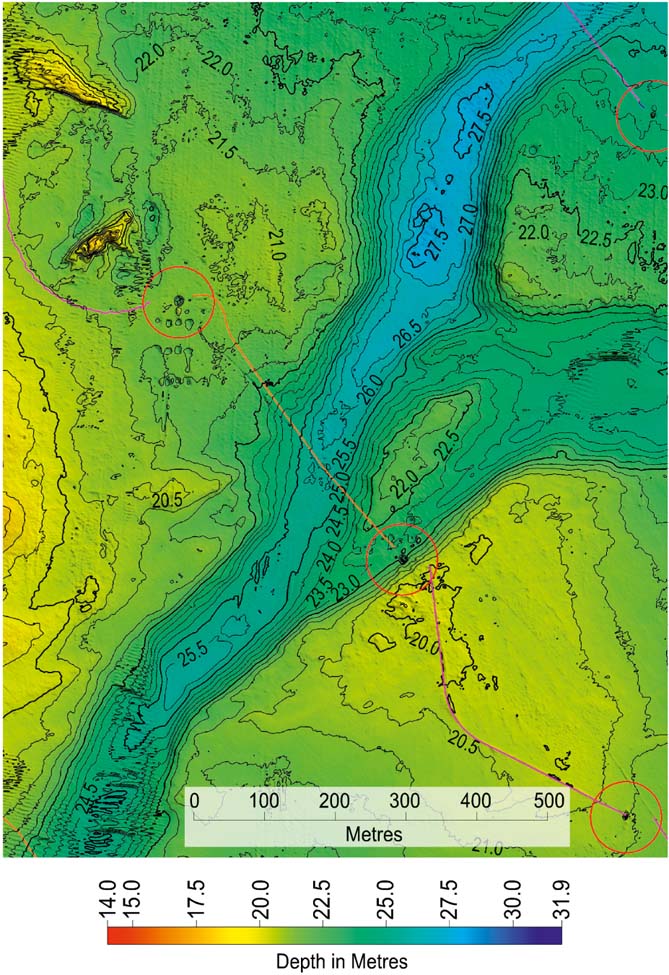
Figure 13 Bathymetry illustrating a channel feature reaching up to 6 m in depth.

Figure 14 Sonar image of the wreck used to confirm positioning between surveys, further illustrated in Figure 15.
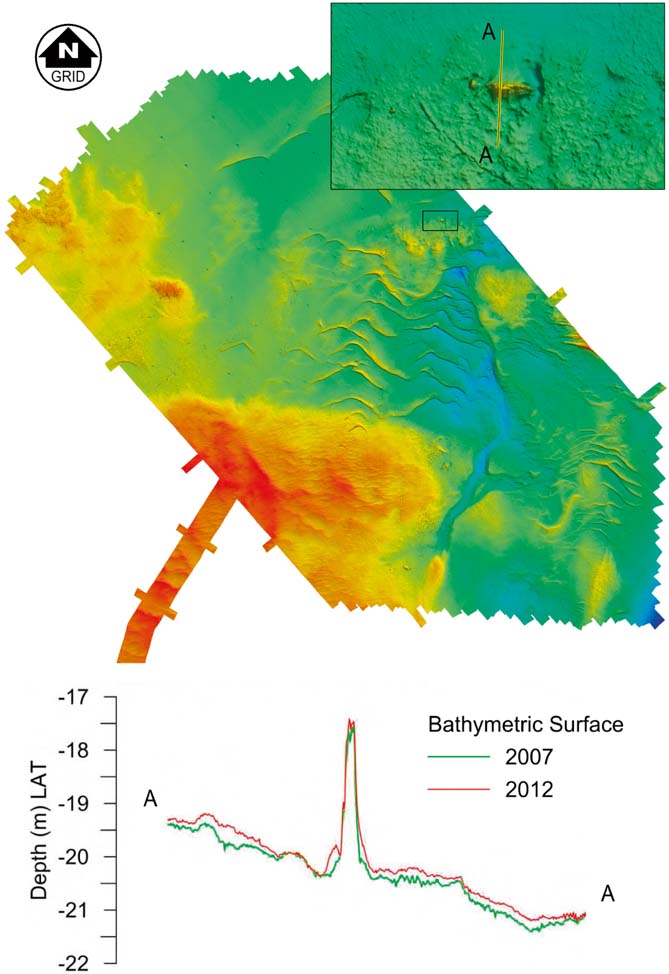
Figure 15 Bathymetric comparison over the wreck over the five-year period. Upper image shows the bathymetry over the site with the location of the wreck transect. Lower image shows the comparison of the two seabed surfaces.
The data from the wreck show that there has been no significant build up or removal of sand around it over the five-year period. The sand waves themselves, however, have changed considerably. Their crests have migrated to the S over an average distance of around 30 m. However, in some cases this reaches up to 50 m, giving a rate of 10 m/year over the five years, which is in general agreement with expected rates of migration as discussed in the introduction. In general, both the heights and shapes of the sand waves have remained similar, showing that it is the whole sand wave field itself which is migrating to the south (Fig. 16).
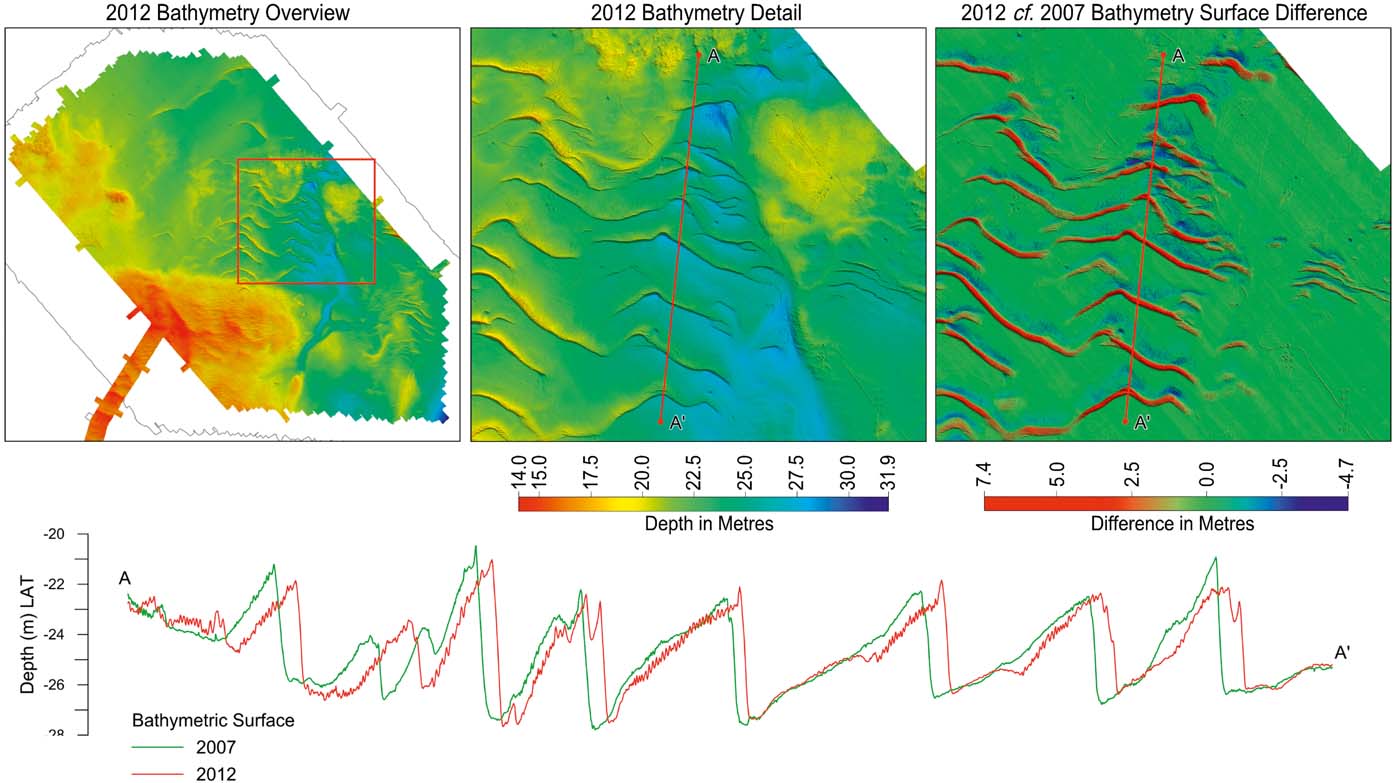
Figure 16 Sand wave movements over the five-year period, showing very little change in the heights of the crests.
However, there are a few exceptions, and Figure 17 shows an example of a sand wave that has increased in height by 1.5 m over the five years, confirming that, although there is a general trend of little change in crest height over the site, some local variations do occur. Several of the smaller sand waves on this site also appear to have the typical barchan shape discussed in Case Study 1. It also appears that these barchans have migrated at a faster rate than the main sand wave field, with typical rates of around 30 m/year. Figure 18 shows a few of these barchans – the illustration is a bathymetric surface difference map, where red shows an increase in sand cover and blue a decrease over the five-year period. The barchan in the centre of the figure has a width (W) of 240 m and a height (H) of 3.0 m, which also plots close to the same line for submarine barchans as the previous example (Fig. 9). The small barchan, labelled A in Figure 18, formed since the initial survey in 2007, and has migrated 180 m over the five-year interval, yielding an average migration rate of 36 m/yr. This appears to be a rare example of the actual formation of a submarine barchan.
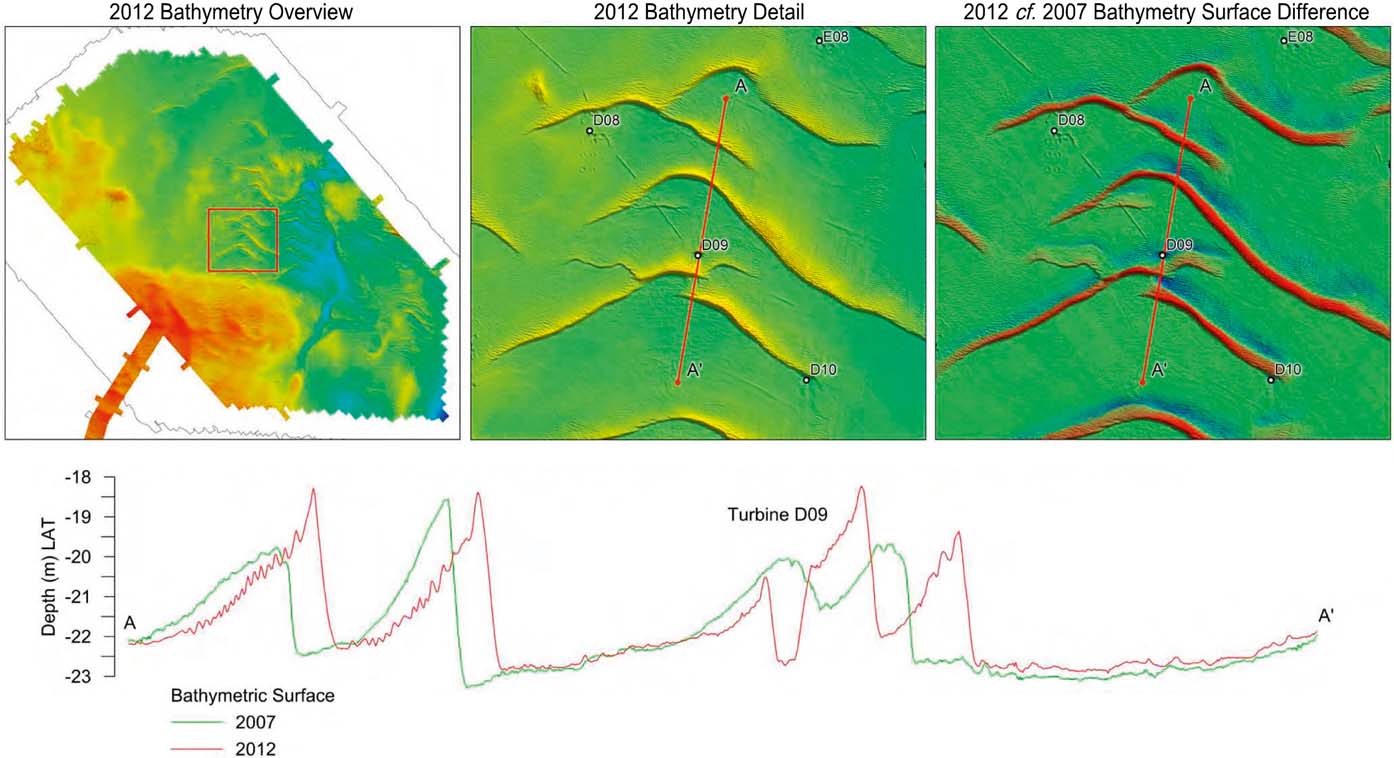
Figure 17 Sand wave movements over the five-year period, showing significant changes in the heights of crests.
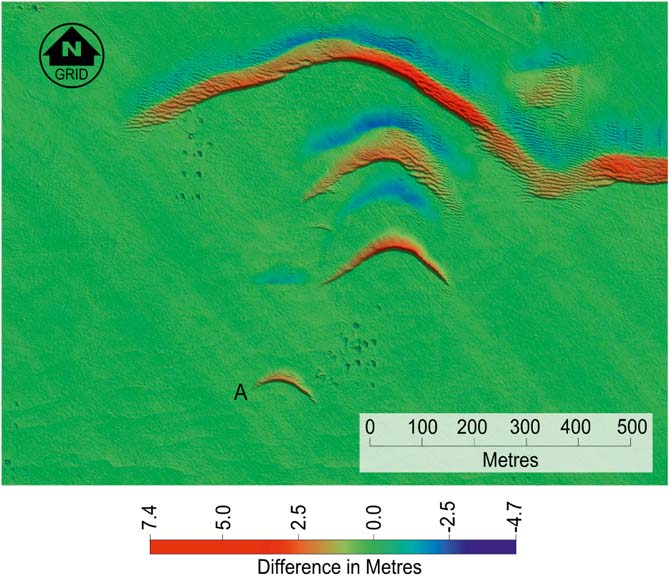
Figure 18 A bathymetric surface difference plot showing the increase (red) and decrease (blue) of sand cover over five years. Note the small barchan, labelled A, which appears to be a rare example of the formation of a submarine barchan.
One specific aspect of the post-construction survey work was to monitor the scour around the turbines. This is on-going work, but the results to date are interesting. The work was carried out using a purpose-built catamaran designed for operation in shallow water and for manoeuvrability. It incorporates a purpose-built moon pool, through which a GeoSwath Plus shallow-water, wide-swathe bathymetry system was deployed, operating at 250 kHz.
The results of the turbine scour investigations indicate that all the monopiles showed signs of scouring around the base. The scour depth ranges between 3.5 m and 4.5 m in a circular shape centred on the base (Fig. 19).
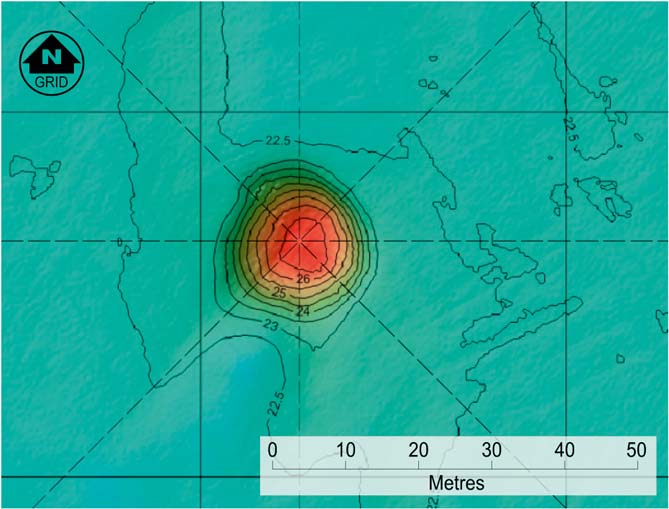
Figure 19 A MBES survey of the area around a wind turbine monopole. Mean seabed depth for the area is 22.5 m, with the scour around the turbine reaching a depth of almost 27 m, indicating a scour pit of around 4.5 m depth. The monopole location is at the intersection of the dashed lines.
However, data from tidal information suggest that the tidal regime has a clockwise rotational component, with the main current direction being NE/SW. In some areas, it can be seen that the rig footprints left behind after the turbines were emplaced do sometimes show a southerly scouring effect, as would be expected from the general movement shown by the sand waves, as well as the information from the tidal data (Fig. 20).
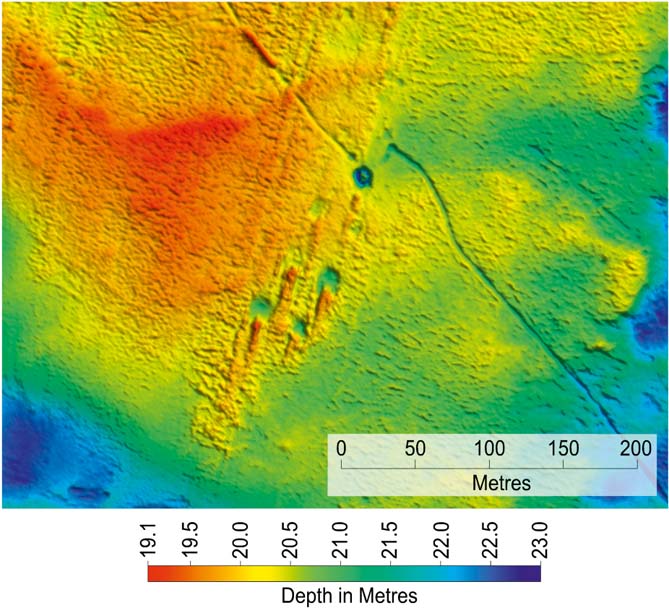
Figure 20 Bathymetric data example showing scouring effect on rig footprints.
Despite this tidal effect, however, it is clear that the scouring around the turbines is very symmetrical, and this is certainly not what would have been expected.
3.1. Summary
This case study shows the results of the successful deployment of a series of monopole turbines over a large area of mobile sand waves, where the average rates of migration are around 6 m/year. The effects of scouring around the base of the turbines is continuously monitored, and initial results suggest that the scouring in the two years since the turbines were emplaced is of the order of 3.5 m to 4.5 m in depth, in a circular distribution around the base of the structure. This does not seem to be influenced by the predominant current at the site which is towards the south, as shown by the migration of the sand waves and other features in the area.
4. Conclusions
There are regions in the southern North Sea where the mass movement of the surficial sands is significant, and this fact needs to be considered when permanent structures are intended to be sited.
For the Oil and Gas industry, experience has been accumulated over several decades, and ways of coping with this mobile seabed have been successfully adopted.
For the Windfarm industry, the problems are similar, but the main differences are the number of seabed structures involved, and the replacing of large pipelines with power cables.
Experience so far suggests that, in some areas, the migration rates of large sand waves can be much higher than thought, with large features migrating up to 155 m in just five years. It has been shown, however, that it is possible to safely and successfully install and commission a large windfarm in an area containing sand waves. The challenge for the future will be the monitoring and controlling of the scour around the turbines, and the effect of the mobile seabed on the turbines and the power cables, both in-field and to shore.
5. Acknowledgements
We would like to thank colleagues for numerous discussions and support, and our clients for permission to present their data.


