


Introduction
In the ionograms of an ionosonde installed at polar latitudes, it is sometimes observed that the trace of the F2 region, instead of being double as usual, is triple. The ray that produces the additional trace is called a z-ray, and this mode of propagation is referred to as ‘z-mode’.
The Autoscala computer program (Scotto & Pezzopane Reference Scotto and Pezzopane2002, Pezzopane & Scotto Reference Pezzopane and Scotto2005) for automatic interpretation of ionograms has been successfully applied to polar ionograms, since it is able to identify a spread F, which is the signature of scattering from irregularities in the ionosphere across the entire radiation angle of the antenna (Scotto & Pezzopane Reference Scotto and Pezzopane2012).
Ionograms with three separate traces have also been successfully identified during this procedure. Ionograms sometimes present a duplicate ordinary trace due to reflection from two markedly different directions. In these cases, the spread in critical frequency indicated a horizontal gradient in the peak electron density (Piggott & Rawer Reference Piggott and Rawer1972). An ionogram in which the duplicate trace is displaced from the critical frequency of the ordinary ray (O-ray) by f B/2, as would be expected of a z-ray, can lead to an uncertain interpretation of the radio propagation conditions. This uncertainty is augmented by the fact that when there is a spatial gradient the difference, f o F2 - f z F2, between the two critical frequencies is only approximately equal to f B/2. Deviations are ∼0.1 MHz, which are accommodated by Autoscala.
Since the z-mode returns to the ground with the polarization of O-mode, a diagnostic for whether an observed third trace is a z-ray is appropriate polarization. Of course this is only possible for ionosondes with receiving antennas that allow measurement of polarization (e.g. crossed dipoles or loops). Otherwise, this ambiguity can be resolved by considering that if a duplicate trace characterizes the O-ray, a corresponding trace should also characterize the extraordinary ray (X-ray), at least in some part of the record (Bowman Reference Bowman1960).
The present study reviews the theory of propagation in a direction quasi-parallel to the Earth’s magnetic field, restoring the trace of the z-mode starting from the profile of the electron density estimated through the ordinary trace. It is shown that the synthesized trace of the z-mode can help to discern cases where this propagation actually occurs, from cases of duplicate ordinary trace due to reflections from two different directions.
When triple splitting of a trace occurs, observation of the ionogram sequence shows that in most cases it is the result of echoes from different directions, rather than a z-mode trace. Z-mode propagation only occurs in a small percentage of cases, in which the corresponding restored trace closely fits the recorded trace.
Theory of the z-ray
According to the originally accepted theory (Eckersley Reference Eckersley1950, Rydbeck Reference Rydbeck1950), at the level where X=ω p 2/ω 2=1 (ω p is the plasma frequency and ω the radio wave frequency), the energy of the O-ray is transferred through coupling phenomena to the X-ray; this energy propagates up to the level at which X=1+Y (Y=ω B /ω, where ω B=e·B/m e is the angular gyrofrequency), where it is reflected. The wave then becomes an extraordinary wave that travels down until it reaches the coupling region (X=1) from above. Since the phase refractive index for the extraordinary wave becomes – i A with A→∞ at the level where X=(1-Y 2)/(1-Y L 2) (with X<1, Y L=Y·cos(θ), where θ is the angle between the wave vector k and B, which for vertical can be assumed θ=90° - I where I is the magnetic inclination angle), the wave at this level can no longer propagate, becoming evanescent. However, before reaching this level, it again passes through the region where X=1 and where the coupling process acts in reverse, thus an ordinary wave is generated, capable of reaching the ground.
Ellis (Reference Ellis1953, Reference Ellis1956) recognized that this coupling mechanism is not able to explain the z-ray, which can sometimes also be observed at mid-latitudes. Due to the amplitude of the θ angle at mid-latitudes the frequency of electron-neutral collisions should be too high to make the coupling mechanism realistic.
According to Ellis (Reference Ellis1953, Reference Ellis1956), the mechanism responsible for z-rays can be understood by considering the well-known outcome of the magneto-ionic theory, which states that if ν is zero, for θ=0, the O-ray is not reflected at the X=0 level, but at a height where X=1+Y. This can be seen from the point of view of divergence in group refractive index of the O-ray μ g-ord. In the absence of collisions, when θ>0, this diverges for X=0, while for θ=0, it diverges when X=1+Y (Shinn & Whale Reference Shinn and Whale1952). This explanation, although fascinating in its simplicity, poses the problem that O-rays propagating in a perfectly longitudinal manner and able to penetrate the level X=1, would be included in a cone of radiation with an infinitesimal angle. Therefore, they would be able to carry virtually null, or extremely modest, energy, thus observation of a z-ray in an ionogram would be inexplicable.
In the following section, it is demonstrated that a small value of ν>0 ensures that the divergence of μ g-ord, which for θ=0 occurs when X=1+Y, also occurs until θ<δ (δ being a small angle). It follows that rays with θ<δ are not reflected at the level X=1, as for vertical incidence, but continue to travel up, reaching a higher level where X=1+Y, and μ g-ord→∞, where they are reflected. In this way, a propagation ‘hole’ is created in the ionosphere, as discovered by Ellis (Reference Ellis1956). In order for this mechanism to be effective, it is necessary that there are irregularities in the distribution of electrons at the level X=1+Y, sufficient to cause a significant backscattering of energy.
The theoretical results taken into consideration in the studies of Ellis (Reference Ellis1953, Reference Ellis1956) were based on the theory of ionospheric reflection developed for multiple rays, using the Fresnel conditions. This theory is based on the study of the phase refractive index (Ratcliffe Reference Ratcliffe1959) and is independent of the study of µ g-ord. A rigorous explanation of the z-ray can be found as a part of the comprehensive theory developed by Mjølhus (Reference Mjølhus1990), who also provided a method for estimating the size of the ‘hole’.
The following section will demonstrate that through a study of μ g-ord it is possible to simplify the discussion and estimate the size of the ‘hole’, drawing conclusions similar to those of Ellis.
The effect of collisions on the group refractive index
According to magneto-ionic theory, the phase refractive index µ f, if there are collisions, can be calculated with the Appleton-Hartree formula (e.g. Ratcliffe Reference Ratcliffe1959), which is expressed in the following form:
 $$[\mu _{\rm f} (\omega ){\minus}j\chi (\omega )]^{2} =1{\minus}{X \over {1{\minus}jZ{\minus}{{Y_{\!\!T} ^{\ \ \ \ 2} } \over {2 \cdot (1{\minus}X{\minus}jZ)}}\,\pm\,\sqrt {{{Y_{\!\!T} ^{\ \ \ \ 4} } \over {4 \cdot (1{\minus}X{\minus}jZ)^{2} }}{\plus}Y_{\!\!L} ^{\ \ \ 2} } }}$$
to highlight the focus on obtaining the real part μ f(ω). Using one of the commercially available computer programs capable of performing symbolic computation, it is possible to derive μ f(ω), obtaining extremely complicated relationships, which are difficult to interpret and not worth reporting. From this expression of μ f(ω) it is possible to obtain μ g through the relationship:
 $$\mu _{\rm g} (\omega )=\mu _{\rm f} (\omega ){\plus}{{\partial \mu _{\rm f} } \over {\partial \omega }},$$
that, for numerical computation, can be expressed with the finite differences:
 $$\mu _{\rm g} (\omega )=\mu _{\rm f} (\omega ){\plus}{{\mu _{\rm f} (\omega {\plus}\Delta \omega ){\minus}\mu _{\rm f} (\omega )} \over {\Delta \omega }}.$$
Using the corresponding phase refractive index, it is possible to derive the group refractive index for both the magneto-ionic components. In this discussion, it is interesting to study the behaviour of μ g-ord(ω). This was calculated and is reported in Fig. 1c & d, showing plots for θ=2° and θ=5°. In these two cases μ g-ord(ω) diverges for X=1. This is in line with what is known for the collisionless case and as experimentally observed: as long as propagation is not perfectly longitudinal, the O-ray is reflected for X=1. Figure 1a & b report μ g-ord(ω) for θ=0.1° and θ=0.5°. In these cases μ g-ord(ω) does not diverge in the vicinity of X=1. This implies that including the effect of collisions results in divergence μ g-ord(ω) failing not only for θ=0 (as it does in the collisionless case) but for any value θ≤0.5°.
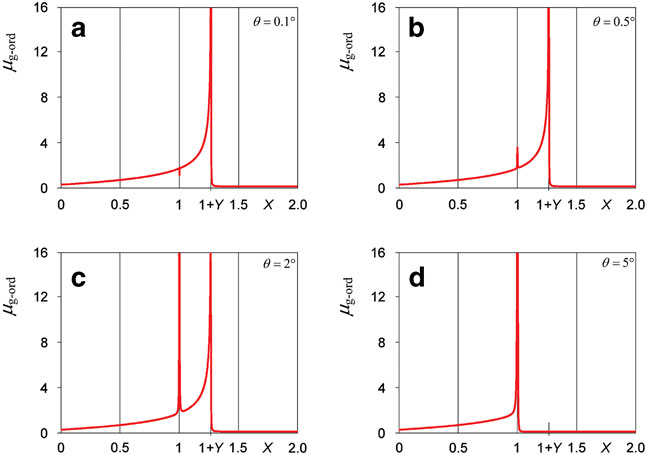
Fig. 1 Behaviours of μ g-ord(X) for various values of the θ angle, for Y=0.26, Z=5·10-4, which is compatible with the frequency of collisions in the F2 region. It does not diverge for X=1, for small values of θ. The boundary condition is θ=0.5°. a. θ=0.1° divergence holds for X=1+Y. b. θ=0.5° divergence holds for X=1+Y, but for X=1 there is a pronounced peak. c. θ=2° the divergence holds for X=1+Y and for X=1. In this case, a wave that travels from the bottom to the top is reflected in X=1 and does not reach the level X=1+Y. d. θ=5° divergence holds for X=1.
This approach has the advantage of simply demonstrating that the propagation of the O-ray over the X=1 level, and its reflection at X=1+Y, occurs for all the rays lying in a cone of radiation of small, but not null, amplitude (θ≤0.5°). The size of this cone, incidentally, is compatible with the experimental findings of Ellis (Reference Ellis1953, Reference Ellis1956).
Application to polar ionograms
In the Autoscala computer program, the synthesized ionogram that best fits the recorded ordinary trace is computed, and the corresponding electron density profile N e(h) is assumed to be the one derived from the ionogram in question. The adaptation of the synthesized trace to the recorded trace implies the use of a recursive procedure (Scotto Reference Scotto2009, Scotto et al. Reference Scotto, Pezzopane and Zolesi2011). During this operation μ g-ord is used, which can also be calculated to account for the collisions between electrons and neutral molecules (Scotto & Settimi Reference Scotto and Settimi2013).
Once N e(h) has been estimated, using the appropriate group refractive index for the O-ray for longitudinal propagation, it is possible to restore the trace of the z-ray. Normally h z F2'<h o F2'<h x F2' (the meaning of the symbols being obvious), which helps to differentiate z-mode traces from those derived from oblique layers. However, a comparison between the restored and recorded traces provides a more efficient method for discrimination. This method is especially useful in the case of fragmented, faint or dispersed traces, as often seen in polar ionograms.
Figure 2 presents a sequence of three ionograms exhibiting a triple splitting of the trace probably due to reflections from different directions. Figure 2a shows a hinted triple trace, where the separation between the second and the third trace (ordering the observed traces starting from the lowest frequency to the highest) does not correspond to f B/2 (where f B=(2π)-1 ω B is the gyrofrequency), which suggests the existence of echoes from a direction other than vertical. In Fig. 2b the separation between the second and third trace reaches about f B/2. In this case, without considering the sequence of ionograms, it would be easy to misinterpret the first trace as due to a z-ray. However, in this interpretation, the blue trace, which represents its reconstruction, would not fit well. Subsequently, the radio propagation conditions evolve towards the ionogram in Fig. 2c, which represents a very perturbed ionosphere with undulations and/or inhomogeneities of various nature giving rise to a spread F.
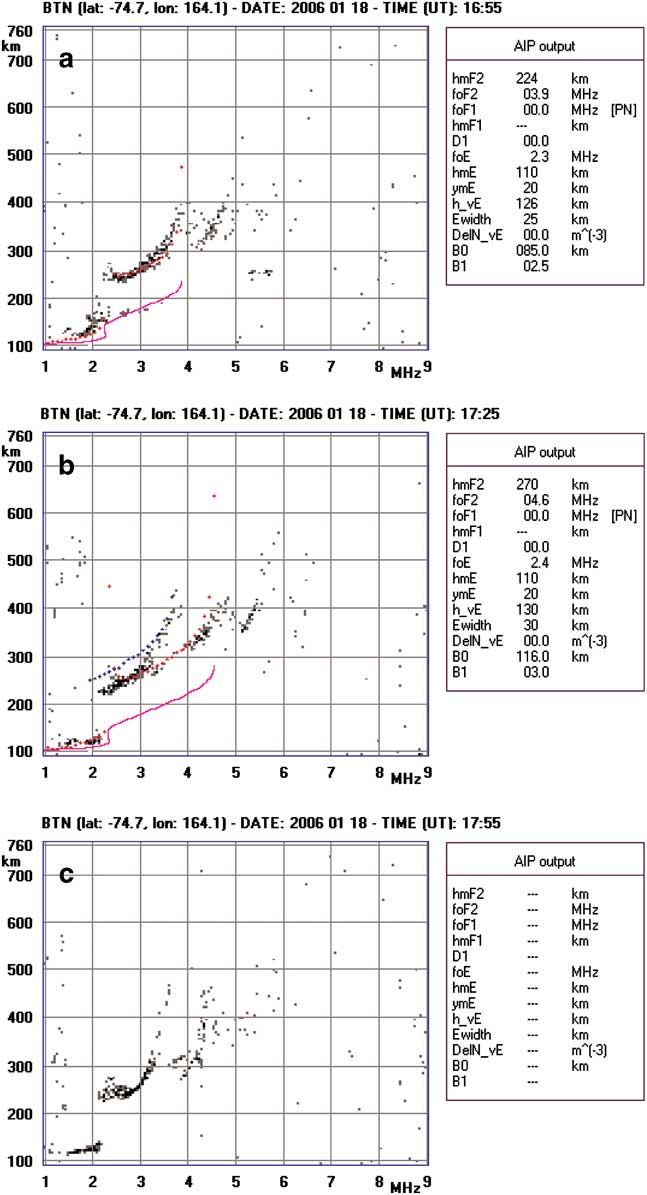
Fig. 2 A series of three ionograms which show a case where the triple splitting of the trace is probably due to reflections from directions other than vertical. a. A triple trace which indicates reflection from a direction other than vertical. The separation between the second and the third trace does not correspond to f B/2. The third trace is, therefore, probably due to reflection of the X-ray from a direction other than vertical. b. If the first trace is wrongly interpreted as due to a z-ray, the blue trace, which is presumed to be its reconstruction, would not fit the respective ionogram trace well. The separation between the second and third traces corresponds to approximately f B/2. However, observing a. and c., the third trace is interpreted as due to a reflection from a direction other than vertical. c. There are numerous reflections from different directions, which give rise to a spread F.
Figure 3 presents a sequence of three ionograms probably exhibiting z-mode propagation conditions. Here, the reconstructed trace of the z-ray fits the recorded trace quite well. In Fig. 3a, a triple trace is visible, indicating reflection from a direction other than vertical. The separation between the second and third traces does not correspond to f B/2. Therefore, the third trace is probably due to reflection from a direction other than vertical. In Fig. 3b, the separation between the first and second traces corresponds to approximately f B/2. Observing the previous ionogram, the critical frequency of the first trace is interpreted as due to a z-ray. In this interpretation, the blue trace of the z-ray reconstruction fits the recorded ionogram trace well. Finally, the situation evolves to the one shown in Fig. 3c, where the effect of numerous reflected signals is observed, coming from different directions, giving rise to a spread F.
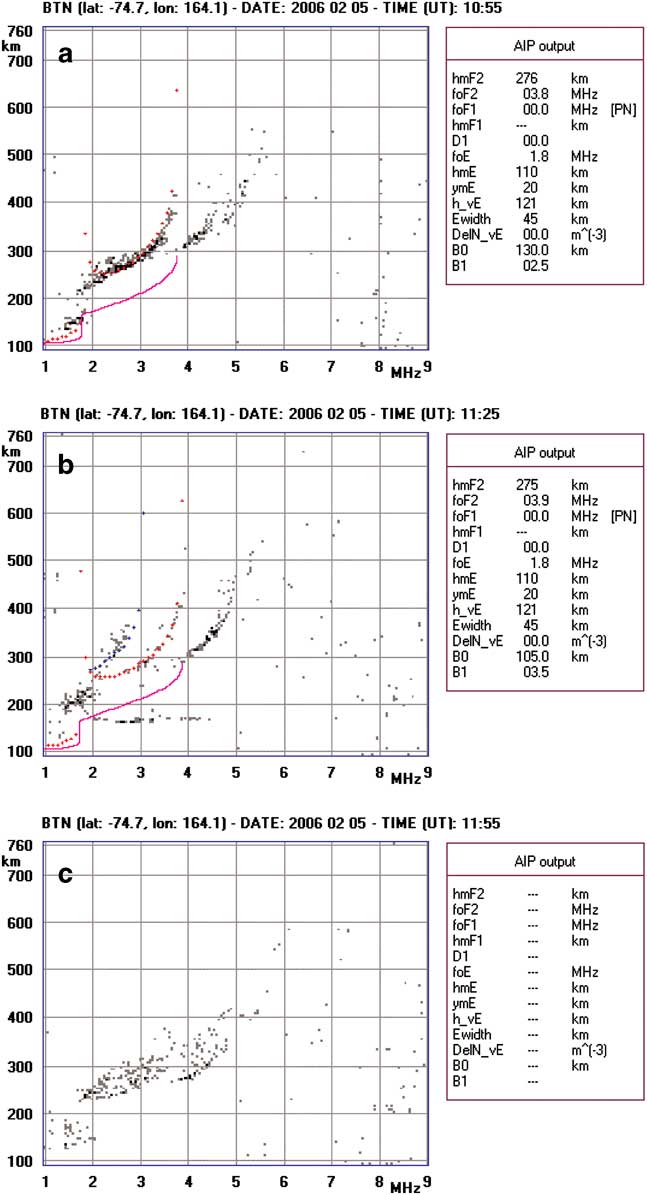
Fig. 3 A series of three ionograms showing an example of when the triple splitting of a trace is probably due to a z-ray. a. There is a faintly hinted triple trace indicating reflection from a direction other than vertical. The separation between the second and the third trace does not correspond to f B/2. The third trace is, therefore, probably due to reflection from a direction other than vertical. b. The separation between the first and second traces corresponds to approximately f B/2. Observing the previous ionogram, the critical frequency of the first trace is interpreted as due to a z-ray. If the first trace is interpreted as due to a z-ray, then the blue trace, which represents the reconstruction, would fit the recorded trace well. c. There are numerous reflections from different directions, which give rise to a spread F.
Conclusions
The problem of distinguishing the different radio propagation conditions that are observed at polar latitudes is particularly complex because here the ionosphere is highly perturbed, with the formation of irregularities of various nature, which often lead to reflections from directions other than vertical. An additional consideration is that even the propagation of a z-ray implies the presence of irregularities or undulations in the iso-electron-density surface. The study presented here leads to some observations regarding the future ability to properly discern the different radio propagation conditions, as follows:
-
i) The theory of a ‘propagation hole’ can be directly confirmed by studying the behaviour of µ g-ord in the presence of collisions. The size of the ‘propagation hole’ is the same as that determined theoretically and verified experimentally.
-
ii) It is possible, using the appropriate refractive index, to perform a reconstruction of a z-ray trace. This algorithm can be implemented in the Autoscala software for automatic interpretation of ionograms.
-
iii) This reconstructed trace can help in discerning cases of triple splitting due to reflection from different directions, from cases where a z-ray is actually observed.
Acknowledgements
This work is in the frame of AUSPICIO (AUtomatic Scaling of Polar Ionograms and Cooperative Ionospheric Observations), an international cooperation project funded by the Italian National Program for Research in Antarctica (PNRA). The author would like to thank the reviewers and editor for their valuable comments.


