


1 Introduction
In many circumstances, individuals make choices by evaluating possible outcomes against a reference outcome. This behavioral tendency is known as reference-dependence (Tversky & Kahneman, Reference Tversky and Kahneman1991). Reference-dependent utility and its implications have been studied in various settings, including technology adoption (Dupas, Reference Dupas2014), demand for housing (Simonsohn & Loewenstein, Reference Simonsohn and Loewenstein2006), labor supply (Bulte et al., Reference Bulte, List and van Soest2020; Crawford & Meng, Reference Crawford and Meng2011), sports (Pope & Schweitzer, Reference Pope and Schweitzer2011), and food choice (Caputo et al., Reference Caputo, Lusk and Nayga2019; Lusk et al., Reference Lusk, Feldkamp and Schroeder2004). The workhorse model of reference-dependent utility, proposed by Kőszegi and Rabin (Reference Kőszegi and Rabin2006), builds on, extends, and generalizes ideas from prospect theory (Tversky & Kahneman, Reference Tversky and Kahneman1991). It captures an individual’s utility as consisting of two components: conventional consumption utility and so-called gain–loss utility. Gain–loss utility emerges as outcomes deviate from a reference point. Loss aversion implies that utility losses from downward deviations are greater than the utility gains from equal-sized positive deviations.
While reference points play a key role in reference dependent utility theory, most of the early empirical work treated these points as “free parameters” (Gneezy et al., Reference Gneezy, Goette, Sprenger and Zimmermann2017). However, reference points are “constructed”, and what determines them has emerged as an important research topic. People may base reference points on current endowments (the status quo), but Tversky and Kahneman (Reference Tversky and Kahneman1991) propose that “there are situations in which gains and losses are coded relative to an expectation or aspiration level that differs from the status quo.” The suggestion that expectations shape reference points was elaborated by Kőszegi and Rabin (Reference Kőszegi and Rabin2006). Work based on observational data struggled to empirically distinguish between the roles of endowments and expectations about ownership, as these concepts tend to correlate.Footnote 1 More recent experimental work on the origins of reference points produces ambiguous results (see below in Sect. 2). This work used “symmetric commodities” of the same (token) value, such as university mugs and pens, that cannot be easily ranked in terms of utility ex-ante (e.g., Banerji & Gupta, Reference Banerji and Gupta2014; Ericson & Fuster, Reference Ericson and Fuster2011; Heffetz & List, Reference Heffetz and List2014).
We implemented a field experiment in Lagos, Nigeria, with consumers visiting a real fish market to study the role of endowments and expectations on stated values (bidding behavior in an auction experiment). Our auction experiment is based on a factorial design. Customers were endowed with one of two types of fish; either 500 g of food-safety certified live catfish or 500 g of conventional live fish. Customers endowed with conventional fish were told they might possibly “trade up” and obtain certified fish, while customers endowed with certified fish could perhaps “trade down” to obtain conventional fish. To vary expectations about future ownership we follow the literature and varied the probability of permission to trade one fish item for the other. This was accomplished through the roll of a die. In the “low probability of permission to trade” arm, participants expect to go home with their initial endowment. In the “high probability of permission to trade” arm, participants realize that they may be able to exchange their endowment for something else. Economic values for trading up (or down) are subsequently measured by eliciting willingness to pay (or accept) for trading the fish endowments in a Becker-DeGroote-Marschak (BDM) auction. The analysis is based on the bidding behavior of participants in the four experimental sub-groups thus created.
Our main contribution is to provide estimates of the causal effect of endowments and expectations on reference point formation “in the field”, rather than in a lab setting.Footnote 2 We document expectations-based reference dependence for traded commodities that differ in quality, and can be ranked in terms of utility. Policy interventions in the form of either mandatory or market-based approaches aimed at minimizing potential health hazards within food-producing sectors are increasingly recognized as relevant for improving welfare in developing countries (e.g., Birol et al., Reference Birol, Karandikar, Roy and Torero2015; De Groote et al., Reference De Groote, Narrod, Kimenju, Bett, Scott, Tiongco and Gitonga2016; Hoffmann et al., Reference Hoffmann, Moser and Saak2019; Ortega et al., Reference Ortega, Wang, Olynk, Wu and Bai2011). The literature suggests that consumers in low-income countries are increasingly willing to pay for food safety (e.g., Alphonse & Alfnes, Reference Alphonse and Alfnes2016; Ifft et al., Reference Ifft, Roland-Holst and Zilberman2012; Owusu-Sekyere et al., Reference Owusu-Sekyere, Owusu and Jordaan2014), and that the size of price premiums varies across food items and types of consumers and in many contexts is bound by ability to pay (e.g., Ortega et al., Reference Ortega, Wang, Olynk, Wu and Bai2011).
We find strong support for reference-dependence in our sample. The minimum willingness to accept (WTA) for trading down (exchanging the superior item for the conventional one) is 40% greater than the maximum willingness to pay (WTP) for the reverse trade. However, WTA does not stochastically dominate WTP. We document a reverse endowment effect for a specific subsample of the respondents, for whom WTP for an upgrade exceeds WTA for a downgrade. This confirms earlier findings of reverse endowment effects when exchanging quality-differentiated versions of the same product (Banerji & Rampal, Reference Banerji and Rampal2020; Lusk et al., Reference Lusk, Feldkamp and Schroeder2004). Our third result is that expectations about future ownership seem to matter for the construction of reference points in some trades, but not others. Expectations seem to affect WTP for subjects endowed with the conventional fish commodity (a marginally significant effect), but not WTA for subjects endowed with the superior alternative (a precisely estimated null result). Our final result is that average willingness to pay a premium for food safety certified fish is large in urban Nigeria.
Reference point formation is important for trading behavior of consumers, and outcomes will depend on whether consumers construct reference points based on expected prices of goods (Wenner, 2015; Caputo et al., Reference Caputo, Lusk and Nayga2019) or on expectations with respect to owning the goods (Ericson & Fuster, Reference Ericson and Fuster2011). Anticipating that gain–loss utility considerations enter consumer decision-making, firms should adjust price setting and marketing policies––managing expectations in a desirable direction. Gain–loss utility will also affect appreciation of public goods, and should therefore enter in cost–benefit analyses of governments.
However, it is important to point out that the literature leaves open the possibility that the case for nonstandard preferences, including framing effects, gain–loss utility and reference points, has been overstated. For example, Cason and Plott (Reference Cason and Plott2014) demonstrate that subjects’ failure to recognize the game form (i.e., the rules describing how choices map on outcomes) may result in systematic mistakes in the choices that they make. For example, while Cason and Plott (Reference Cason and Plott2014) use a second-price auction in their experiment, a sizable share of the respondents appears to mistakenly believe that they are participating in a first-price auction. This generates patterns in the data that appear consistent with nonstandard preferences, but should not be interpreted as such. In most experiments it is quite difficult to distinguish between choices based on preferences from choices based on mistakes. We try to attenuate concerns about mistakes and misconceptions by carefully instructing and training our respondents in how to behave in the BDM auction (see below) and by probing whether choices in our experiments systematically vary with the education level of the subjects (assuming that more highly-educated subjects are less likely to suffer from failure of game form recognition).
The remainder of the paper is structured as follows. After a short review of the literature (Sect. 2), we introduce the basic framework and derive testable predictions (Sect. 3). We explain the context and present the experimental design (Sect. 4) before turning to our data and results, in Sects. 5 and 6, respectively. In Sect. 7 we explore the heterogeneity of our treatment effects across different subsamples. A discussion ensues.
2 The literature
This paper aims to contribute to the literature on the effect of endowments and expectations on valuation—a literature primarily based on lab-style experiments in high-income countries. Abeler et al. (Reference Abeler, Falk, Götte and Huffman2011) organized a real-effort experiment where subjects either received a fixed wage or payment based on performance. Raising the fixed wage pushed up the reference point, crowding in additional effort for disappointment-averse participants.Footnote 3 Dreyfuss et al. (Reference Dreyfuss, Heffetz and Rabin2021) showed that expectations-based reference dependence explains apparently sub-optimal behavior whereby loss-averse individuals tend to intentionally choose seemingly dominated options in order to avoid disappointment in the future. Ericson and Fuster (Reference Ericson and Fuster2011) endowed participants with a mug and randomly assigned them to one of two treatment arms—with low (10%) or high (90%) probability of permission to exchange. In a follow-up experiment, they randomized the probability that participants would receive a mug, and subsequently elicited their WTA for it. When individuals expect to keep or receive an item, their WTA for that item increased.Footnote 4 In a BDM auction setting, Banerji and Gupta (Reference Banerji and Gupta2014) experimentally manipulated the probability of winning the auction (conditional on bidding), by varying the support from which the strike price is randomly drawn. Subjects bid less when their probability of winning goes down, or when the expected strike price goes up.
However, not all experimental evidence supports the idea that expectations shape reference points. Cerulli-Harms et al. (Reference Cerulli-Harms, Goette and Sprenger2019) endowed participants with either a mug or money and exogenously varied the probability of forced exchange. The impact of variation in the probability of forced exchange on valuation was mixed and sensitive to small manipulations in experimental design.Footnote 5 Heffetz and List (Reference Heffetz and List2014) showed participants a mug and a pen, and randomly assigned one of these items to them. They varied the probability with which subjects were allowed to trade, and study choice behavior with respect to exchange. Participants were more likely to choose the item assigned to them by chance, but choices did not vary across expectation treatments––while an endowment effect exists, it is not driven by expectations. This conclusion is supported by Wenner (2015), who manipulated price expectations in a lab setting and found that buying behavior was not affected by the ex-ante distribution of prices.Footnote 6
Building on Abeler et al. (Reference Abeler, Falk, Götte and Huffman2011), Gneezy et al. (Reference Gneezy, Goette, Sprenger and Zimmermann2017) manipulate both the size of fixed payments and probabilities of receiving a high fixed payment, low fixed payment, or piece rate. They find little evidence of expectations-based reference dependence: effort supply responds in a non-monotone fashion to changes in payments or probabilities. Finally, Smith (Reference Smith2019) explores whether lagged beliefs affect reference point formation. He sought to induce reference points by making subjects participate in a lottery with different probabilities of winning a prize, and then tested whether this probabilistic reference point affects valuation after the outcome of the lottery was realized (using a BDM design). While current endowments affected valuation, lagged beliefs did not.Footnote 7
The paper also contributes to the literature on the demand for food safety in low-income settings. Most studies assessing WTP for food safety in developing countries use hypothetical approaches such as choice experiments, survey methods, or contingent valuation methods (Lagerkvist et al., Reference Lagerkvist, Hess, Okello and Karanja2013; Otieno & Nyikal, Reference Otieno and Nyikal2017; Owusu-Sekyere et al., Reference Owusu-Sekyere, Owusu and Jordaan2014). These approaches may be subject to significant upward bias. Notable exceptions are Ifft et al. (Reference Ifft, Roland-Holst and Zilberman2012) who studied demand for safety of poultry products using an incentivized choice experiment, and found an important trade-off between safety and taste, Alphonse and Alfnes (Reference Alphonse and Alfnes2016) who examined consumers’ WTP for tomatoes inspected for food safety standards and found significant price premiums, and Hoffmann et al. (Reference Hoffmann, Moser and Herrman2021) who examined the impact of a randomized safety-focused marketing campaign on sales of maize flour over time.
Some studies show that food safety standards are driven by consumers (e.g., Tran et al., Reference Tran, Bailey, Wilson and Phillips2013) while others conclude that consumer demand will not be a barrier to market-based approaches for food safety improvement (Ifft et al., Reference Ifft, Roland-Holst and Zilberman2012). A common finding of the literature is that consumers are increasingly willing to pay price premiums for food safety (Alphonse & Alfnes, Reference Alphonse and Alfnes2016; Ifft et al., Reference Ifft, Roland-Holst and Zilberman2012; Lagerkvist & Okello, Reference Lagerkvist and Okello2016; Lagerkvist et al., Reference Lagerkvist, Hess, Okello and Karanja2013; Ortega et al., Reference Ortega, Wang, Olynk, Wu and Bai2011; Otieno & Nyikal, Reference Otieno and Nyikal2017; Owusu-Sekyere et al., Reference Owusu-Sekyere, Owusu and Jordaan2014). We use an incentive compatible approach to study the value of safety certification of fish in a low-income country. Fish is known as food for the (relatively) poor in our study region. Food safety is a key concern for our sample population, and food safety certified catfish should be (weakly) preferred over uncertified catfish.
3 Theoretical framework
The Kőszegi and Rabin (Reference Kőszegi and Rabin2006) model assumes that utility depends on a consumer’s k-dimensional consumption vector c and on a reference vector r , as follows:

Utility depends on two components, separable across dimensions. The first term on the right hand side captures classical utility, or utility derived from consuming good k. The second term captures gain–loss utility, which is where reference-dependence enters. Value function μ is defined as: μ(x) =
 x for x > 0 and μ(x) =
 for x < 0. Parameter η is the weight attached by the consumer to gain–loss utility and λ > 1 is the coefficient of loss aversion. The latter coefficient captures that utility losses associated with outcomes
 below reference value
 are greater than utility gains from equal-sized realizations in excess of that reference point.
Where does reference vector r in (1) come from? Early papers of reference-dependent utility demonstrated that reference points can be manipulated through random assignment of items, suggesting that status quo endowment levels determine reference points. For example, many subjects ex-post prefer an item randomly distributed to them over another item of the same monetary value (e.g., Tversky & Kahneman, Reference Tversky and Kahneman1991; Thaler, Reference Thaler1980; Knetsch, Reference Knetsch1989). However, reference point formation may be a complex process, in which additional considerations could enter as well. One prominent alternative (or additional) candidate determinant of reference points is expectations about future ownership. According to the Kőszegi and Rabin (Reference Kőszegi and Rabin2006) theory, people base reference points on expectations about outcomes which, in turn, are the result of people’s own anticipated behavior (which should be consistent with actual behavior). This is called a personal equilibrium.
4 Experimental design
We implemented our experiment in Lagos State, Nigeria. Nigeria is the largest aquaculture producer in sub-Saharan Africa (WorldFish, 2018), and fish accounts for over 40% of total protein intake. However, food safety is an issue. Health hazards arise from contaminants during farming or quality loss due to poor handling and processing (Department of Fisheries and Aquaculture, 2009). Misuse of antimicrobials is a key driver of the emergence and spread of antimicrobial resistance (Olatoye & Basiru, Reference Olatoye and Basiru2013). Foodborne illnesses caused 420,000 deaths and 33 million disability-adjusted life years (DALYs) worldwide in 2010 (World Health Organization, Reference Organization2015). One approach to improve production standards is certification for food safety (e.g., Birol et al., Reference Birol, Karandikar, Roy and Torero2015; Bush et al., Reference Bush, Belton, Hall, Vandergeest, Murray, Ponte, Oosterveer, Islam, Mol, Hatanaka, Kruijssen, Little and Kusumawati2013).
Nigeria’s Federal Department of Fisheries and Aquaculture initiated the process of voluntary certification and standardization of fisheries and aquaculture products in 2009. Operational guidelines and criteria for certification of aquaculture products in the country were developed to standardize operation of fish farms and to minimize hazards to human health. The aim is to increase consumer benefits, confidence, and traceability in aquaculture production, processing, and marketing (Department of Fisheries and Aquaculture, 2009). Participants in our study were indeed concerned about food safety issues. When asked, “How often do you think about the potential for fish you purchase in the market to be unsafe to eat”, only 8% answered they never think about food safety. More than 70 percent were worried that consumption of unsafe fish could cause a member of their household to be sick.Footnote 8 However, while consumers are well aware of the various food safety concerns associated with consuming uncertified fish, certified fish products are currently unavailable in the fish markets where we conducted our study. Certified fish is a “novel” and salient product for our subjects.
We partnered with Lagos State University to conduct a framed field experiment in October–November 2019 in a real fish market setting, attended frequently (often on a daily basis) by our participants. A pre-analysis plan (PAP) was registered prior to implementation of the experiment.Footnote 9 We recruited participants seeking to purchase fish on the market. We used two distinct catfish commodities for trading in the experiment, similar in all but one important aspect—whether or not it was certified for food safety by the government. We introduced the certified fish on fish markets in Lagos, in two local administrative units (Ikorodu and Ojo) where we collected experimental data. It is important to state that we did not practice any deception—the certified item was indeed government-certified catfish.Footnote 10
The research team visited market leaders a few weeks before the actual experiment took place to explain the purpose of the study, introduce the field team, and identify suitable places to set up the experiment. The experiment was also pre-tested, and based on the results we decided to implement a price range between 0 and 400 Naira for the bids. After the pilot but before we ran the actual experiment, a scandal about food safety issues broke out in Lagos (and other parts of Nigeria). In September 2019, the National Agency for Food and drug Administration and Control (NAFDAC) threatened nationwide shutdown of bakeries over illegal, unhygienic practices, which received a lot of media attention. Details of the scandal can be found here (https://www.vanguardngr.com/2019/10/nafdac-threatens-nationwide-shutdown-of-bakeries-over-illegal-unhygienic-practices/) and we return to this issue below as it may have affected bidding behavior.
For the actual experiment, each second consumer entering the market was approached and asked to participate in the experiment, until we reached a sample size of 400 visitors. Some 90% of invited consumers agreed to participate, with the remaining 10% declining because they could not spare 30 min—the duration of the experiment. Participants were informed that they participated in a field experiment run by a research team––not by salespersons for any particular type of fish. Participants received a show-up fee of 1000 Naira (≈ USD 2.8) in an envelope and their fish endowment. The market price of 500 g live catfish of the conventional type is approximately 500 Naira.
We implemented a factorial design. In Arm 1, 200 consumers received 500 g of uncertified live catfish. It was explained that the fish was obtained from the local market, so that conventional production and handling standards applied.Footnote 11 In Arm 2, 200 other consumers received 500 g of safety-certified live catfish. We explained that the fish was produced by a fish farmer approved by the government for following food safety guidelines, and what this meant. In Arm 1, we measured WTP to “trade up” and exchange standard fish for certified fish. In Arm 2, we measured WTA to “trade down” and exchange certified fish for the standard quality. We implemented the experiment one participant at a time, and made sure that participants could not observe others, or be observed by others, to avoid peer effects (Falk & Ichino, Reference Falk and Ichino2006) or conformity effects (Andreoni & Bernheim, Reference Andreoni and Bernheim2009). Orthogonal to the endowment arms, we randomly varied the probability that subjects were permitted to trade their endowment for the other item––conditional on their bid in the auction (see below). We have the following design (Fig. 1).
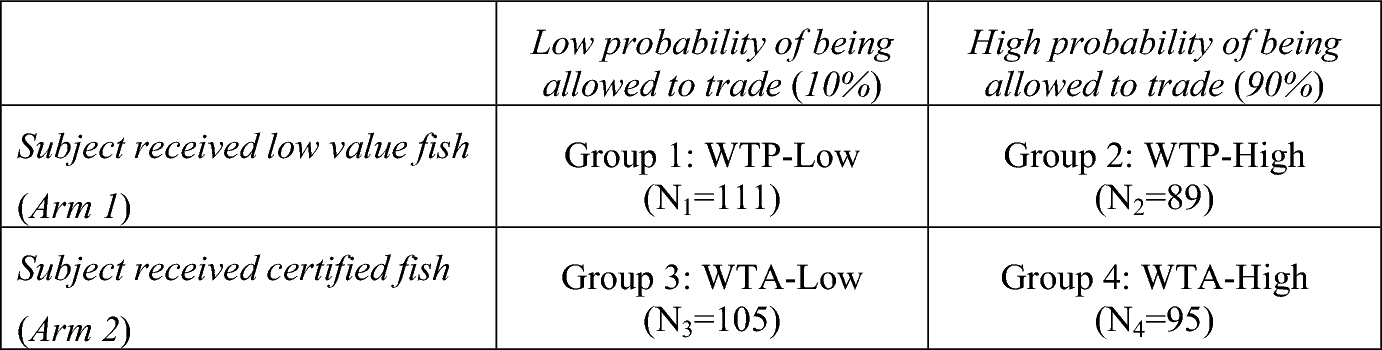
Fig. 1 The factorial design of the framed field experiment
To probe the role of reference-dependent utility in fish purchasing, and the potential role of expectations in the formation of reference points, we implemented a 7-step protocol:
Step 1 (Introduction). Subjects receive their show-up fee and endowment, and information about the fish item. They are informed that they may be able to trade their fish endowment for another one. In Arm 1, subjects learn that they may be able to exchange their uncertified fish for certified fish (and what this meant). Similarly, subjects in Arm 2 learn that they may be able to trade their certified fish for uncertified fish.
Step 2 (Expectation manipulation). Subjects are randomly (and transparently) assigned to one of two treatments––with “low” or “high” probability of permission to exchange. A coin is flipped in front of the participant, with sides labelled “1” and “9”. The participant receives an index card with the resulting number on it, and is told that she can exchange her endowment for the other commodity if a 10-sided die (with numbers ranging between 0 and 9 on each side) to be rolled after the session would come up lower than the number on the index card. Hence, a participant whose coin came up “1” had a 10% probability of permission to exchange and a participant whose coin came up “9” had a 90% probability of being able to exchange.Footnote 12 This was clearly explained and practiced. This approach introduces exogenous variation in expectations; subjects throwing a “1” most likely expect to go home with their endowment, and subjects throwing a “9” probably do not.
Step 3 (Survey 1). Participants answer a few demographic questions.Footnote 13 The purpose is to allow time for reference points to form in response to an individual’s plans regarding whether to exchange fish if given the opportunity to do so.
Step 4 (Practice and instructions). All subjects participate in a trial BDM auction, which was clearly explained with trial runs to reduce the risk of game form recognition failure (Cason & Plott, Reference Cason and Plott2014). The practice round was conducted with two different types of bars of soap. The literature recommends to conduct practice rounds with products that are different from the final product being auctioned. The practice round was hypothetical––bars of soap were used for demonstration purposes only and participants did not walk home with any bar of soap. This was clearly explained at the start of the practice round. Participants were also allowed to hold and examine the 10-sided dice. To ensure that participants fully understood the instructions, we asked a few control questions.Footnote 14 We continued to the next step only after the participant answered all control questions correctly, otherwise the instructions were repeated.
Step 5 (Valuation). As is well-known, in a BDM auction subjects state their bid which is compared to an unknown strike price. If WTP exceeds the strike price, the subject obtains the item and pays the strike price. BDM auctions are incentive-compatible and reveal true preferences if subjects maximize expected utility. The strike price was revealed by opening a sealed envelope, which contained a randomly drawn number from a uniform price distribution (ranging from 0 to 400 Naira, in steps of 25 Naira). This price range was announced to subjects. Since the market price of uncertified fish is approximately 500 Naira, we adopt an upper bound for the premium value of certified fish of 80%. Using a multiple price list format, also ranging from 0 to 400 Naira, participants in Arm 1 stated their WTP to exchange their uncertified fish for certified fish. This bid was compared with the strike price. Similarly, using a multiple price list format, participants in Arm 2 stated their WTA to exchange their certified fish for uncertified fish and their minimum bid (or offer) was compared to a random strike price between 0 and 400 Naira. Before bidding, all participants were reminded that effectuating the exchange would depend on the roll of the ten-sided die as well as the bid level relative to the strike price.
Step 6 (Survey 2). Participants fill out a second short survey including questions about consumption and expenditures, and food safety knowledge.
Step 7 (Implementation). The die is rolled and, depending on the outcome (and bidding or offering behavior), the trade is effectuated––fish is exchanged and corresponding payments are made. None of the subjects reneged and changed their minds.
To mitigate potential “house money” effects arising from the unexpected receipt of money (Canavari et al., Reference Canavari, Drichoutis, Lusk and Nayga2019; List & Price, Reference List and Price2016), we reminded the subjects that they could use the participation fee any way they wanted.Footnote 15 Some 95% of the participants did not open the envelope containing the participation fee; instead, they used their own money in the experiment. To mitigate concerns about contamination due to social learning and participants “gaming” the experiment, we used 10 enumerators to keep the duration of the study as short as possible, and changed locations within the market.
5 Empirical strategy and data
For our empirical strategy, we exploit both experimental margins: variation in endowments and variation in expectations. To test whether endowments matter for the formation of reference points we analyze whether endowments affect bidding behavior. We compare average WTP for trading up in Arm 1 (the WTP-Low and WTP-High groups) to average WTA for trading down in Arm 2 (WTA-Low and WTA-High groups), and estimate the following model:

In (2),
 measures the natural log of the bid (or offer) of consumer
 on market m. The variable
 denotes the dummy associated with Arm 2, equal to one if consumer
 received certified fish, and zero otherwise. Vector
 captures demographic characteristics: sex, age, education, knowledge about food safety, and two proxies capturing attitudes towards risk.Footnote 16 Vector
 captures market fixed effects, and
 is a random error term. Anchoring on your own endowment drives up WTA for participants in Arm 2 and drives down WTP for participants in Arm 1. We therefore expect
 and test whether we can reject the hypothesis that
 . We also compare cumulative bid distributions under Arms 1 and 2 to check whether one bid distribution stochastically dominates the other.
To test whether expectations affect reference points we exploit variation in the probability of permission to trade. That is, we compare bids of respondents from the WTP-low and WTA-Low groups (1 and 3) to bids from the WTP-High and WTA-High groups (2 and 4). We identify the effect of expectations by regressing bidding behavior of participant
 on a treatment dummy capturing whether this participant has a high probability of being able to trade (
 ). However, observe the following. If gain–loss utility matters, respondents expecting to keep their endowment should bid less in Arm 1 (as they anchor on uncertified fish) and ask more in Arm 2 (as they anchor on certified fish). Since lumping these effects together obfuscates results, we estimate a model that allows identification of the effects of expectations for these two groups separately:

In (3), parameter β (again) captures the effect of endowments, γ captures the effect of expectations for subjects from Arm 1, and
 captures the effect of expectations for subjects from Arm 2. As before, we expect
 . We also expect
 as subjects expecting to trade are less likely to anchor on their endowment of uncertified fish, and therefore are willing to pay more for an upgrade. Finally, we expect
 , reflecting that subjects with certified fish who expect to trade are less likely to anchor on their endowment of certified fish, and hence are willing to accept less for a downgrade.
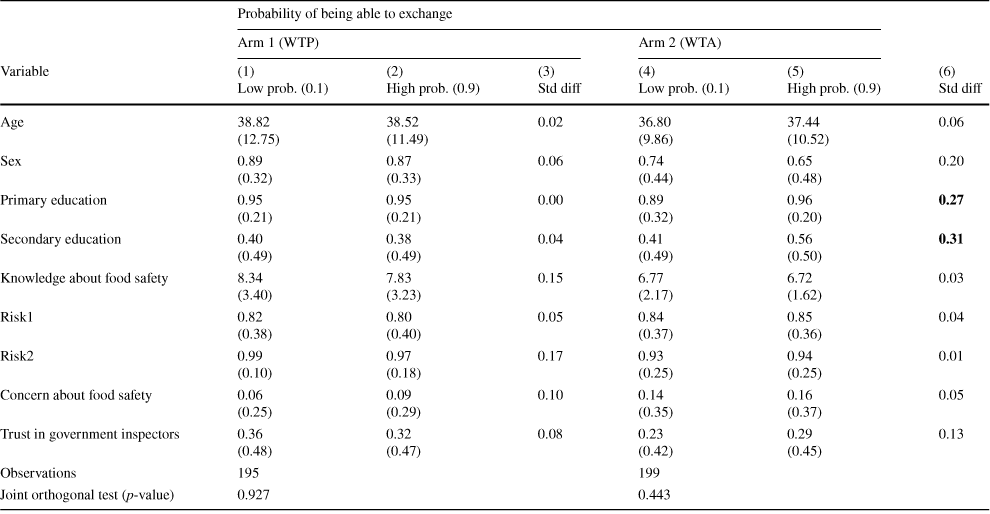
Comparing respondents across arms reveals that they are similar in terms of observables and stated preferences. Table 1 demonstrates that random assignment to the trade treatment within the arms also succeeded in generating comparable groups. This is tested formally through an F-test of joint orthogonality using a logit regression, which tests whether the observable characteristics in Table 1 are jointly unrelated to treatment status. We cannot reject this null hypothesis (p-value = 0.927 for Arm 1 and p-value = 0.443 for Arm 2), suggesting that randomization succeeded in achieving balance. Balance is further supported by the analysis of the standardized difference in means in columns (3) and (6) (Canavari et al., Reference Canavari, Drichoutis, Lusk and Nayga2019).
Table 1 Balance tests and summary statistics
|
Probability of being able to exchange |
||||||
|---|---|---|---|---|---|---|
|
Arm 1 (WTP) |
Arm 2 (WTA) |
|||||
|
Variable |
(1) Low prob. (0.1) |
(2) High prob. (0.9) |
(3) Std diff |
(4) Low prob. (0.1) |
(5) High prob. (0.9) |
(6) Std diff |
|
Age |
38.82 (12.75) |
38.52 (11.49) |
0.02 |
36.80 (9.86) |
37.44 (10.52) |
0.06 |
|
Sex |
0.89 (0.32) |
0.87 (0.33) |
0.06 |
0.74 (0.44) |
0.65 (0.48) |
0.20 |
|
Primary education |
0.95 (0.21) |
0.95 (0.21) |
0.00 |
0.89 (0.32) |
0.96 (0.20) |
0.27 |
|
Secondary education |
0.40 (0.49) |
0.38 (0.49) |
0.04 |
0.41 (0.49) |
0.56 (0.50) |
0.31 |
|
Knowledge about food safety |
8.34 (3.40) |
7.83 (3.23) |
0.15 |
6.77 (2.17) |
6.72 (1.62) |
0.03 |
|
Risk1 |
0.82 (0.38) |
0.80 (0.40) |
0.05 |
0.84 (0.37) |
0.85 (0.36) |
0.04 |
|
Risk2 |
0.99 (0.10) |
0.97 (0.18) |
0.17 |
0.93 (0.25) |
0.94 (0.25) |
0.01 |
|
Concern about food safety |
0.06 (0.25) |
0.09 (0.29) |
0.10 |
0.14 (0.35) |
0.16 (0.37) |
0.05 |
|
Trust in government inspectors |
0.36 (0.48) |
0.32 (0.47) |
0.08 |
0.23 (0.42) |
0.29 (0.45) |
0.13 |
|
Observations |
195 |
199 |
||||
|
Joint orthogonal test (p-value) |
0.927 |
0.443 |
||||
Standard deviations appear in parentheses. The p-value for the joint orthogonality test is obtained from a logit regression of the treatment variable on the covariates. Std diff means standardized difference in means. Bold figures show that the standardized difference in means is above the threshold of 0.25
Some 80% of our respondents are female, and the average age is 38 years. Nearly 90% of the respondents has completed at least primary level education and 40% completed secondary education. This reflects the urban nature of our sample. Many subjects are implementing measures to protect themselves. Some 82% of participants in Arm 1 and 84% in Arm 2 were aware of risks associated with eating unsafe fish (Risk1). In addition, 98% of study participants in Arm 1 and 93% in Arm 2 responded they were protecting themselves against consumption of unsafe fish (Risk2). There was no significant difference in knowledge between groups in Arm 1 and Arm 2, but a t-test showed that consumers who completed primary or secondary education had greater knowledge about food safety than those who did not (p-values < 0.05).Footnote 17
Towards the bottom of the table we introduce two additional variables, Concern about food safety and Trust in government inspectors of food safety, that will be used in a heterogeneity analysis below. Concerns about food safety is a dummy variable equal to 1 if the respondent indicates that the government should run programs for fish farmers, traders, and vendors to educate them on how to keep fish products safe and clean, and 0 if otherwise. A minority of respondents considered this a useful proposition. The variable Trust in government inspectors is also a dummy variable. Respondents were asked to indicate on a scale of 1 (no trust at all) to 10 (complete trust), the extent to which they trusted government inspectors of food safety. Overall, trust is low, with only about one-third of the respondents indicating they trust the government inspectors to do their job. Using these data, we construct a dummy variable equal to 1 if the score is less than 5 and 0 if otherwise. Again, we document balance across experimental groups.
6 Results
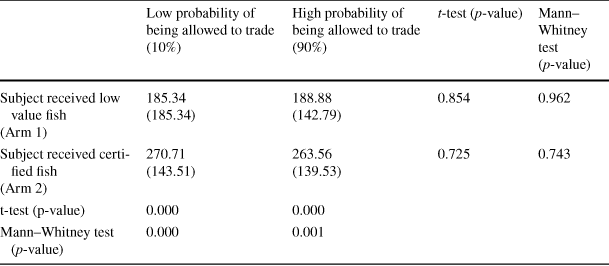
We summarize our bid and offer data in Table 2, for the four experimental groups separately. We also report the outcomes of t-tests and non-parametric Mann–Whitney tests to indicate whether bidding behavior differs across cells. A first glance reveals that average WTA is significantly greater than average WTP, regardless of whether the probability to trade is high or low (Tables 3, 4, 5). In contrast, bidding behavior in neither the WTA or WTP arm seems to systematically vary with the probability of trade. In Appendix Table 6 we provide results broken down per local administrative unit, which reveals some spatial differences in bidding behavior. We therefore turn to a regression framework, where we can control for market effects and respondent characteristics.
Table 2 Summary of bids
|
Low probability of being allowed to trade (10%) |
High probability of being allowed to trade (90%) |
t-test (p-value) |
Mann–Whitney test (p-value) |
|
|---|---|---|---|---|
|
Subject received low value fish (Arm 1) |
185.34 (185.34) |
188.88 (142.79) |
0.854 |
0.962 |
|
Subject received certified fish (Arm 2) |
270.71 (143.51) |
263.56 (139.53) |
0.725 |
0.743 |
|
t-test (p-value) |
0.000 |
0.000 |
||
|
Mann–Whitney test (p-value) |
0.000 |
0.001 |
||
Standard deviations appear in parentheses
Table 3 Endowments, expectations and bidding behavior
|
Dependent variable: natural log of consumer bids |
|||||||
|---|---|---|---|---|---|---|---|
|
Variable |
(1) |
(2) |
(3) |
(4) |
(5) |
(6) |
(7) |
|
Certify |
0.90*** (0.15) |
0.95*** (0.15) |
1.01*** (0.20) |
0.999*** (0.259) |
1.07*** (0.21) |
1.15*** (0.22) |
1.15*** (0.22) |
|
Trade |
– |
– |
– |
0.403 (0.259) |
0.42* (0.24) |
0.44* (0.19) |
0.44** (0.19) |
|
Certify x Trade |
– |
– |
– |
− 0.430 (0.288) |
− 0.39 (0.27) |
− 0.46* (0.27) |
− 0.46* (0.27) |
|
Market fixed effects |
Yes |
Yes |
Yes |
No |
Yes |
Yes |
Yes |
|
Additional controls |
No |
Yes |
Yes |
No |
No |
Yes |
Yes |
|
Constant |
4.37*** (0.17) |
3.79*** (0.54) |
3.70*** (0.57) |
4.331*** (0.202) |
4.18*** (0.22) |
3.56*** (0.55) |
3.56*** (0.54) |
|
R-squared |
0.17 |
0.21 |
0.06 |
0.080 |
0.18 |
0.22 |
0.07 |
|
Observations |
394 |
394 |
394 |
394 |
394 |
394 |
394 |
Columns (1), (2), (4), (5), and (6) are OLS regression estimates. Columns (3) and (7) are Tobit regression estimates. Robust standard errors are reported in parentheses. Additional controls include sex, age, and education of the respondent, a proxy of knowledge about food safety of the respondent, a dummy variable capturing the perceived risks associated with eating unsafe fish, and a dummy variable capturing the measures implemented by the respondent to protect themselves from unsafe fish. *** p < 0.01, ** p < 0.05, * p < 0.10
Table 4 Determinants of offers for subpopulations (WTA bids < = 100 Naira and WTA = 400)

|
WTA = 400 Naira |
WTA ≤ 100 Naira |
|||
|---|---|---|---|---|
|
Variable |
Coefficient (1) |
Marginal effect (2) |
Coefficient (3) |
Marginal effect (4) |
|
Respondent is female |
− 0.011 (0.335) |
− 0.003 (0.077) |
0.237 (0.393) |
0.041 (0.067) |
|
Age of the respondent |
− 0.022 (0.015) |
− 0.005 (0.003) |
0.055*** (0.018) |
0.009*** (0.003) |
|
Primary education |
− 0.886** (0.385) |
− 0.203** (0.084) |
0.223 (0.449) |
0.038 (0.077) |
|
Knowledge score |
0.164 (0.190) |
0.037 (0.043) |
− 0.162 (0.214) |
-0.028 (0.037) |
|
Aware about food safety issues in fish |
− 0.214 (0.528) |
− 0.049 (0.120) |
0.410 (0.594) |
0.071 (0.102) |
|
Trust in government’s role in addressing food safety issues |
− 0.233 (0.358) |
− 0.053 (0.082) |
− 0.256 (0.411) |
-0.044 (0.070) |
|
Concern about food safety issues in fish |
− 0.468 (0.450) |
− 0.107 (0.102) |
0.101 (0.552) |
0.017 (0.095) |
|
Perceives risks associated with eating unsafe fish (Risk1) |
− 0.143 (0.458) |
− 0.033 (0.105) |
0.671 (0.550) |
0.115 (0.094) |
|
Consumer is protecting himself/herself from unsafe fish (Risk2) |
1.460* (0.872) |
0.334* (0.195) |
− 1.678** (0.707) |
-0.288** (0.115) |
|
Group 3 dummy (WTA-Low) |
0.006 (0.301) |
0.001 (0.069) |
0.019 (0.350) |
0.003 (0.060) |
|
Constant |
0.102 (1.186) |
– |
− 2.540** (1.208) |
- |
|
Observations |
199 |
199 |
||
Logistic regression estimates. Dependent variable in columns (1) and (2) is a dummy equal to one if willingness to accept bid is equal to 400 Naira, and zero if otherwise. Dependent variable in columns (3) and (4) is a dummy equal to one if willingness to accept bid is less than or equal to 100 Naira, and zero if otherwise. *** p < 0.01, ** p < 0.05, ** p < 0.1
Table 5 Endowments, expectations and bidding behavior (heterogeneity analysis)
|
Variable |
(1) Z = Primary education |
(2) Z = Secondary education |
(3) Z = Concern about food safety |
(4) Z = Trust in gov. inspectors |
|---|---|---|---|---|
|
Certify |
1.68* (1.01) |
1.04*** (0.28) |
1.22*** (0.23) |
1.01*** (0.25) |
|
Trade |
1.83* (1.03) |
0.55* (0.31) |
0.44* (0.25) |
0.44* (0.27) |
|
Certify x Trade |
− 1.63 (1.07) |
− 0.50 (0.35) |
− 0.46 (0.29) |
− 0.50 (0.31) |
|
Z |
0.81 (1.00) |
0.02 (0.36) |
0.84** (0.33) |
-0.36 (0.40) |
|
Z x Certify |
− 0.55 (1.04) |
0.28 (0.40) |
− 0.85** (0.39) |
0.44 (0.44) |
|
Z x Trade |
− 1.46 (1.05) |
− 0.31 (0.48) |
− 0.34 (0.47) |
− 0.09 (0.54) |
|
Z x Certify x Trade |
1.24 (1.11) |
0.14 (0.54) |
0.49 (0.56) |
0.27 (0.61) |
|
Market F.E |
Yes |
Yes |
Yes |
Yes |
|
Controls |
Yes |
Yes |
Yes |
Yes |
|
Constant |
3.67*** (1.03) |
4.41*** (0.41) |
4.23*** (0.45) |
4.43*** (0.49) |
|
R-squared |
0.22 |
0.22 |
0.22 |
0.23 |
|
Observations |
394 |
394 |
394 |
394 |
OLS regression estimates. Market F.E. means market fixed effects. Additional controls include sex, age, a proxy of knowledge about food safety of the respondent, a dummy variable capturing the perceived risks associated with eating unsafe fish, and a dummy variable capturing the measures implemented by the respondent to protect themselves from unsafe fish. Robust standard errors are reported in parentheses. *** p < 0.01, ** p < 0.05, * p < 0.1
Table 6 Summary of bids and offers, by local administrative unit

|
Ikorodu |
Ojo |
||||||
|---|---|---|---|---|---|---|---|
|
10% |
(90%) |
p-value |
10% |
(90%) |
p-value |
||
|
Subject received low value fish (Arm 1) |
222.73 (124.10) |
269.20 (222.73) |
0.076 |
Subject received low value fish (Arm 1) |
102.40 (93.84) |
147.09 (116.14) |
0.045 |
|
Subject received certified fish (Arm 2) |
347.92 (108.83) |
323.33 (117.82) |
0.519 |
Subject received certified fish (Arm 2) |
207.50 (117.57) |
178.75 (104.90) |
0.420 |
|
p-value |
0.008 |
0.009 |
p-value |
0.008 |
0.065 |
||
Standard deviations appear in parentheses
6.1 Endowments and formation of reference points
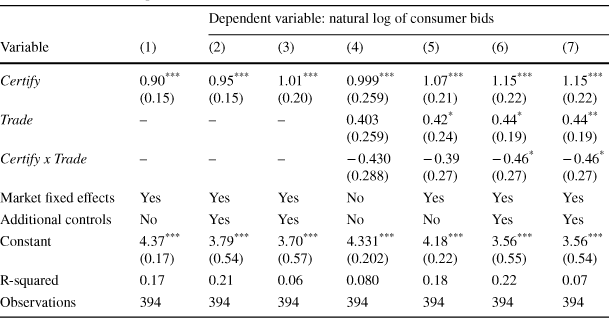
We first examine whether consumers anchor on their random endowment by comparing WTP for trading-up in Arm 1 with WTA for trading-down in Arm 2. If participants use their endowment as a reference point for a possible gain–loss utility term, reference-dependence pushes up WTA and pushes down WTP. The results are consistent with this prediction. From the top row of columns (1–7) in Table 3, subjects endowed with certified fish on average require greater compensation to part with their endowment than subjects endowed with uncertified fish are willing to pay. This finding is robust across specifications. We report results with and without subject controls, and include market fixed effects in all models except in model (4).
To place the regression results in perspective, we now turn to an unconditional comparison of sample means. Average WTA equals 267 Naira and average WTP equals 187. This tells us two important things. First, WTA is 43% higher than WTP, which is a gap that is not only statistically but also economically significant.Footnote 18 Second, average willingness to pay a premium for food safety certified fish is large. The WTP estimate serves as a lower bound of the true value for our sample (possibly attenuated by reference-dependence) and the WTA estimate is an upper bound (accentuated by reference dependence). Since conventional fish costs about 500 Naira per 500 g, we find that the premium is somewhere between 37 and 53% of the value of the uncertified commodity. This reflects that some (well-known) health hazards due to consumption of unsafe fish are perceived as large.
Figure 2 plots the cumulative density functions of WTP and WTA bids, for all possible values of the strike price. The p-value for the Wilcoxon rank-sum test, at < 0.001, provides strong confirmation of differences in bid distributions. Surprisingly, about 40 percent of participants in Arm 2 had a WTA bid equal to the maximum strike price of 400 Naira. These consumers were unwilling to trade-down for any strike price in the 0–400 Naira range. The desire to “try out” this novel product was quite strong, confirming that food safety is a relevant topic for our respondents. Bids in the actual experiment were higher than bids during the pilot (we used the pilot to define a range of bid values, aiming to have the great majority of bids within the range). We speculate this is due to the widely-publicized food safety incident that occurred between the pilot and experiment, mentioned above.Footnote 19 We account for censored data by estimating Tobit models instead of OLS (columns 3 and 7), but this does not solve the problem if bidding at the upper range is caused by a lack of comprehension (failure to recognize the game form). If bids at the upper bound are “mistakes” then they should perhaps be lower without mistakes, whereas the censored technique assumes that the intended choice would have been even higher than the upper bound. We return to the issue of comprehension in Sect. 7.
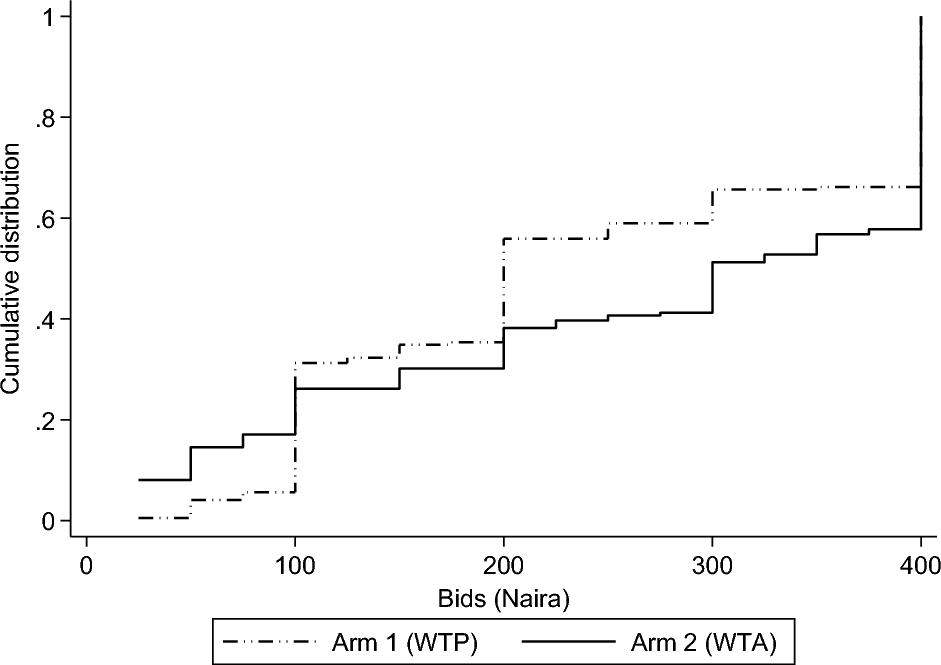
Fig. 2 Share of the population willing to trade at different prices
In columns (1–2) of Table 4 we examine the determinants of bidding at the upper bound in the WTA arm in more detail. We created a dummy variable taking the value of one if the responded indicated a WTA of 400 Naira, and see how this variable correlates with our respondent observables. Asking the maximum amount is more likely for risk averse respondents with limited education. The group 3 dummy (WTA-Low) does not enter significantly.
Returning to Fig. 2, it is clear that WTA does not stochastically dominate WTP—the CDFs “cross” at the bid level of 100 Naira. This is consistent with the “reverse endowment effect” of Banerji and Rampal (Reference Banerji and Rampal2020).Footnote 20 Our results support these earlier findings, but also extends them. Banerji and Rampal (Reference Banerji and Rampal2020) argue that “possessing a lower quality good can increase one’s willingness to pay to exchange it for a novel and improved version of the same good. This is reasonable because possessing the lower quality good can make it salient for a subject that it is inferior compared to the novel and improved variety available.” Instead, we find that some subjects endowed with the high-quality good are willing to accept extremely low amounts to trade it in. We speculate that these respondents outright reject the new product. One possible explanation may be cognitive dissonance if subjects reject the idea that they routinely consume unsafe food. For WTA to fall below WTP, subjects should have preferences over their beliefs with respect to food safety and be able to control their beliefs by selecting sources of information likely to confirm their “desired” beliefs (Akerlof & Dickens, Reference Akerlof and Dickens1982). Moreover, being endowed with an item should increase the salience of information that may potentially challenge these beliefs. In Appendix A we provide cumulative density functions of WTA and WTP for the 4 individual groups, enabling pairwise comparisons.
Columns (3–4) of Table 4 explore the correlates of these extremely low WTA offers. We construct a dummy variable indicating whether the respondent asks for a compensation level of 100 Naira, or less, and regress this dummy on our subject characteristics. We find that the probability of extending such low bid is positively correlated with age (which may be consistent with the cognitive dissonance hypothesis, as older people have eaten unsafe fish for a longer period) and negatively correlated with our measure of risk aversion. The minority of respondents that takes no measures to protect itself from consuming unsafe fish is more likely to demand very little compensation for downgrading from certified to uncertified fish. This seems consistent. Again, we do not find that the probability of trading affects WTA.
6.2 Expectations and formation of reference points
We now turn to the role of expectations and reference point formation, presented in columns (4–7) of Table 3. As in Table 2, we find no evidence that expectations have a significant effect on WTP if market fixed effects are not included (column 4). If we introduce market fixed effects, a marginally significant effect materializes. However, empirical support for the hypothesis that expectations matter for reference point formation is not only weak, but also mixed. Expectations might matter for reference point formation and economic values in some contexts––but not in others. This follows from columns (5–7).
First consider the effect of expectations for subjects in Arm 1, who make bids to “trade up”. The Trade variable enters marginally significantly for this subsample. Our estimates are consistent with the idea that being allowed to trade implies that expectations about future ownership are weaker, which increases WTP to trade the endowment in for something else. Hence,
 , as predicted. This finding is consistent with, for example, Ericson and Fuster (Reference Ericson and Fuster2014) and Banerji and Gupta (Reference Banerji and Gupta2014).
However, there is no evidence that expectations affect WTA to trade down. It is clear from columns (4–7) in Table 3 that
 . This is confirmed by panel c in Fig. 3 in the Appendix,Footnote 21 which plots the cumulative density functions for the two WTA groups (with high and low probability of trade) and also by a robustness analysis reported in Appendix Table 7, where we split the sample and analyze the bidding behavior of subjects from Arm 1 and Arm 2 separately. While the Trade variable is marginally significant for subjects from Arm 1 (large effect, and of the expected sign), we obtain a precisely estimated null result for subjects from Arm 2.Footnote 22 This finding is consistent with, for example, Heffetz and List (Reference Heffetz and List2014) and Gneezy et al. (Reference Gneezy, Goette, Sprenger and Zimmermann2017). Nevertheless, the finding that the coefficients are only marginally significant and only appear when conditioning for other variables and factors, we believe that support for the hypothesis that expectations matter for reference point formation is weaker than the support for the hypothesis that endowments matter for reference point formation. We also believe that the apparent asymmetry in bidding behavior is an interesting area for follow-up research.
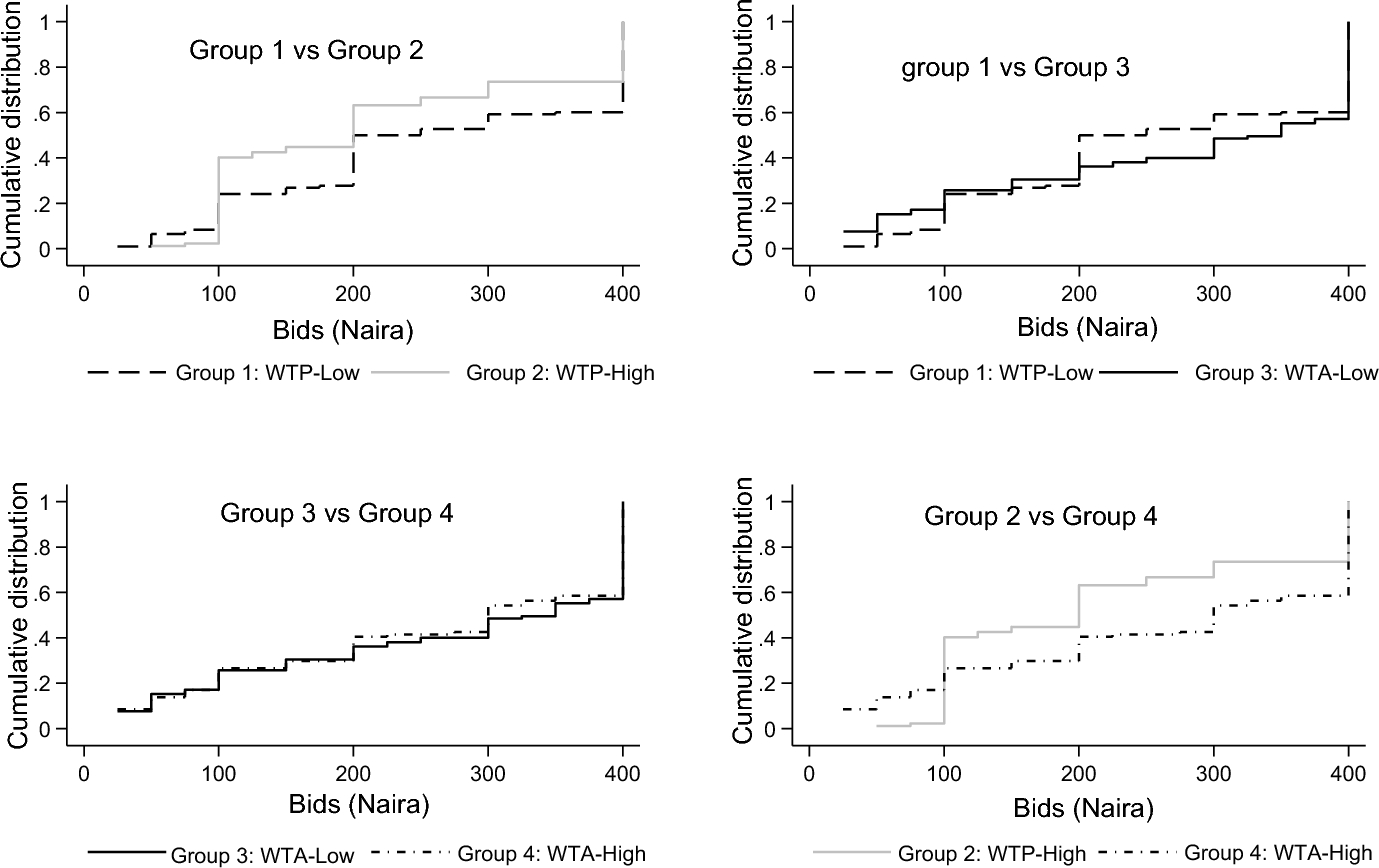
Fig. 3 Share of the population willing to trade at different prices, for each group
Table 7 Splitting the sample: expectations and the value of fish

|
Dependent variable: natural log of consumer WTA-bids |
Dependent variable: natural log of consumer WTP-bids |
|||
|---|---|---|---|---|
|
(1) |
(2) |
(3) |
(4) |
|
|
Trade |
0.01 (0.12) |
0.02 (0.12) |
0.42* (0.24) |
0.45* (0.24) |
|
Market fixed effects |
Yes |
Yes |
Yes |
Yes |
|
Additional controls |
No |
Yes |
No |
Yes |
|
Constant |
5.72*** (0.10) |
6.13*** (0.31) |
3.62*** (0.24) |
2.78*** (0.27) |
|
R-squared |
0.06 |
0.09 |
0.15 |
0.17 |
|
Observations |
199 |
199 |
195 |
195 |
OLS regression estimates. Additional controls include sex, age, and education of the respondent, a proxy of knowledge about food safety of the respondent, a dummy variable capturing the perceived risks associated with eating unsafe fish, and a dummy variable capturing the measures implemented by the respondent to protect themselves from unsafe fish. Robust standard errors are reported in parentheses. The dependent variables are: in columns (1 and 2), log of WTA to downgrade from certified to uncertified fish in experiment 1; in column (3 and 4), log WTP to upgrade from uncertified for certified fish in experiment 2. Asterisks indicate the following: ***p < 0.01, *p < 0.1
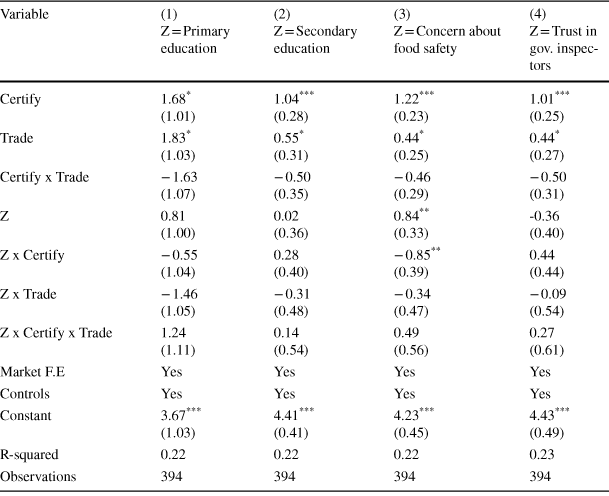
7 Heterogeneity
In this section we probe the robustness of our main results for different subsamples of respondents. We cannot experimentally vary respondent type, so this section reports associations rather than causal effects. We are interested in exploring whether we obtain similar results for respondents with different levels of education, concerns about food safety, and trust in formal certification services (proxied by trust in government inspectors of food safety).
The issue of variation in education is perhaps most important, as this speaks to the question whether our findings are not driven by mistakes made my our subjects, or failure to recognize the game form (as argued by Cason & Plott, Reference Cason and Plott2014). Obviously, we cannot know which responses are mistakes and which ones are proper reflections of underlying preferences.Footnote 23 While we tried to minimize the risk of mistakes by only allowing respondents to participate in the experiment after passing a comprehension test without error (even if this implied that the one-on-one instructions had to be repeated several times), it is evident that the task was challenging for some subjects. In particular, the high frequency of WTA offers that hit the upper limit of the price range (400 Naira) is cause of concern. Our preferred explanation for the difference in bidding behavior between the pilot and actual experiment is a much-publicized food safety incident that happened during the interim, but it is necessary to explore whether other factors matter as well. This includes the possibility that subjects participating in the actual experiment on average have greater difficulty to recognize the game form than subjects participating in the pilot.
We consider the highest level of finished education as a proxy of comprehension. We introduce two dummy variables, Z: one for completed Primary education and one for completed Secondary education. We introduce this dummy in the main regression model, interact it with the experimental variables (Z × Certify and Z × Trade) and also include a triple interaction term (Z × Certify × Trade). Results are reported in the first two columns of Table 5. Three results are noteworthy. First, the main results for Certify and Trade go through as before—the endowment effect exists and is very significant, but the expectations effect is only marginally significant. Second, the education variable itself does not enter significantly, so bidding behavior does not vary with education (controlling for income). Third, and most importantly, none of the interaction terms enters significantly—there is no evidence to suggest that the gap between WTA and WTP varies with education, or that the formation of reference points works differently for higher educated individuals.
We also find no evidence that the empirical results are significantly mediated by concerns about food safety or trust in government inspectors. The relevant interaction terms are never significant, and the main results are unaffected (in a qualitative sense). Moreover, for the model that includes Concern about food safety the interaction between Certify and Trade is (marginally) significant. Finally, and consistent with expectations, subjects who are more concerned about food safety are, on average, bidding more for certified safe food. We interpret this as a sanity check of our data.
8 Conclusions
We examine reference-dependent utility and the formation of reference points in the field, working with consumers trading real food items in a real market setting. An important addition to the literature is that we study trading behavior in asymmetric commodities—one is novel and (weakly) superior for consumers in the context we study, and therefore more salient than the other. We consider food safety certified fish and conventional fish, and find that consumer demand for safe food is large among the respondents in our experiment. Our estimate of the premium for certified fish is bracketed by 37% and 53% of the value of the conventional fish item—boding well for the potential of certification as a market-mediated solution to transform food systems. The finding that people are willing to upgrade but not willing to down grade, when given a chance, suggests reduced likelihood of dis-adoption once consumers switch to safety certified food products and speaks to the stability of preferences for food safety certification. This finding seems to support the conclusion that certification for food safety is a promising welfare-enhancing intervention in developing countries (see, for example, Ortega et al., Reference Ortega, Wang, Olynk, Wu and Bai2011; Birol et al., Reference Birol, Karandikar, Roy and Torero2015; De Groote et al., Reference De Groote, Narrod, Kimenju, Bett, Scott, Tiongco and Gitonga2016).
Average values hide systematic variation, consistent with reference dependent utility theory. Consistent with existing (lab) evidence, endowments matter for the construction of reference points. On average, willingness to accept for a downgrade is much higher than willingness to pay for an upgrade. However, we also find that some subjects reject the improved product and are willing to exchange for virtually any positive price. We speculate that this may be due to cognitive dissonance, and purposeful avoidance of information that might challenge desired beliefs about the safety of food that subjects routinely eat and prepare for their families. We therefore report evidence of both an endowment effect and a reverse endowment effect within the same experiment.
The literature is divided on the role of expectations as a determinant of reference points. Our evidence is also mixed and rather weak, but we tentatively document an asymmetry in bidding behavior across the two commodities. While expectations with respect to future ownership seem to matter for subjects “trading up” (a marginally significant effect), they are clearly unimportant for subjects who may “trade down”—selling the superior commodity in order to obtain the conventional one. These results are robust to the level of education (attenuating concerns about failure to recognize the game form), concern about food safety, or trust in government certification schemes. We conclude that other factors beyond probabilistic beliefs about future ownership influence valuations for such trades. The potential asymmetry between bidding behavior when trading up and down could be usefully explored further in follow-up research.
Funding
This work received funding from the CGIAR Research Programs (CRP) on Policies, Institutions, and Markets (PIM) led by IFPRI and on Fish Agri-food Systems (FISH). We thank two anonymous reviewers and the handling editor for helpful comments and suggestions.
Data availability
The replication material for the study is available at https://doi.org/10.7910/DVN/VKZTLD
Declarations
Conflict of interest
None.
Ethical approval
Yes.
Informed consent
All participants freely participated and filled out informed consent forms.


 Open access