


I. INTRODUCTION
Dutasteride (Avodart), an oral pharmaceutical approved by the US Food and Drug Administration (USFDA) for the treatment of moderate to severe benign prostatic hyperplasia (BPH) in men, is a potent, selective, and irreversible inhibitor of type 1 and type 2 5α-reductase (5AR) (Andriole et al., Reference Andriole, Bruchovsky, Chung, Matsumoto, Rittmaster, Roehrborn, Russell and Tindall2004). 5AR is the enzyme which catalyzes the formation of androgen dihydrotestosterone (DHT) from its precursor testosterone intracellularly (Clark et al., Reference Clark, Hermann, Cunningham, Wilson, Morrill and Hobbs2004), and therefore is critical for the growth of the prostate gland. Dutasteride has the systematic name (5α,17β)-N-{2,5-bis(trifluoromethyl)phenyl}-3-oxo-4-azaandrost-1-ene-17-carboxamide. A two-dimensional (2D) structural diagram is shown in Figure 1.
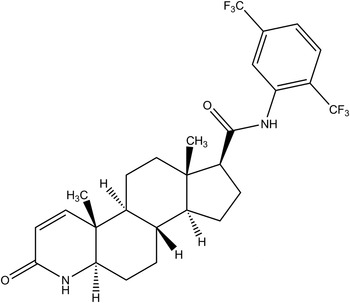
Figure 1. Molecular structure of dutasteride.
The presence of high-quality reference powder patterns in the Powder Diffraction File (PDF) (ICDD, Reference Kabekkodu2013) is important for phase identification, particularly by pharmaceutical, forensic, and law enforcement scientists. The crystal structures of a significant fraction of the largest dollar volume pharmaceuticals have not been published, and thus calculated powder patterns are not present in the PDF-4 Organics database. Sometimes experimental patterns are reported, but they are generally of low quality. Accordingly, a collaboration among the ICDD, IIT, Poly Crystallography Inc., and Argonne National Laboratory has been established to measure high-quality synchrotron powder patterns of commercial pharmaceutical ingredients, to include these reference patterns in the PDF, and determine the crystal structures of these Active Pharmaceutical Ingredients (APIs).
Even when the crystal structure of an API is reported, the single-crystal structure was often determined at low temperature. Most powder measurements are performed at ambient conditions. Thermal expansion (often anisotropic) means that the peak positions calculated from a low-temperature single-crystal structure often differ from those measured at ambient conditions. These peak shifts can result in failure of default search/match algorithms to identify a phase, even when it is present in the sample. High-quality reference patterns measured at ambient conditions are thus critical for easy identification of APIs using standard powder diffraction practices.
II. EXPERIMENTAL
The dutasteride 99% was a commercial material, purchased from AK Scientific (Lot #LC24263), and was used as-received. The white powder was packed into a 1.5 mm diameter Kapton capillary, and rotated during the experiment at ~50 cycles s−1. The powder pattern was measured at beam line 11-BM (Lee et al., Reference Lee, Shu, Ramanathan, Preissner, Wang, Beno, Von Dreele, Ribaud, Kurtz, Antao, Jiao and Toby2008; Wang et al., Reference Wang, Toby, Lee, Ribaud, Antao, Kurtz, Ramanathan, Von Dreele and Beno2008) of the Advanced Photon Source at the Argonne National Laboratory using a wavelength of 0.413 891 Å at 296 K from 0.5° to 50° 2θ with a step size of 0.001° and a counting time of 0.1 s step−1. The pattern was indexed using FOX (Favre-Nicolin and Černý, Reference Favre-Nicolin and Černý2002) and N-TREOR (Altomare et al., Reference Altomare, Giacovazzo, Guagliardi, Moliterni, Rizzi and Werner2000) in EXPO2013 (Altomare et al., Reference Altomare, Camalli, Cuocci, Giacovazzo, Moliterni and Rizzi2009, Reference Altomare, Cuocci, Giacovazzo, Moliterni, Rizzi, Corriero and Falcicchio2013). The systematic absences determined the space group to be P212121 (#19) (a common space group for chiral organic compounds), which was confirmed by successful solution and refinement of the structure. A dutasteride molecule was built and its conformation optimized using Spartan ‘10 (Wavefunction, 2011). The hydrogen atoms were removed, and it was saved as a mol2 file and converted into a MOPAC file using OpenBabel (O'Boyle et al., Reference O'Boyle, Banck, James, Morley, Vandermeersch and Hutchison2011). The structure was solved with EXPO2013 (Altomare et al., Reference Altomare, Camalli, Cuocci, Giacovazzo, Moliterni and Rizzi2009, Reference Altomare, Cuocci, Giacovazzo, Moliterni, Rizzi, Corriero and Falcicchio2013) using simulated annealing.
The Rietveld refinement was carried out using GSAS (Larson and Von Dreele, Reference Larson and Von Dreele2004). Only the 1°–20° portion of the pattern was included in the refinement. The C6H3 phenyl group was refined as a rigid body, and all non-H bond distances and angles were subjected to restraints, based on a Mercury/Mogul Geometry Check (Bruno et al., Reference Bruno, Cole, Kessler, Luo, Motherwell, Purkis, Smith, Taylor, Cooper, Harris and Orpen2004; Sykes et al., Reference Sykes, McCabe, Allen, Battle, Bruno and Wood2011) of the molecule. The Mogul average and standard deviation for each quantity were used as the restraint parameters. The restraints contributed 1.68% to the final χ 2. Isotropic displacement coefficients were refined, and grouped by chemical similarity. The U iso of each hydrogen atom was constrained to be 1.3× that of the heavy atom to which it is attached. The peak profiles were described using profile function #4, which includes the Stephens (Reference Stephens1999) anisotropic strain broadening model. The background was modeled using a three-term shifted Chebyshev polynomial and a four-term diffuse scattering function to describe the scattering from the Kapton capillary and any amorphous content of the sample. The final refinement of 104 variables using 19 087 observations yielded the residuals wRp = 0.1207, Rp = 0.0971, and χ 2 = 3.603. The largest peak (0.44 Å from F34) and hole (0.72 Å from F38) in the difference Fourier map were 0.61 and −0.45 eÅ−3, respectively. The Rietveld plot is included as in Figure 2. The largest errors are in the positions and shapes of low-angle peaks, and probably indicate non-uniformity in the crystallites. A trace of an unidentified impurity phase was present.

Figure 2. (Color online) Observed, calculated, and difference patterns of dutasteride. The red crosses represent the observed data points, the green solid line the calculated pattern, and the magenta line the difference (observed–calculated) pattern. The vertical scale is multiplied by a factor of 8 above 7° 2θ and by a factor of 20 above 14°.
A density functional geometry optimization (fixed experimental unit cell) was carried out using CRYSTAL09 (Dovesi et al., Reference Dovesi, Orlando, Civalleri, Roetti, Saunders and Zicovich-Wilson2005). The basis sets for the H, C, N, and O atoms were those of Gatti et al. (Reference Gatti, Saunders and Roetti1994), and the basis set for F was that of Nada et al. (Reference Nada, Catlow, Pisani and Orlando1993). The calculation used eight k-points and the B3LYP functional.
III. RESULTS AND DISCUSSION
The refined atom coordinates of dutasteride are reported in Table I, and the coordinates from the density functional theory (DFT) optimization in Table II. The root-mean-square (RMS) deviation of the non-hydrogen atoms is 0.14 Å, and the maximum deviation is 0.33 Å, in the CF3 groups (Figure 3). The relatively large displacement coefficient of the CF3 groups suggests that some disorder might be present, but sorting it out is beyond the scope of a powder experiment. The discussion of the geometry uses the DFT-optimized structure. The asymmetric unit (with atom numbering) is illustrated in Figure 4, and the crystal structure is presented in Figure 5.

Figure 3. (Color online) Comparison of the Rietveld-refined and DFT-optimized structures of dutasteride. The RMS difference between the non-hydrogen atom positions is 0.14 Å.

Figure 4. The asymmetric unit of dutasteride, with the atom numbering.

Figure 5. (Color online) Crystal structure of dutasteride. The view is down the a-axis.
Table I. Rietveld refined structure of dutasteride. Space group P212121 (#19), with a = 7.587 44(3), b = 9.960 80(5), c = 33.500 42(12) Å, V = 2531.862(17) Å3, and Z = 4.

Table II. Density functional optimized structure of dutasteride. Space group P212121 (#19), with a=7.587 435, b = 9.960 79, c = 33.500 43 Å, V = 2531.862 Å3, and Z = 4.

Almost all bond distances, angles, and torsion angles fall within the normal ranges indicated by a Mercury Geometry Check. Only the bonds C1–C6 at 1.486 Å [average = 1.430(22), Z-score = 2.57] and C21–N23 at 1.393 Å [average = 1.350(19), Z-score = 2.28], the angles C8–C3–C4 = 114.1 [average = 112.9(6), Z-score = 2.00] C19–C20–C21 = 118.6 [average = 114.1(19), Z-score = 2.42] C27–C28–C29 = 121.8 [average = 117.6(19), Z-score = 2.16], and the torsion angles O22–C21–C20–C19 and C19–C20–C21–N23 fall slightly outside the normal ranges. There are no voids in the crystal structure.
The most prominent feature of the crystal structure is the N2–H41···O7 hydrogen bonds (Table III). They form a zigzag chain parallel to the a-axis (Figure 6). The graph set is C1,1(4). This is a chain of four atoms containing one donor and one acceptor (Etter, Reference Etter1990; Bernstein et al., Reference Bernstein, Davis, Shimoni and Chang1995; Shields, et al., Reference Shields, Raithby, Allen and Motherwell2000). The Mulliken overlap population indicates that these hydrogen bonds are reasonably strong. The average N···O for such hydrogen bonds in the CSD is 2.89(16) Å and the average N–H···O angle is 155(25)°; so these hydrogen bonds are shorter and more linear than the average. The Mulliken overlap populations suggest that there are weak intramolecular C–H···O and C–H···F interactions. Perhaps surprisingly, the amide N23–H67 does not participate in hydrogen bonds; the shortest potential (intramolecular) N23···F contacts are 2.855 and 3.071 Å, to F36 and F34, respectively, but these seem not to represent the real hydrogen bonds. Other than the hydrogen bonds, the crystal structure is dominated by van der Waals contacts.

Figure 6. (Color online) The N2–H41···O7 hydrogen bond pattern.
Table III. Hydrogen bonds in dutasteride.

The Bravais–Friedel–Donnay–Harker (Bravais, Reference Bravais1866; Friedel, Reference Friedel1907; Donnay and Harker, Reference Donnay and Harker1937) morphology suggests that we might expect platy morphology for dutasteride, with {001} as the principal faces. The texture index, modeled using second-order spherical harmonics, was 1.033.
The powder pattern of dutasteride has been submitted to ICDD for inclusion in future releases of the Powder Diffraction File.
ACKNOWLEDGEMENTS
Use of the Advanced Photon Source at the Argonne National Laboratory was supported by the US Department of Energy, Office of Science, Office of Basic Energy Sciences, under Contract No. DE-AC02-06CH11357. This work was partially supported by the International Centre for Diffraction Data. We thank Lynn Ribaud for his assistance in data collection, and Silvina Pagola for her participation in the early stages of this project.
Supplementary Materials and Methods
The supplementary material refered to in this paper can befound online at journals.cambridge.org/pdj.


