Introduction
Iran is estimated to have as many as 7576 plant species (Ghahreman and Attar, Reference Ghahreman and Attar1999), and 12.5% of these are medicinal species (Schippmann et al., Reference Schippmann, Leaman and Cunningham2002). This gene pool is currently under threat because of pasture exploitation, forest degradation and the introduction of intensive agriculture (Taeb, Reference Taeb1996). Bringing wild species into cultivation could help to reduce genetic erosion. This is necessary to develop improved varieties having useful attributes such as high yield, increased nutritional value and important metabolite composition. Comprehensive knowledge about the degree and patterns of within- and between-population genetic variation is an important prerequisite for initiating a breeding programme for medicinal plants.
Milk thistle or Silybum marianum (L.) Gaertn. (family Compositae), a medicinal plant with unique pharmaceutical properties for treating liver diseases, grows throughout various geographical areas in Iran. It is cultivated commercially for seed in Europe, Egypt, China and Argentina (Anonymous, 1995) and recently in a very limited area in Iran. Flavonolignan compounds, called silymarin, are the main basis of Silybum and are mainly found in seeds. Seeds contain 1–4% silymarin, which is a mixture of at least three flavonolignans: silybin, silydianin and silychristin (Murphy et al., Reference Murphy, Caban and Kemper2000). Studies show that the active compounds, flavonolignans, have various effects such as anti-cancer (Davis-Searles et al., Reference Davis-Searles, Nakanishi, Kim, Graf, Oberlies, Wani, Wall, Agraval and Kroll2005; Kroll et al., Reference Kroll, Shaw and Oberlies2007; Zi and Agarwal, Reference Zi and Agarwal1999), anti-cholesterolaemia (Krecman et al., Reference Krecman, Skottova, Walterova, Ulrichova and Simanek1998) and cytoprotection against hepatotoxins (Dvorak et al., Reference Dvorak, Kosina, Walterova, Simanek, Bachleda and Ulrichova2003). They are used especially in the treatment of several liver disorders (Morazzoni and Bombardelli, Reference Morazzoni and Bombardelli1995).
In recent years, herbal remedies and supplements have represented a growing market worldwide. For example, in the United States, milk thistle was the 10th best-selling herbal dietary supplement in 2005 (Blumenthal et al., Reference Blumenthal, Ferrier and Cavaliere2006). Despite worldwide demand for silymarin (18–20 tons per year), research efforts on the domestication and breeding of this plant have been negligible (Ram et al., Reference Ram, Bhan, Gupta, Thaker, Jamwal and Pal2005).
The determination of genetic diversity within and among populations is of great importance for the improvement of medicinal plants. Furthermore, the identification of genetic relationships among populations or genotypes is essential for the efficient utilization of plant genetic resources (Tang et al., Reference Tang, Bin, Peng, Zhou, Wang and Zhong2007). Molecular techniques, especially deoxyribonucleic acid (DNA)-based markers, provide effective tools for comprehensive genetic analysis of diversity and population structure. Among the various marker systems available at present, amplified fragment length polymorphism (AFLP) markers are widely used to study genetic diversity in medicinal plants (Rahimmalek et al., Reference Rahimmalek, Sayed Tabatabaei, Arzani and Etemadi2009; Tang et al., Reference Tang, Bin, Peng, Zhou, Wang and Zhong2007; Tatikonda et al., Reference Tatikonda, Wani, Kannan, Beerelli, Sreedevi, Hoisington, Devi and Varshney2009; Zhu et al., Reference Zhu, Geng, Tersing, Liu, Wang and Zhong2009). AFLP provides multi-locus and genomewide marker profiles. Some efforts have been made to analyse the genetic diversity and population structure in S. marianum using morphological (Shokrpour et al., Reference Shokrpour, Moghaddam, Mohammadi, Ziai and Javanshir2007) and biochemical (Shokrpour et al., Reference Shokrpour, Mohammadi, Moghaddam, Ziai and Javanshir2008) characteristics, but no study is available on the application of DNA-based markers for molecular characterization of S. marianum germplasm.
The present study assesses the molecular diversity in 32 populations of S. marianum, collected from seven provinces of Iran, as well as in two cultivars, using AFLP markers.
Materials and methods
Plant materials
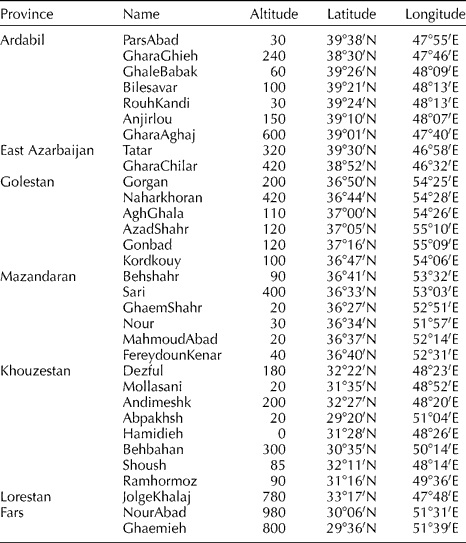
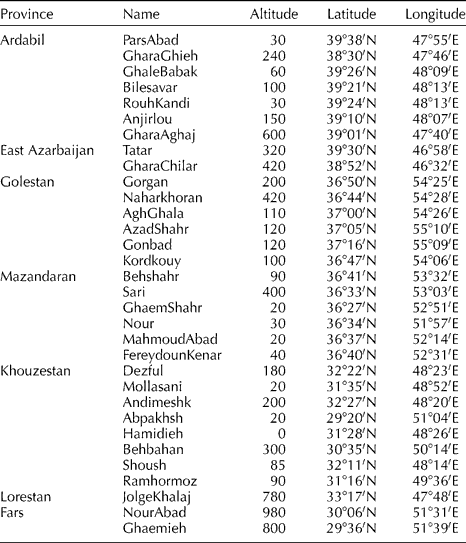
A total of 32 populations were collected from natural habitats of S. marianum in Iran (Table 1), including seven from Ardabil, two from East Azarbaijan, six from Golestan, six from Mazandaran, eight from Khozestan, one from Lorestan and two from Fars province. In addition, two commercial varieties, CN seeds (Ltd., Ely, UK) and Budakalaszi (Budakalasz, Hungary), were used. For each population, fresh leaves from 15 field-grown plants were sampled, and individual plant sample was used for DNA isolation.
Table 1 Geographical location and environmental parameters for 32 populations of S. marianum collected across Iran
AFLP analysis
Total genomic DNA was extracted using the cetyltrimethylammonium bromide method (Saghai-Maroof et al., Reference Saghai-Maroof, Soliman, Jorgensen and Allard1984). The quantity and quality of the extracted DNA were evaluated by 0.8% agarose gel electrophoresis and a spectrophotometer. AFLP analysis was performed as described by Vos et al. (Reference Vos, Hogers, Bleeker, Reijans, Van Delee, Hornes, Frijters, Pot, Peleman, Kuiper and Zabeau1995), except that 200 ng of genomic DNA was digested (3 h) with 1 U each EcoRI and Tru9I (an isoschizomer of MseI; Roche Diagnostic GmbH, Mannheim, Germany). The fragments were ligated with T4 DNA ligase to EcoRI (5 μM) and Tru9I (5 μM) adapters in a final volume of 50 ml at 37°C for 3 h. Pre-amplification reactions were performed with diluted DNA from the ligation reaction along with Tru9I/EcoRI primer pairs without selective nucleotides. Selective amplification was carried out using diluted DNA from the pre-amplification reaction and 64 primer pairs on a test panel of representative samples. After an initial denaturation step at 94°C for 2 min, selective amplification was done for 13 cycles of 30 s at 94°C, 30 s at 65°C with 0.7°C lowering for each cycle and 2 min at 72°C, followed by 24 cycles of 30 s at 94°C, 30 s at 56°C and 2 min at 72°C, and one final cycle of extension at 72°C for 10 min. The final PCR products were mixed with sequencing loading buffer, denatured for 5 min at 94°C and separated on a 6% denaturing polyacrylamide gel using the BioRad Sequi-Gen GT Sequencing Cell; the bands were visualized using silver staining (Bassam et al., Reference Bassam, Caetano-Anolles and Gresshoff1991). Finally, a set of 27 best primer combinations giving a reliable amplification and polymorphism were selected for analysis of all samples.
Data analysis
For statistical analysis, each polymorphic AFLP band was scored as a binary character for its absence (0) or presence (1). Each band was considered as a single and unique locus with Mendelian segregation. Individuals with more than 5% missing data were removed from analysis. Finally, data were compiled as a binomial matrix with 405 individuals and 415 polymorphic loci. The polymorphic information content (PIC) value for each AFLP primer combination was calculated as PICi = 1 − f i(1 − f i), where PICi is the PIC of marker i, f i is the frequency of the ith marker fragment when present and 1 − f i is the frequency of the ith marker fragment when absent (Roldain-Ruiz et al., Reference Roldain-Ruiz, Calsyn, Gilliand, Coll, van Eijk and De Loose2000). The marker index (MI) was calculated for each AFLP primer combination as MI = PIC × EMR, where EMR is ‘the effective multiplex ratio (E) defined as the product of the total number of loci/fragments per primer (n) and the fraction of polymorphic loci/fragments (β) (E = n·β)’ (Tatikonda et al., Reference Tatikonda, Wani, Kannan, Beerelli, Sreedevi, Hoisington, Devi and Varshney2009). Nei's (Reference Nei1978) unbiased genetic distance coefficient was used to estimate the genetic relationships between populations. The total genetic diversity (H T = H S+D ST), as well as that within populations (H S) and among populations (D ST), was also calculated. The proportion of among-population total genetic diversity (G ST) was calculated as the ratio D ST/H T. In addition, gene flow (N m) was estimated by N m = 0.25 × (1-G ST)/G ST. All genetic diversity parameters were estimated by PopGene software version 1.32. Analysis of molecular variance (AMOVA) was performed to partition the molecular genetics variance into components attributable to the variance between and within ecotypes (Excoffier et al., Reference Excoffier, Smouse and Quattro1992). AMOVA was carried out in Arlequin version 3.11 software (Excoffier et al., Reference Excoffier, Laval and Schneider2005). The dendrogram was constructed based on a neighbour-joining algorithm and pairwise unbiased Nei's genetic distances using MEGA V3.0 (Kumar et al., Reference Kumar, Tamura and Nei2004). Principal coordinate analysis (PCoA) was also performed using GenAlEex v6.2 software (Peakall and Smouse, Reference Peakall and Smouse2006).
Results
Marker polymorphism
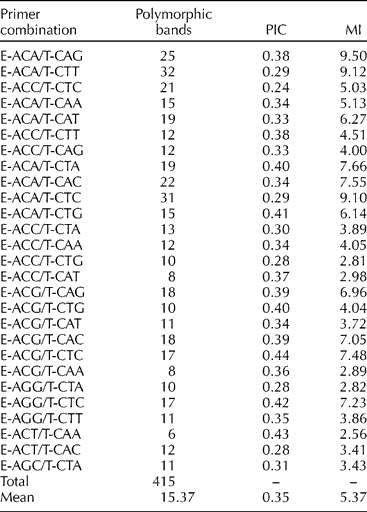
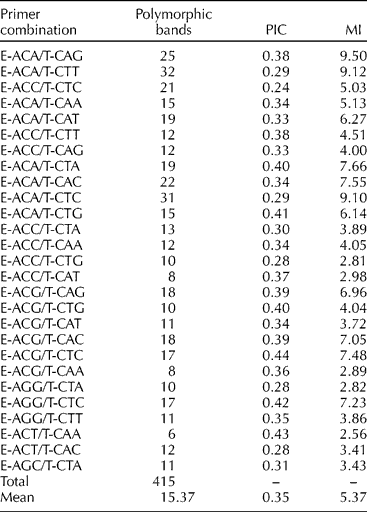
The 27 primer combinations selected from 64 tested pairs produced a total of 415 polymorphic AFLP markers, in the range of 100–700 bp, across 32 S. marianum populations as well as two commercial varieties (Table 2). The number of polymorphic fragments per primer combination ranged from 6 (E-ACT/T-CAA) to 32 (E-ACA/T-CAG), with an average of 15.37. The PIC and MI values for each primer pair are shown in Table 2. The primer combinations E-ACA/T-CTA, E-ACA/T-CTG, E-ACG/T-CTG, E-ACG/T-CTC, E-AGG/T-CTC and E-ACT//T-CAA showed high PIC values (over 0.40), with the highest value for E-ACG/T-CTC (0.44). Moreover, E-ACA/t-CAG, E-ACA/T-CTT and E-ACA/T-CTC showed high MI values (over 9.00). The average values for PIC and MI were 0.35 and 5.37, respectively.
Table 2 AFLP, number of polymorphic bands, PIC and MI per primer combination
Genetic diversity
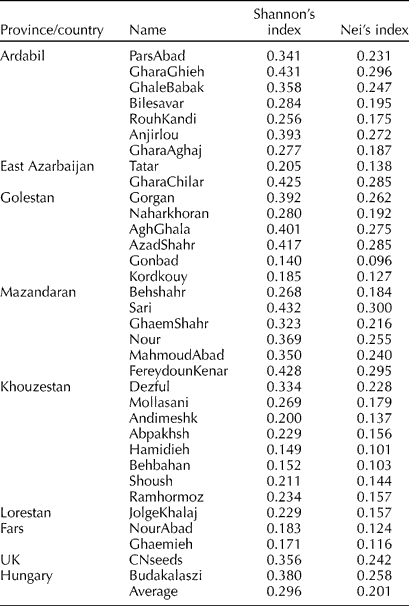
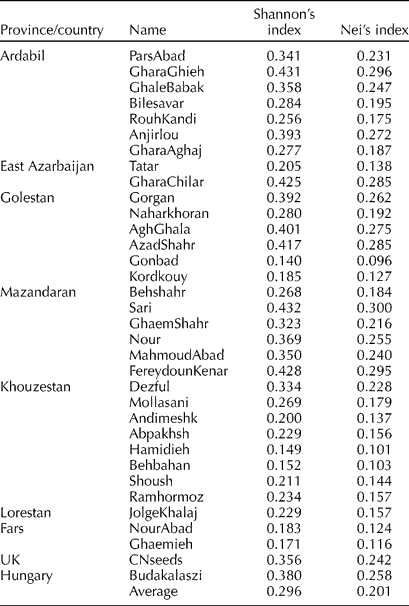
The average Nei's genetic diversity index (H E) and Shannon's diversity index (I) were 0.201 and 0.296, respectively. The highest and lowest within-population genetic diversity was observed in Sari (0.300 and 0.432) and Gonbad (0.096 and 0.140) populations, respectively, as revealed by Nei and Shannon's diversity indices (Table 3). The Hamidieh population also showed high genetic homogeneity.
Table 3 Within-population genetic diversity of 34 S. marianum L. accessions as revealed by Nei's and Shannon's diversity indices
The total gene diversity (H T) over the 34 S. marianum populations was 0.360, the mean diversity within populations (H S) was 0.201 and the coefficient of differentiation among populations (G ST) was 0.440, indicating that 44% of the total molecular diversity resulted from differences between populations. Gene flow among populations (N m) was estimated at 0.318. The distribution of genetic diversity within and between S. marianum populations was explored using AMOVA, which indicated significant variance within and among milk thistle populations. Although, as with G ST, the level of within-population genetic variation was higher than that of among-population genetic variation, and the AMOVA revealed that 72.71% of the total molecular variance is attributable to within-population genetic diversity. Among the populations studied, the maximum genetic distances were observed between Gonbadan from the northwest and Hamidieh, Andimeshk, Shoush as well as Behbahan from southern Iran. This result is an overall relationship with geographical distances of their collection sites. Ghaemshahr and Gorgan populations from northern Iran showed the lowest genetic distance.
Genetic relationships
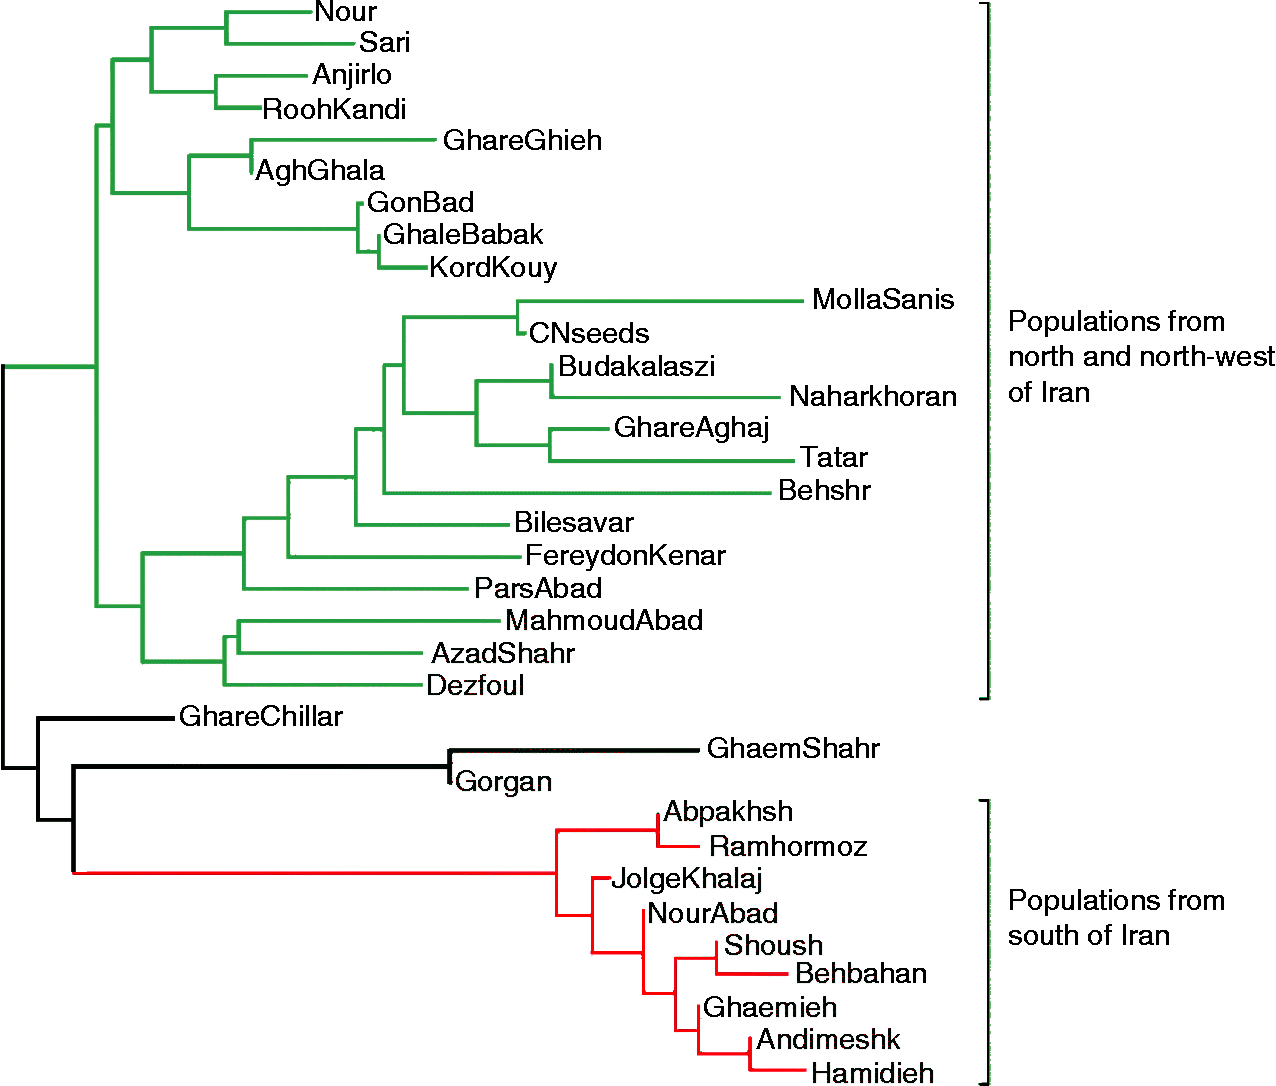
The genetic separation of S. marianum populations based on their geographical regions supported the suitability of the AFLP technique for differentiating closely related populations. In the cluster analysis (Fig. 1), two major preliminary clusters could be identified for S. marianum populations. Group one consisted of two subclusters, including northern and northwestern populations. The populations from northwestern provinces (Ardabil and East Azarbaijan) were grouped in subcluster I, whereas the populations from the northern provinces Golestan and Mazandran were assigned to subcluster II. Group two included populations from the southern provinces. In this clustering, there were some inconsistence between molecular grouping and origin of population. Such that, Dezfoul and Mollasani populations (Khouzestan province from south of Iran) were grouped with the northern and northwestern populations, and Ghachillar (East Azarbayjan province), GhaemShahr (Mazandaran province) and Gorgan (Golestan province) populations were clustered with the southern populations, albeit in a separate subcluster.
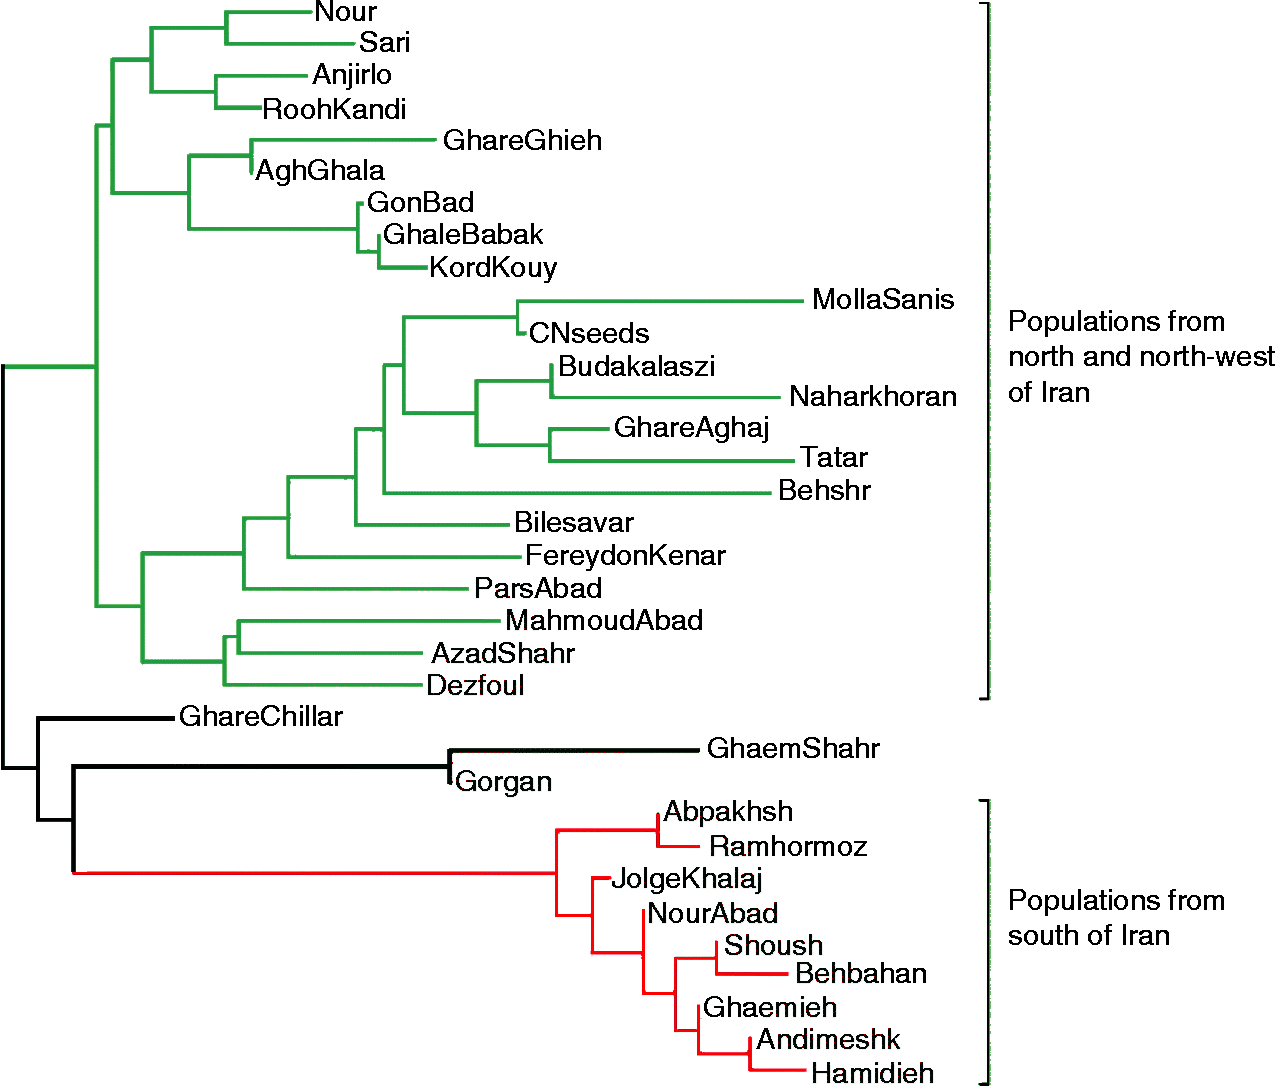
Fig. 1 Neighbour-joining tree for 32 populations and two commercial varieties of S. marianum based on Nei's unbiased pairwise genetic distance.
To understand the genetic relationships of S. marianum populations as individuals, PCoA was also conducted based on the AFLP data matrix of 415 fragments for 34 populations. The scatter plot of the first and second principal components explaining 67% of the total molecular variation showed a clear genetic variation and differentiation pattern for S. marianum populations based on their geographical regions (Fig. 2). There were three separate clusters apparent, consistent with the grouping recovered by neighbour-joining analysis. One more, the two populations from the south (Dezfoul and Mallasani) were positioned outside of the cluster for southern populations, which is indicative of possible introgression.
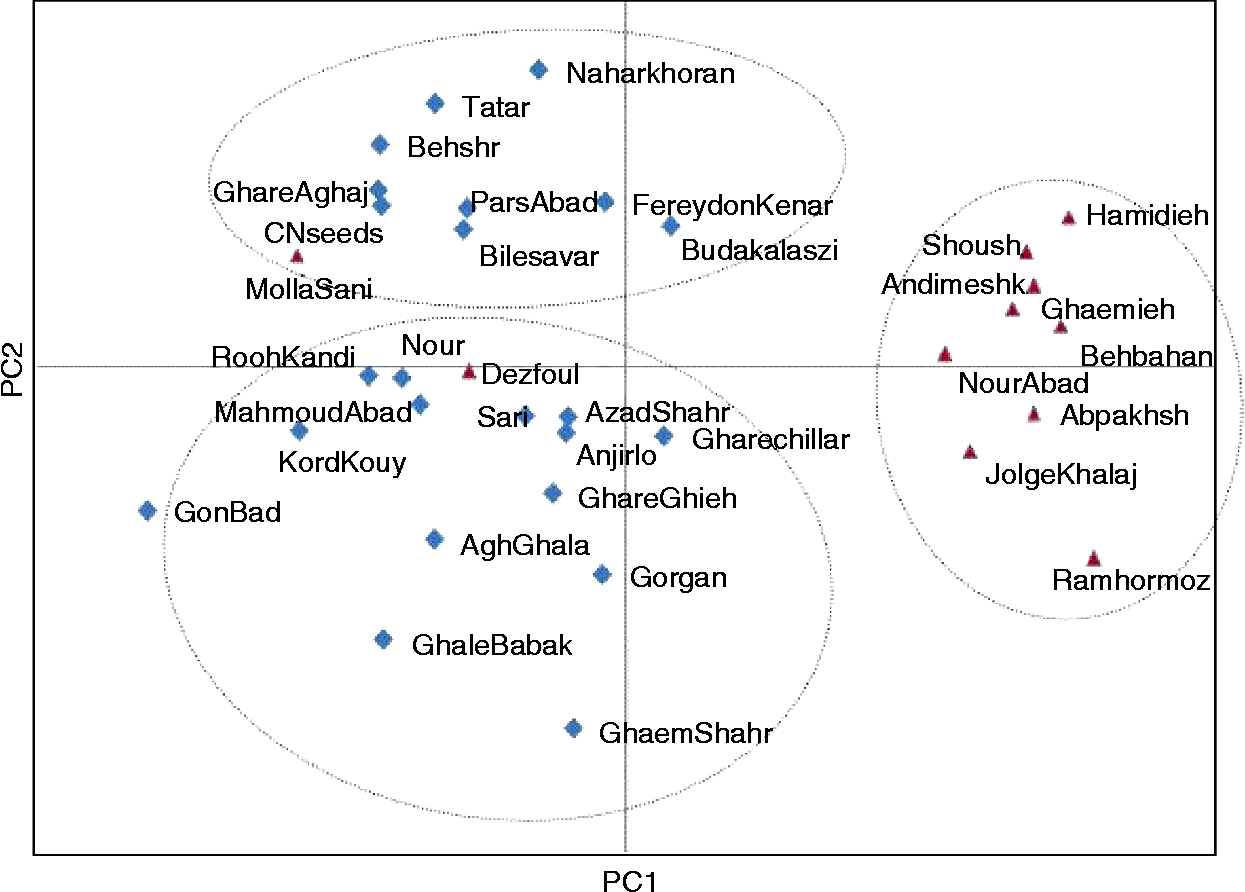
Fig. 2 PCoA of 32 populations and two commercial varieties of S. marianum based on 415 polymorphic AFLP markers.
Discussion
Analysis of genetic variation
Bringing medicinal plants into cultivation necessitates to determine the level of genetic diversity in the wild germplasm and the application of traditional and biotechnological genetic techniques, both to improve yield and uniformity and to modify potency or toxicity. Although S. marianum is among one of the most ancient of all known herbal medicines and its derivatives have been used as herbal remedies for almost 2000 years (Sánchez-Sampedro et al., Reference Sánchez-Sampedro, Peláez and Corchete2008), according to our knowledge, no reports exist on S. marianum genetic diversity at the DNA level on this species. As is the case for other medicinal plant species such as Siraitia grosvenorii (Tang et al., Reference Tang, Bin, Peng, Zhou, Wang and Zhong2007), Jatropha curcas (Tatikonda et al., Reference Tatikonda, Wani, Kannan, Beerelli, Sreedevi, Hoisington, Devi and Varshney2009), Incarvillea younghusbandii (Zhu et al., Reference Zhu, Geng, Tersing, Liu, Wang and Zhong2009) and Achillea species (Rahimmalek et al., Reference Rahimmalek, Sayed Tabatabaei, Arzani and Etemadi2009), AFLP analysis was effective in detecting genetic variation in the S. marianum genome. The efficiency of a molecular marker technique depends upon the amount of polymorphism it can detect among the genotypes under investigation (Tatikonda et al., Reference Tatikonda, Wani, Kannan, Beerelli, Sreedevi, Hoisington, Devi and Varshney2009). High levels of polymorphism were obtained with 27 AFLP primer combinations from the 32 populations collected in seven provinces of Iran as well as two introduced varieties. All populations studied were polymorphic, and AFLP revealed a large number of polymorphic DNA fragments. Schmidt and Jensen (Reference Schmidt and Jensen2000) reported that the accuracy of genetic diversity analysis and genetic differentiation increases with the use of an increasing number of loci.
Discriminatory power of AFLP primer combinations
A number of marker attributes such as PIC and MI have been used in studies to assess the informativeness or discriminatory power of AFLP markers for genetic diversity analysis in medicinal plant species (Rahimmalek et al., Reference Rahimmalek, Sayed Tabatabaei, Arzani and Etemadi2009; Tang et al., Reference Tang, Bin, Peng, Zhou, Wang and Zhong2007; Tatikonda et al., Reference Tatikonda, Wani, Kannan, Beerelli, Sreedevi, Hoisington, Devi and Varshney2009; Zhu et al., Reference Zhu, Geng, Tersing, Liu, Wang and Zhong2009). Although PIC has been used most extensively in the majority of marker-based diversity studies, MI is a convenient estimate for marker efficiency.
Calculating PIC values for different AFLP markers obtained by a particular primer combination revealed an average PIC value of 0.35 across 34 S. marianum accessions, with a range of 0.24–0.44. The maximum PIC value for a biallelic marker such as AFLP is 0.50. In our study, six primer combinations showed PIC values >0.40. It was found that fragments occurring in 40–70% of individuals have high PIC values. For dominant markers such as AFLP, MI together with PIC has been used to assess the informativeness of the markers for medicinal plant species such as Jatropha curcas (PIC = 0.26, MI = 25.13; Tatikonda et al., Reference Tatikonda, Wani, Kannan, Beerelli, Sreedevi, Hoisington, Devi and Varshney2009) and Valerianella locusta (PIC = 0.25, MI = 4.47; Muminovic et al., Reference Muminovic, Melchinger and Lubberstedt2004). In our study of S. marianum, the MI varied from 2.56 to 9.50 with an average of 5.37. In general, the PIC and MI values were comparable with those reported for Valerianella locusta (Muminovic et al., Reference Muminovic, Melchinger and Lubberstedt2004), wheat (Bohn et al., Reference Bohn, Utz and Melchinger1999) and soybean (Powell et al., Reference Powell, Morgante, Andre, Hanafey, Vogel, Tingey and Refalski1996). Various studies compared the utility of restriction fragment length polymorphism, simple sequence repeat (SSR), random amplified polymorphic DNA and AFLP markers for germplasm analysis and reported a high MI for AFLPs compared with other systems (Bohn et al., Reference Bohn, Utz and Melchinger1999; Hongtrakul et al., Reference Hongtrakul, Huestis and Knapp1997; Powell et al., Reference Powell, Morgante, Andre, Hanafey, Vogel, Tingey and Refalski1996; Russell et al., Reference Russell, Fuller, Macaulay, Hatz, Jahoor, Powell and Waugh1997). Therefore, AFLP markers have been recommended for fingerprinting genotypes and genetic diversity analysis especially where codominant markers such as SSRs are not available.
Population diversity and differentiation
The population differentiation in the analysed germplasm was assessed based on genotyping data obtained for all 27 primer combinations, using a neighbour-joining-based phenogram and PCoA. The majority of the populations were grouped in accordance with their geographical locations, with some minor deviation. Congruity between genetic distance and geographical distance has been reported for other plants such as Moringa (Muluvi et al., Reference Muluvi, Sprent, Soranzo, Provan, Odee, Folkard, McNicol and Powell1999), Pistachia (Hormaza et al., Reference Hormaza, Dollo and Polito1994) and barley (Pakniyat et al., Reference Pakniyat, Powell, Baird, Handley, Robinson, Scrimgeour, Hackett, Forster, Nevo and Caligari1997). Furthermore, the grouping pattern of S. marianum populations based on molecular data were in agreement with the pattern reported for the same populations by Shokrpour et al. (Reference Shokrpour, Mohammadi, Moghaddam, Ziai and Javanshir2008) using morphological characteristics. Pairwise genetic distances between S. marianum populations also corresponded well with geographical distances. The maximum genetic distance was observed between Gonbad and Ramhormoz populations from northern and southern Iran, respectively, which also represent a large geographical distance.
The genetic structure patterns of S. marianum populations using both Nei's genetic diversity analysis and AMOVA suggested that within-population genetic variation was higher than the genetic differentiation among populations. Similar patterns of genetic variation were reported for Valerianella locusta (Muminovic et al., Reference Muminovic, Melchinger and Lubberstedt2004), Tunisian fig (Ficus carica L.; Baraket et al., Reference Baraket, Chatti, Saddoud, Mars, Marrakchi, Trifi and Salhi-Hannachi2009) and Caragana microphylla (Chen et al., Reference Chen, Gao, Zhao, Zhao and Zhu2009). It is widely accepted that breeding systems and seed dispersal mechanisms in particular are associated with levels of genetic variation within and among populations (Hamrick and Godt, Reference Hamrick and Godt1996). Seed dispersal is the only mean by which S. marianum spreads. The seeds are equipped with a large pappus that allows effective spreading by wind. Although wind dispersal of seeds may be highly localized, the large pappus of S. marianum seeds allows them to disperse over long distances (kilometers). The long distance tail of seed dispersal distribution may cause gene flow among populations, and even small amounts of gene flow may have significant consequences for the homogenization of genetic variation among populations. At the within-population level, however, localized seed dispersal can generate significant fine-scale genetic structure, even in the face of evolutionarily significant rates of inter-populational gene flow (Chung et al., Reference Chung, Nason and Chung2004; Trapnell et al., Reference Trapnell, Schmidt and Hamrick2008), thereby minimizing the effects of isolation and population differentiation. The large seed pappus in S. marianum may also promote efficient seed exchange, hindering differentiation of populations.
Low within-population genetic diversity in the Gonbad and Hamidieh populations from northern and southern regions of Iran, respectively, could be explained by their specific geographical locations and the direction of dominant winds in the area. Gonbad is located in northeastern Iran and is surrounded by the Caspian Sea from the west, and the wind direction is mostly from west to east. Hamidieh is located at the southwestern border of Iran, and due to the direction of winds in this area, it could be considered as an isolated population such that seeds from nearby locations such as Molasani and Shoush do not infiltrate.
Conclusions
Knowledge of genetic variation and the genetic relationships between genotypes is an important consideration for efficient utilization of germplasm resources. Furthermore, it is important for the optimal design of plant breeding programmes and influencing the choice of genotypes to cross for development of new populations (Russell et al., Reference Russell, Fuller, Macaulay, Hatz, Jahoor, Powell and Waugh1997). The present data on the patterns of genetic variation suggest that milk thistle could be improved for various desirable traits. To date, studies of genetic variation in S. marianum relied on phenotypic and biochemical assays (Ram et al., Reference Ram, Bhan, Gupta, Thaker, Jamwal and Pal2005; Shokrpour et al., Reference Shokrpour, Moghaddam, Mohammadi, Ziai and Javanshir2007; Shokrpour et al., Reference Shokrpour, Mohammadi, Moghaddam, Ziai and Javanshir2008). AFLPs have proven to be a robust and proficient tool to produce large numbers of informative markers that reveal intrapopulation diversity and that estimate the genetic distance between individuals and populations.
Acknowledgements
The present study was funded by the Center of Excellence for Molecular Plant Breeding, Department of Agronomy and Plant Breeding, Faculty of Agriculture, University of Tabriz, Tabriz, Iran, and the Iran National Science Foundation (INSF) (Grant No. 84153).


