


INTRODUCTION
The endemic species Pinna nobilis (Linneaus, 1758) is the largest bivalve of the Mediterranean Sea; the shell exceeds 1 m in length (Richardson et al., Reference Richardson, Kennedy, Duarte, Kennedy and Proud1999; García-March et al., Reference García-March, García-Carrascosa and Peña2002). Fan mussels have a triangular shape (García-March et al., Reference García-March, Pérez-Rojas and García-Carrascosa2007b) and live partially buried in the substrate (García-March et al., Reference García-March, García-Carrascosa and Peña2002; Richardson et al., Reference Richardson, Peharda, Kennedy, Kennedy and Onofri2004). Generally, the sediment covers between one-third (Zavodnik, Reference Zavodnik1967; García-March et al., Reference García-March, Pérez-Rojas and García-Carrascosa2007b) and one-fifth (Richardson et al., Reference Richardson, Kennedy, Duarte, Kennedy and Proud1999) of the shell, depending on substrate type, its compactness (Zavodnik, Reference Zavodnik1967) and shell size (Richardson et al., Reference Richardson, Kennedy, Duarte, Kennedy and Proud1999). Fan mussels anchor themselves in the sediment attaching byssus threads to solid structures buried in the substrate (García-March et al., Reference García-March, Pérez-Rojas and García-Carrascosa2007b).
Pinna nobilis is a long-lived species; Butler et al. (Reference Butler, Vicente and De Gaulejac1993) suggested a maximum age of 20 years, although a 27-year-old specimen was found (Galinou-Mitsoudi et al., Reference Galinou-Mitsoudi, Vlahavas and Papoutsi2006). The species shows one of the fastest shell growth rates (up to 1 mm d−1) recorded for bivalves (Katsanevakis, Reference Katsanevakis2007b). In spite of the high variability of growth curves in the studied Mediterranean populations (Vicente et al., Reference Vicente, Moreteau and Escoubet1980; Richardson et al., Reference Richardson, Kennedy, Duarte, Kennedy and Proud1999; Šiletić & Peharda, Reference Šiletić and Peharda2003; Galinou-Mitsoudi et al., Reference Galinou-Mitsoudi, Vlahavas and Papoutsi2006; Rabaoui et al., Reference Rabaoui, Zouari, Katsanevakis, Kalthoum and Hassine2007), Pinna nobilis is fast-growing during the first three years, thereafter it shows a much slower growth rate (Katsanevakis, Reference Katsanevakis2005 and literature therein). Pinna nobilis has a highly variable recruitment, both on spatial and temporal scale (Katsanevakis, Reference Katsanevakis2007a). Its larval stage lasts 5–10 days (De Gaulejac & Vicente, Reference De Gaulejac and Vicente1990) and settlement occurs mostly during late summer and early autumn (Richardson et al., Reference Richardson, Kennedy, Duarte, Kennedy and Proud1999; Katsanevakis, Reference Katsanevakis2007b). Specimens with a shell height up to 20 cm are considered juveniles (Šiletić & Peharda, Reference Šiletić and Peharda2003). Knowledge of mortality rates during various ontogenetic phases is scarce: for instance, no data are available on the survival rate of the planktonic stages, although information does exist on the decrease of post larval mortality rate with age, due to the lower vulnerability of large individuals to predation (Fiorito & Gherardi, Reference Fiorito and Gherardi1999; García-March et al., Reference García-March, Pérez-Rojas and García-Carrascosa2007b). Higher mortality rates occur during the first year; indeed Katsanevakis (Reference Katsanevakis2007b) suggested a ‘refuge size’ for shell width of about 8 cm.
Pinna nobilis occurs in coastal areas, between 0.5 and 60 m depth, principally on soft sediments colonized by seagrass meadows, such as Posidonia oceanica (Richardson et al., Reference Richardson, Kennedy, Duarte, Kennedy and Proud1999; García-March et al., Reference García-March, García-Carrascosa, Pena Cantero and Wang2007a), Cymodocea nodosa (Richardson et al., Reference Richardson, Peharda, Kennedy, Kennedy and Onofri2004; Centoducati et al., Reference Centoducati, Tarsitano, Bottalico, Marvulli, Lai and Crescenzo2007), Zostera marina and Nanozostera noltii (Katsanevakis, Reference Katsanevakis2005), but also on bare sand (Richardson et al., Reference Richardson, Kennedy, Duarte, Kennedy and Proud1999; Katsanevakis, Reference Katsanevakis2007b; Rabaoui et al., Reference Rabaoui, Zouari, Katsanevakis, Kalthoum and Hassine2007), mud (Richardson et al., Reference Richardson, Kennedy, Duarte, Kennedy and Proud1999), maërl beds (García-March et al., Reference García-March, Sanchís Solsona and García-Carrascosa2008), pebbly bottoms (Zavodnik, Reference Zavodnik1967; Richardson et al., Reference Richardson, Kennedy, Duarte, Kennedy and Proud1999) or among boulders (García-March et al., Reference García-March, Sanchís Solsona and García-Carrascosa2008).
According to the literature, the density of P. nobilis ranges between 0.001 (Centoducati et al., Reference Centoducati, Tarsitano, Bottalico, Marvulli, Lai and Crescenzo2007) and 600 ind. 100 m−2 (De Gaulejac & Vicente, Reference De Gaulejac and Vicente1990; Catsiki & Catsikieri, Reference Catsiki and Catsikieri1992), but typical values are quite low (García-March et al., Reference García-March, García-Carrascosa, Pena Cantero and Wang2007a), and 1 ind. 100 m−2 is the most widespread value found in the Mediterranean populations (Šiletić & Peharda, Reference Šiletić and Peharda2003 and literature therein).
General knowledge of the main constraints which control the population structure of P. nobilis is still incomplete, although previous papers have highlighted specific features concerning spatial distribution. Usually fan mussels have a patchy distribution (Richardson et al., Reference Richardson, Peharda, Kennedy, Kennedy and Onofri2004; Katsanevakis, Reference Katsanevakis2005), a common orientation of the valves is evident in some locations and depth-related size segregation has often been observed (Zavodnik, Reference Zavodnik1967; García-March et al., Reference García-March, García-Carrascosa, Pena Cantero and Wang2007a and literature therein). The patchiness in spatial distribution is associated with optimal habitat availability (e.g. the presence of seagrass meadows); the common orientation of the valves is generally attributed to the increased mortality rate of inadequately oriented individuals in relation to environmental factors (i.e. deep currents or bottom slope) (García-March et al., Reference García-March, García-Carrascosa, Pena Cantero and Wang2007a and literature therein). Depth seems to be one of the most significant factors for explaining population density and size distribution (Katsanevakis, Reference Katsanevakis2005). Higher densities have been recorded at an intermediate depth, within pinnids depth-range, probably due to the decrease of hydrodynamic stress and of illegal catching (García-March et al., Reference García-March, García-Carrascosa, Pena Cantero and Wang2007a,Reference García-March, Pérez-Rojas and García-Carrascosab; Katsanevakis, Reference Katsanevakis2007b). Size distribution is correlated to depth: small specimens are characteristic of shallow areas, whereas the larger ones are more abundant in deep sites. This pattern was initially explained by a hypothetical dislodgement capability of these bivalves (Zavodnik, Reference Zavodnik1967) that would make them capable of moving towards deep sites as they grew older. Nowadays the more supported hypotheses are related to higher mortality of large individuals in shallower waters due to amateur collectors and/or increased hydrodynamic stress compared to deeper sites (García-March et al., Reference García-March, García-Carrascosa, Pena Cantero and Wang2007a,Reference García-March, Pérez-Rojas and García-Carrascosab; Katsanevakis, Reference Katsanevakis2007b).
The total abundance of P. nobilis in the Mediterranean Sea has been significantly reduced during the last decades as a consequence of recreational and commercial fishing, and incidental killing by trawling and anchoring (Richardson et al., Reference Richardson, Peharda, Kennedy, Kennedy and Onofri2004; Katsanevakis, Reference Katsanevakis2005, Reference Katsanevakis2007a,b; Rabaoui et al., Reference Rabaoui, Zouari, Katsanevakis, Kalthoum and Hassine2007). Moreover, this species is also considered vulnerable because of the widespread decline of its common habitat (e.g. P. oceanica meadows), caused by the increasing anthropogenic pressure in the Mediterranean basin (Richardson et al., Reference Richardson, Kennedy, Duarte, Kennedy and Proud1999, Reference Richardson, Peharda, Kennedy, Kennedy and Onofri2004; García-March et al., Reference García-March, Pérez-Rojas and García-Carrascosa2007b). Consequently, P. nobilis has been listed as an endangered species according to the European Council Directive (92/43/EEC: Habitats Directive, Annex IV) and the Barcelona Convention (10/06/95, Annex II). Despite the presence of these protective measures, knowledge of population structure, spatial distribution and abundance is surprisingly scarce (García-March et al., Reference García-March, Pérez-Rojas and García-Carrascosa2007b; Katsanevakis, Reference Katsanevakis2007b; Rabaoui et al., Reference Rabaoui, Zouari, Katsanevakis, Kalthoum and Hassine2007). In order to effectively protect this endangered species, more information about distribution and ecology of all conspicuous P. nobilis populations is needed (Katsanevakis, Reference Katsanevakis2005, Reference Katsanevakis2007a,b). Currently, this lack of information is severe for Italian coasts and particularly in Sardinia where, despite the presence of several conspicuous populations, only few studies about their ecological features have been published (i.e. Porcheddu et al., Reference Porcheddu, Castelli and Romor1998; Caronni et al., Reference Caronni, Cristo and Torelli2007; Addis et al., Reference Addis, Secci, Brundu, Manunza, Corrias and Cau2009).
The present study investigates a P. nobilis population in the northern part of the Gulf of Oristano (western Sardinia, Italy). It focuses on population density and structure, spatial distribution, shell burial and orientation, and percentage of dead individuals. The influence of some environmental factors (i.e. habitat type, meadow coverage, shoot density and matte compactness) on the biological features cited above is also highlighted. This paper provides additional information valuable for the effective management and conservation of this species.
MATERIALS AND METHODS
Study area
The Gulf of Oristano is located on the western coast of Sardinia (Italy) (Figure 1A). The Gulf, which extends over 150 km2 and is 15 m deep in the middle, is characterized by a flat bottom, 70% of which is colonized by Posidonia oceanica (De Falco et al., Reference De Falco, Baroli, Cucco and Simeone2008). The study area, located in the north-western part of the Gulf, is partially included within the Penisola del Sinis-Isola di Mal di Ventre Marine Protected Area (MPA) and the Mistras Site of Community Importance (SCI) (ITB000034) (Figure 1B). The P. oceanica meadow colonizes the sub-horizontal sandy substrate at a minimum depth of 2 m. The meadow is not continuous due to the occurrence of sandy patches, intermatte channels and wide zones of dead matte. The study area extends for about 150 hectares along the coast from Torre Vecchia (39°51.960′N; 008°26.412′E) to Mar Morto (39°53.300′N; 008°27.210′E) (Figure 1C). Despite protection, this area is subjected to an increasing human pressure due to recreational boating and fishing activities.

Fig. 1. Location map of the study area. (A) Western Mediterranean Sea, the arrow indicates the Gulf of Oristano; (B) northern part of the Gulf of Oristano and limits of the Penisola del Sinis-Isola di Mal di Ventre Marine Protected Area and Mistras Site of Community Importance; (C) study area with included sub-areas (Tv, Torre Vecchia; Th, Tharros; Mm, Mar Morto).
Study area characterization
In order to investigate the main characteristics of the seabed, a survey was carried out during summer of 2007. The whole area was divided into 3 sub-areas, Torre Vecchia, Tharros and Mar Morto (Tv, Th and Mm respectively) (Figure 1); the percentage cover of different habitat types (P. oceanica, dead matte and sand) was measured at each sub-area. The percentage cover of habitat types was estimated by means of the point intercept transect (PIT) method (Bianchi et al., Reference Bianchi, Pronzato, Cattaneo-Vietti, Benedetti-Cecchi, Morri, Pansini, Chemello, Milazzo, Fraschetti, Terlizzi, Peirano, Salvati, Benzoni, Calcinai, Cerrano, Bavestrello, Gambi and Dappiano2004) using three random transects within each sub-area. For each transect a 400 m line, marked every 5 m, was rolled down from the coast (2 m depth) toward the open sea. The habitat type was recorded at each fixed point along the transect, and the respective percentages were calculated.
For each sub-area, the meadow density was evaluated at depths of 2 m and 5 m. The number of P. oceanica shoots was counted in 10 replicate quadrats (50 × 50 cm) at each sampling station, and the results were averaged and converted to the square metre.
The compactness of live matte was assessed by means of 10 replicate strokes of a penetrameter at each sampling station. The penetrameter is composed of a tripod base and a 2 m long rod, 8 mm in diameter. The rod was placed inside the base perpendicular to the bottom, and a 5 kg weight was dropped 50 cm onto a stop in the middle of the rod. The impact of the weight hitting the stop provided a constant force in order to drive the rod into the rhizome matte. Results were averaged and compactness was defined according to Francour et al. (Reference Francour, Ganteaume and Poulain1999): strong (penetration <50 cm), medium (penetration between 50 and 100 cm) and weak (penetration >100 cm).
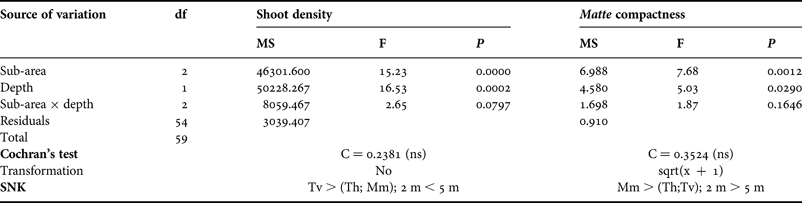
Two-way analysis of variance (ANOVA) on shoot density and matte compactness was carried out in order to test for any significant differences between sub-areas and depths. Cochran's test was used to test for the homogeneity of variances and data were transformed when necessary (Underwood, Reference Underwood1997). Post hoc comparisons, by mean of the Student–Newman–Keuls (SNK) test, were carried out in case of significant differences from ANOVA.
Pinna nobilis population analysis
The survey was performed by means of SCUBA diving between June and July 2007. Twenty, 400 m long, strip transects perpendicular to the coastline and spaced at about 150 m from each other were explored from the 2 m bathymetric line. A pair of divers recorded and measured the individuals of P. nobilis encountered within a 2 m corridor for both sides of each 400 m line; thus the surveyed area was about 1600 m2 per transect. For each P. nobilis specimen observed, minimum width (w) and unburied length (UL) were measured by means of a multi-calliper (García-March et al., Reference García-March, García-Carrascosa and Peña2002); shell orientation (Or) was determined using an underwater compass and considering the magnitude of the angle α formed by the vector Or and the magnetic north (Figure 2). The specimen status (dead or alive), the exact depth (by using the electronic depth meter of a diving computer), and the type of substrate (P. oceanica, dead matte, sand or P. oceanica edge) were recorded. In addition, the geographical coordinates were marked for each individual along the transect; to do this a positively buoyant messenger was sent up to the surface in order to record the exact position from the boat by means of a Global Positioning System (GPS).

Fig. 2. Biometry of Pinna nobilis (w, minimum width; UL, unburied length; HT, total length; Or, orientation direction).
Total shell height (HT) was estimated according to García-March & Ferrer Ferrer (Reference García-March and Ferrer Ferrer1995): HT = (1.79 w+ 0.5±0.2)+UL. This formula was considered suitable for populations of different areas (Šiletić & Peharda, Reference Šiletić and Peharda2003).
The shell orientation measurements were grouped in the following four sectors: north-east (1°–90°), south-east (91°–180°), south-west (181°–270°) and north-west (271°–360°). In order to test the occurrence of preferential valve directions, orientation distributions were compared to a uniform distribution by means of a Chi-square test considering subareas and habitat types. The sand areas were excluded from this analysis because of the low sample size (only five P. nobilis were recorded on sand).
The Kruskal–Wallis test was applied to test whether density, shell size, percentage of dead individuals and burial level of the shell significantly varied between sub-areas. The burial level of the shell was estimated as percentage of the difference between the estimated HT and the measured UL. Another Kruskal–Wallis test was performed in order to investigate if this burial level significantly varied depending on habitat types. Moreover, for each subarea a Chi-square test was applied in order to analyse if percentage of dead individuals was homogeneous between habitat types. Again, because of the small sample size, sand areas were excluded from the analysis. In addition, the Chi-square test was applied in order to investigate whether P. nobilis colonizes preferentially the edge of the P. oceanica meadow. In order to perform this analysis, we assumed, using the most conservative approach that the surface of the meadow was equal to the area delimited by its edge.
The spatial distribution of individuals in the surveyed area was investigated using the GPS data on individuals' position and the ArcGIS 9.2 ESRI program. Each transect was subdivided in 8 cells (50 × 4 m) and the Morisita's index (MI) was calculated for each transect and subarea (excluding transects 7 and 14, considered as boundaries between adjacent sub-areas). In addition, the standardized Morisita's index (MIS) was used with the whole data set (Bakus, Reference Bakus2007).
In order to detect potential significant differences between sub-areas based on some features of pinnids, a canonical discriminant analysis (Canonical Analysis of Principal coordinates (CAP)) was performed by subdividing each transect in 4 cells (100 × 4 m) (Anderson & Robinson, Reference Anderson and Robinson2003; Anderson & Willis, Reference Anderson and Willis2003). For each cell, the number of individuals, substrate type, main orientation, mean width, mean total length and mean depth were the variables under consideration.
RESULTS
Study area features
The study site is characterized by the dominance of a Posidonia oceanica meadow which in Mar Morto occupied more than 80% of the area (Figure 3). A general trend of increase in P. oceanica cover was evident from Torre Vecchia to Mar Morto, whereas the presence of dead matte had the opposite effect. The sand extension was comparable for all sub-areas and corresponded to about the 20% of the total cover (Figure 3).

Fig. 3. Percentage cover of different substrates (i.e. Posidonia oceanica, sand and dead matte) in the sub-areas considered (Tv, Torre Vecchia; Th, Tharros; Mm; Mar Morto).
The mean shoot density of the meadow ranged between 244±16 (mean±SE) and 391±21 shoots m−2 (in Mm 2 m depth and Tv 5 m depth, respectively) (Figure 4); these values are very low compared to those recorded in other Mediterranean areas at the same depths and, according to Pergent et al. (Reference Pergent, Pergent-Martini and Boudouresque1995), they correspond to a meadow of abnormal density. The analysis of variance showed significant differences in the number of shoots for both sub-area and depth (Table 1). Post hoc comparisons (SNK) highlighted that Tv had a higher shoot density in comparison with Th and Mm; moreover a significantly higher number of shoots was recorded, at 5 m depth than at 2 m depth (Table 1; Figure 4).

Fig. 4. Meadow density per sub-areas (Tv, Torre Vecchia; Th, Tharros; Mm, Mar Morto) and depths.
Table 1. Results of analyses of variance and Student–Newman–Keuls (SNK) tests on shoot density and matte compactness.
ns, not significant.
The mean compactness of matte ranged between 29±4 cm (Th, 5 m depth) and 55±6 cm (Mm, 2 m depth) (Figure 5). Based on the Francour et al. (Reference Francour, Ganteaume and Poulain1999) scale, all sites were characterized by strong compactness, except for Mm at 2 m depth that presented a medium level of compactness. Matte compactness varied significantly between sub-areas and depths (Table 1). In particular, Mm showed higher penetrability values in comparison with the other sub-areas, and was less compact at 2 m depth than at 5 m depth (Table 1; Figure 5).

Fig. 5. Matte compactness per sub-areas (Tv, Torre Vecchia; Th, Tharros; Mm, Mar Morto) and depths.
Pinna nobilis population
A total of 310 live Pinna nobilis was recorded, corresponding to 1±0.2 ind. 100 m−2 (mean±SE) population density. Population density varied significantly between sub-areas: Th showed higher mean values of abundance than Tv and Mm (Figure 6). Moreover, P. nobilis density of individuals differed among substrates: one hundred and eighty-two specimens were located on the P. oceanica edge, and this marginal zone was the site more inhabited by this species (Table 2), as demonstrated by the result of the Chi-square test (χ2 = 4.99, P < 0.0001, df = 1). Dead matte substrate supported a higher population density (3.8 ind. 100 m−2) than P. oceanica (0.3 ind. 100 m−2) or sand (0.1 ind. 100 m−2).

Fig. 6. Density of Pinna nobilis (□ = 25%–75%; □ = median; ![]() = minimum–maximum) per sub-areas (Tv, Torre Vecchia; Th, Tharros; Mm, Mar Morto). Statistical differences among sub-areas are reported (**, P < 0.01; ns, not significant).
= minimum–maximum) per sub-areas (Tv, Torre Vecchia; Th, Tharros; Mm, Mar Morto). Statistical differences among sub-areas are reported (**, P < 0.01; ns, not significant).
Table 2. Number of recorded Pinna nobilis per substrate (P, Posidonia oceanica; S, sand; M, dead matte; Edge, P. oceanica edge: boundary between P. oceanica and sand or dead matte). The surface area of each substrate was calculated from the mean values obtained from the point intercept transects.
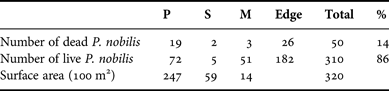
Moreover, 50 dead P. nobilis individuals were recorded along the transects; this number corresponded to 14% of the total sampled (Table 2). The Kruskal–Wallis test showed significant differences in percentage of dead individuals between sub-areas: Mm had significantly higher values than Th and Tv (Figure 7). Th showed the highest variability and, although no significant differences were detected when compared with Tv, a general growing trend was evident from Tv to Mm (Figure 7). The Chi-square test highlighted that although the number of dead individuals did not differ between habitat types in Tv, there was higher value than expected within the meadow in Th, and a high number of dead specimens was recorded within the meadow, but mainly on the edge of the meadow in Mm (Table 3).

Fig. 7. Percentage of dead individuals of Pinna nobilis (□ = 25%–75%; □ = median; ![]() = minimum–maximum) per sub-areas (Tv, Torre Vecchia; Th, Tharros; Mm, Mar Morto). Data were arc-sin transformed (Zar, Reference Zar1999). Statistical differences among sub-areas are reported (*, P < 0.05; ns, not significant).
= minimum–maximum) per sub-areas (Tv, Torre Vecchia; Th, Tharros; Mm, Mar Morto). Data were arc-sin transformed (Zar, Reference Zar1999). Statistical differences among sub-areas are reported (*, P < 0.05; ns, not significant).
Table 3. Result of Chi-square test (O, observed frequencies; E, expected frequencies) to test Pinna nobilis dead individuals according to habitat types (P, Posidonia oceanica; M, dead matte; Edge, P. oceanica edge) and sub-areas.

The population structure showed a bimodal distribution (Figure 8): the first mode corresponded to the 20–25 cm size-class, the second one (individuals 60–65 cm high) was more marked. In order to assess whether depth could have had a relevant role in influencing population structure, the study area was divided into 2 depth zones (1–3.5 m and 3.6–6 m). The corresponding size distributions are shown in Figure 8A: despite the higher abundance in the deeper zone, no significant difference in population structure was found. On the other hand, different patterns were observed when considering the 3 sub-areas (Figure 8B): Tv was characterized by small-size individuals (10–30 cm) and large pinnids were substantially absent. This size distribution was significantly different (Kruskal–Wallis test, P < 0.01) when compared to Th and Mm (Figure 8B). Th showed the same trend described for the global population distribution, with two peaks clearly represented. In Mm small sizes were lacking and individuals with a size-range between 55 and 70 cm prevailed in this sub-area.

Fig. 8. Percentage frequencies of size-classes (5 cm) in populations of Pinna nobilis according to depth levels (A) and sub-areas (B).
In addition, the burial level of the shell contributed to differentiate the 3 sub-areas, showing a significant decreasing trend from Tv to Mm (Kruskal–Wallis test; P < 0.001). This result pointed out a marked spatial pattern in shell burial capability of P. nobilis, with Mm specimens less-deeply buried in the seabed (Figure 9). Regarding substrate type, the Kruskal–Wallis test showed more-deeply buried individuals into the dead matte than in live P. oceanica (inside the meadow or on the edge; Figure 10).

Fig. 9. Burial level (%) of the shells of Pinna nobilis (□ = 25%–75%; □ = median; ![]() = minimum–maximum) per sub-areas (Tv, Torre Vecchia; Th, Tharros; Mm = Mar Morto). Data were arc-sin transformed (Zar, Reference Zar1999). Statistical differences among sub-areas are reported (***, P < 0.001).
= minimum–maximum) per sub-areas (Tv, Torre Vecchia; Th, Tharros; Mm = Mar Morto). Data were arc-sin transformed (Zar, Reference Zar1999). Statistical differences among sub-areas are reported (***, P < 0.001).

Fig. 10. Burial level (%) of the shells of Pinna nobilis (□ = 25%–75%; □ = median; ![]() = min-max) per habitat types (P, Posidonia oceanica; M, dead matte; Edge, P. oceanica edge). Data were arc-sin transformed (Zar, Reference Zar1999). Statistical differences among sub-areas are reported (***, P < 0.001; ns, not significant).
= min-max) per habitat types (P, Posidonia oceanica; M, dead matte; Edge, P. oceanica edge). Data were arc-sin transformed (Zar, Reference Zar1999). Statistical differences among sub-areas are reported (***, P < 0.001; ns, not significant).
The results of the Chi-square test showed that it was possible to discard random shell orientation in two subareas only (Table 4). Significant differences were recorded in Tv (P < 0.05) and in Th (P < 0.001): in Tv, specimens were preferentially oriented toward the third quadrant, whereas in Th pinnids were oriented toward the first and fourth quadrant (Table 4).
Table 4. Result of Chi-square test for the analysis of differences in shell orientation within sub-areas (O, observed frequencies; E, expected frequencies).

The data on P. nobilis dispersion highlighted an aggregated distribution of individuals. The values of MI calculated for each transect showed a clumped dispersion in 14 cases (Table 5). The same index, when considering the sub-areas, always showed an aggregated distribution of pinnids (Table 5). Moreover, this spatial pattern was confirmed by Morisita's standardized index (MIS = 0.505) independent from sample size.
Table 5. Results of Morisita's index (MI). Note that transects 7 and 14 were considered as the limits between sub-areas (Tv, Torre Vecchia; Th, Tharros; Mm, Mar Morto).

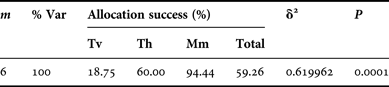
The result of the CAP test (Canonical Analysis of Principal coordinates) indicated a significant effect (P = 0.0001) of pinnid features on the degree of separation among sub-areas with a squared canonical correlation of δ2 = 0.62 (Table 6). Mm showed a percentage of allocation success (94%) higher than Th (60%) and Tv (19%), resulting in a better characterized sub-area as a group. In other words, the fan mussels recorded in Mm exhibited more homogeneous features, which further contributed to the peculiarity of this sub-area in relation to the other ones. This separation among sub-areas may be also observed in the corresponding CAP scatter plot (Figure 11). Here the samples are well parted, with Mm individuals mostly on the left side, Tv on the right side, and Th, exhibiting intermediate features, in the middle part of the plot.

Fig. 11. Scatter plot of the canonical axes for the Canonical Analysis of Principal coordinates (CAP) discriminant analysis.
Table 6. Results of Canonical Analysis of Principal coordinates (CAP). m, number of principal coordinate axes used in the CAP procedure; %Var, percentage of the total variation explained by the first m principal coordinate axes. Allocation success, percentage of points correctly allocated in each group; δ2, squared canonical correlation; Tv, Torre Vecchia; Th, Tharros;. Mm, Mar Morto.
DISCUSSION
The population density of Pinna nobilis in the northern part of the Gulf of Oristano, corresponded to 1±0.2 ind. 100 m−2, which is in line with the most common value found in the Mediterranean populations (Šiletić & Peharda, Reference Šiletić and Peharda2003 and literature therein). However our results are more than 6 times lower than those obtained by Addis et al. (Reference Addis, Secci, Brundu, Manunza, Corrias and Cau2009) in the same gulf (i.e. 6.3 ind. 100 m−2). In the literature concerning other areas, the recorded densities range from 0.001 (Centoducati et al., Reference Centoducati, Tarsitano, Bottalico, Marvulli, Lai and Crescenzo2007) to 600 ind. 100 m−2 (De Gaulejac & Vicente, Reference De Gaulejac and Vicente1990; Catsiki & Catsikieri, Reference Catsiki and Catsikieri1992). This high variability could depend on the aggregated distribution of this species, but sampling bias could be also responsible. Density may be overestimated when the sampling areas with no specimens are excluded from the mean estimate or when the investigated area coincides with the patches with the highest population densities (e.g. Galinou-Mitsoudi et al., Reference Galinou-Mitsoudi, Vlahavas and Papoutsi2006; Centoducati et al., Reference Centoducati, Tarsitano, Bottalico, Marvulli, Lai and Crescenzo2007). When the study species is distributed in clumps, the selection of both a properly surveyed area size and a suitable sampling method is essential for an accurate knowledge of abundance and distribution of individuals. In our case, a preliminary survey was crucial in designing the areas the divers had to monitor. In order to facilitate the detection of individuals it seemed appropriate to choose for each transect an area only 2 m wide and covered by rare P. oceanica.
The results of population density showed significant differences between substrates and sub-areas. Specimens were mostly located on the P. oceanica edge. Density was higher within dead matte than inside the meadow, whereas bare sand showed the lowest values. This typical pattern could be due to the specific features of substrates, which cause different survival rates and therefore, highly variable densities. For example, P. oceanica allows a solid anchorage and an effective protection of pinnids (García-March, Reference García-March2003), unlike bare sand. Marginal zones, however, could be a good compromise between the need for a certain level of protection and the need for efficiency in the filtering activity. As it is reported in literature (Bologna & Heck, Reference Bologna and Heck1999 and references therein), suspension feeding organisms living along habitat edges may experience higher food fluxes compared with those in the inner part of the meadows. The same pattern observed for P. nobilis was found by Bologna & Heck (Reference Bologna and Heck1999) in their research on the density of Argopecten irradians on meadow scale in Florida. Scallops were significantly more abundant at edges of Thalassia testudinum beds than in their interior or in nearby unvegetated sediment. These authors suggest that scallops living along the edges of grass beds have an advantage in obtaining food resources but that they are confronted by a trade off between increased growth rates and increased predation mortality. Understanding how the landscape mosaic of a P. oceanica meadow and particularly its edge, influences the pattern of survivor and distribution of P. nobilis is a fundamental issue for the conservation of this species.
The assumption on the greater survival of P. nobilis on the edge of P. oceanica agrees with the results of P. nobilis distribution analysis and shell orientation. The aggregated distribution suggests that despite the presence of an extensive meadow, the seabed is sufficiently heterogeneous to create patches which are more or less advantageous for the growth of P. nobilis. These favourable microhabitats match the sites where specimens are clumped. Shell orientation was random in Mar Morto in agreement with the results of Addis et al. (Reference Addis, Secci, Brundu, Manunza, Corrias and Cau2009), but common shell orientations were recorded in Tharros and Torre Vecchia. A common orientation should be expected when hydrodynamism is a key factor (García-March et al., Reference García-March, Pérez-Rojas and García-Carrascosa2007b). In the northern part of the Gulf of Oristano no selective pressure on the population could possibly be present due to a slow water flow. Indeed, this area is one of the few locations sheltered from the Mistral, the prevailing wind which blows along the western Sardinian coasts (Cucco et al., Reference Cucco, Perilli, De Falco, Ghezzo and Umgiesser2006). The different distribution of shell orientations detected at sub-area scale is probably due to local seabed profiles and small-scale water circulation, but oceanographic data would be necessary in order to confirm this hypothesis.
Significant differences in population density were evident among sub-areas: the highest value was recorded in Tharros. Tharros had intermediate values of percentages cover of P. oceanica and dead matte in comparison with the other sub-areas. Moreover, Tharros had a matte compactness similar to that of Torre Vecchia (the second sub-area per density of pinnids), but a lower meadow density. Since P. nobilis does not suffer hydrodynamic stress in the study area, the water speed attenuation due to P. oceanica leaves is probably not relevant. Ultimately, the results indicate that, within the meadow, substrate type, seabed compactness and shoot density are the variables that mainly contribute in determining the actual densities and distribution patterns of P. nobilis. Other factors not considered in this study could be of great relevance (e.g. predation, and water circulation at different spatial scales).
Size population structure showed a bimodal distribution with the first modal class lower than the second one. This pattern had never been found in the Mediterranean Sea, where unimodal distributions (e.g. Šiletić & Peharda, Reference Šiletić and Peharda2003; García-March et al., Reference García-March, García-Carrascosa, Pena Cantero and Wang2007a) or plurimodal curves with decreasing peaks (Katsanevakis et al., Reference Katsanevakis, Thessalou-Legaki, Karlou-Riga, Lefkaditou, Dimitriou and Verriopoulos2007) had been previously recorded. The investigated area was characterized by a mature population mainly composed of large size specimens (>60 cm), that could be from 9, according to Vicente et al. (Reference Vicente, Moreteau and Escoubet1980) and Richardson et al. (Reference Richardson, Kennedy, Duarte, Kennedy and Proud1999), to 23 years old and more, according to Galinou-Mitsoudi et al. (Reference Galinou-Mitsoudi, Vlahavas and Papoutsi2006). The first mode (20–25 cm) could correspond to specimens aged between 1 and 6 years old (Vicente et al., Reference Vicente, Moreteau and Escoubet1980; Richardson et al., Reference Richardson, Kennedy, Duarte, Kennedy and Proud1999; Šiletić & Peharda, Reference Šiletić and Peharda2003; Galinou-Mitsoudi et al., Reference Galinou-Mitsoudi, Vlahavas and Papoutsi2006; Rabaoui et al., Reference Rabaoui, Zouari, Katsanevakis, Kalthoum and Hassine2007). Moreover, the dimension class that was almost completely lacking in the Gulf of Oristano (30–45 cm) could include 2–12-year-old individuals, according to Richardson et al. (Reference Richardson, Kennedy, Duarte, Kennedy and Proud1999) and to Galinou-Mitsoudi et al. (Reference Galinou-Mitsoudi, Vlahavas and Papoutsi2006). Despite the high variability of P. nobilis growth rate among Mediterranean populations, these observations suggest that, for a time period ranging from 1 (Richardson et al., Reference Richardson, Kennedy, Duarte, Kennedy and Proud1999) to 6 years (Galinou-Mitsoudi et al., Reference Galinou-Mitsoudi, Vlahavas and Papoutsi2006), recruitment might not have been successful in the Gulf of Oristano, due to lack of larvae or high post-settlement mortality. Although long-term studies of other Mediterranean populations demonstrated the failure of juvenile supply for a single year (Šiletić & Peharda, Reference Šiletić and Peharda2003; Katsanevakis et al., Reference Katsanevakis, Thessalou-Legaki, Karlou-Riga, Lefkaditou, Dimitriou and Verriopoulos2007), the scarcity of a wide range of sizes observed in our study suggests the possibility of subsequent years of difficulty in population recovery. In order to understand the degree of variability in recruitment success of P. nobilis, pluriannual studies on recruitment and population dynamic are necessary. The population size structure of Torre Vecchia was significantly different in comparison with the other sub-areas. Torre Vecchia had a larger percentage of small specimens, suggesting a higher resilience of P. nobilis in this sub-area. This pattern observed in Torre Vecchia was comparable to the population structure detected by Addis et al. (Reference Addis, Secci, Brundu, Manunza, Corrias and Cau2009) for the estuarine area of the Gulf of Oristano indicating the presence of more than one area potentially suitable for the success of the species.
In the study area, the population structure evidenced no differences with depth. Actually, due to Gulf morphology and sampling methodology, the study did not consider depths over 6 m. Therefore, the lack of a substantial depth gradient might have prevented the detection of any differences, as highlighted in other Mediterranean locations (García-March et al., Reference García-March, García-Carrascosa, Pena Cantero and Wang2007a; Katsanevakis et al., Reference Katsanevakis, Thessalou-Legaki, Karlou-Riga, Lefkaditou, Dimitriou and Verriopoulos2007).
Data on the percentage of dead individuals indicated that 14% of recorded specimens were dead: this value is low when compared to other locations, though few studies focused on this topic. In Mar Grande (Ionian Sea) Centoducati et al. (Reference Centoducati, Tarsitano, Bottalico, Marvulli, Lai and Crescenzo2007) found a mortality of 78.46%, mostly imputable to pollution and anthropogenic pressure. The value of mortality recorded in Moraira (Spain, western Mediterranean) peaked to 44.4% (dead ind. year−1) and hydrodynamic stress was considered the main cause (García-March et al., Reference García-March, García-Carrascosa, Pena Cantero and Wang2007a). Differences in percentage of dead individuals recorded among subareas could be explained by substrate type. This result agrees with the hypothesis that specific features of substrates may cause different survival rates. However, more information is necessary in order to evaluate the possible additive or synergistic effects of other ecological factors affecting the survival of individuals. The significant higher values recorded in Mar Morto may be related to the closeness of the Mistras and Cabras lagoons. The input of fine sediment from neighbouring lagoons into the gulf (Como et al., Reference Como, Magni, Casu, Floris, Giordani, Natale, Fenzi, Signa and De Falco2007) should account for the lower matte compactness recorded in Mar Morto. High levels of silt content and suspended sediment could have contributed to the high number of dead specimens and the recruitment failure in this sub-area. The excess of sediment loading may damage the cilia of fan mussels reducing their respiration and feeding activities (Katsanevakis, Reference Katsanevakis2005; García-March et al., Reference García-March, Sanchís Solsona and García-Carrascosa2008); similar detrimental effects have been reported for Atrina zelandica (García-March et al., Reference García-March, Sanchís Solsona and García-Carrascosa2008 and literature therein). The burial level of the shells seems to confirm this hypothesis. The significant decreasing trend in burial level observed from Torre Vecchia to Mar Morto pinnids is a likely response to high fine sediment content. This compensatory response for avoiding detrimental effects on gills could lead to shell instability and could account for the highest number of dead individuals detected in Mar Morto. A high vulnerability of pinnids which are not deeply burrowed in sediment was reported by Richardson et al. (Reference Richardson, Kennedy, Duarte, Kennedy and Proud1999). The pattern previously described from Tv to Mm could be strengthened by the decreasing percentage cover of dead matte that determines a significant increase of burial level of the shell even if the dead matte did not exceed 10% of the total surface in all subareas. However, our hypothesis about the importance of suspended sediment on pinnids survival contrasted with the findings of Addis et al. (Reference Addis, Secci, Brundu, Manunza, Corrias and Cau2009), hence more data are necessary in order to define the influence of lagoons on the success of the P. nobilis population.
The CAP analysis shows that, despite the fact that the three sub-areas represent a geographical continuum differences in the features of pinnids determined a significant separation among groups, even though squared canonical correlation is not very high. In particular, Torre Vecchia had a moderate P. nobilis density and few dead individuals, specimens were small, deeply buried and directionally oriented. Tharros presented the highest density with the prevalence of large sizes, although small specimens were present, pinnids were deeply buried and directionally oriented; data on dead individuals were variable, although low values were prevalent. At Mar Morto, the lowest population density and the highest percentage of dead specimens were recorded; individuals were large, randomly oriented and less deeply buried. These findings also suggested that Mar Morto is probably no longer a suitable area for survival and growth of a long-lasting population of P. nobilis. This hypothesis is also confirmed by the present scarcity in pinnid recruitment in this sub-area.
This study contributes to increase the knowledge of the P. nobilis population in the Gulf of Oristano. It provides useful information for the management and conservation of this species and its habitat. Since the specimens are mostly distributed on the edge between P. oceanica and sand patches, the common practice of anchoring on sandy patches within the meadow in order to reduce the impact on P. oceanica has proven to be effective for the preservation of the plant, but not for P. nobilis. Hence, the compulsory use of buoy fields, already present along the coast, is recommended. The common use of gill-nets and pots in the Gulf of Oristano must be strictly regulated and controlled in order to minimize their mechanical impact on P. nobilis as observed by Ayaz et al. (Reference Ayaz, Acarli, Altinagac, Ozekinci, Kara and Ozen2006) along the Turkish coast. Moreover, the prohibition of these fishing gears must be taken into account where the population is abundant, at least within the MPA and SCI limits. Furthermore, it is essential to promote an awareness campaign and steady patrolling of the area in order to prevent illegal catching of the largest individuals and the use of forbidden fishing methods, like trawl-nets, which have the potential to remove a conspicuous fraction of population (Hall-Spencer et al., Reference Hall-Spencer, Froglia, Atkinson and Moore1999).
A deeper scientific knowledge of the ecological traits of P. nobilis and a long-term monitoring study are necessary in order to improve management measures for the preservation of this species in the Gulf of Oristano.
ACKNOWLEDGEMENTS
We wish to thank F. Wrachien and A. Satta for field assistance. and A. Chinellato for statistical advice. We are grateful to P. Domenici for his suggestions during the preparation of the manuscript and M. Sinerchia for his help with the English text. This research was funded by the Interreg IIIB Medocc–AMPAMED (2005-05.4.1-F-150) project.


