INTRODUCTION
Food webs encompass various food chains which structure marine communities. Variations in the relative importance of one component of a food chain (from nutrients to predators) may change abundances of the different species that are part of the food web (Friedlander & DeMartini, Reference Friedlander and DeMartini2002; Smith et al., Reference Smith, Hunter and Smith2010). Coral reefs are a habitat for numerous species and provide various ecological goods and services (Moberg & Folk, Reference Moberg and Folk1999). Consequently, knowing the food web functioning of these habitats is critical for their management.
Coral reefs were formerly considered as food webs isolated in an oceanic desert. The surrounding ocean, however, is also an important food source for coral reefs, as oceanic zooplankton may be imported into the reef by waves and tidal currents, and then consumed by planktivorous teleosts (Hamner et al., Reference Hamner, Jones, Carleton, Hauri and Williams1988, Reference Hamner, Colin and Hamner2007). While benthic sources represent an important carbon source to reef teleosts (Carassou et al., Reference Carassou, Kulbicki, Nicola and Polunin2008; Wyatt et al., Reference Wyatt, Waite and Humphries2012; Briand et al., Reference Briand, Bonnet, Guillou and Letourneur2016), numerous species rely principally or exclusively on planktonic sources for food (Hobson, Reference Hobson1974; Frédérich et al., Reference Frédérich, Fabri, Lepoint, Vandewalle and Parmentier2009) and even non-planktivorous species may rely on oceanic productivity (Wyatt et al., Reference Wyatt, Waite and Humphries2012). Barrier reefs act as border zones between oceanic and lagoon areas, leading to differences in habitat conditions (Delesalle & Sournia, Reference Delesalle and Sournia1992; Leichter et al., Reference Leichter, Alldredge, Bernardi, Brooks, Carlson, Carpenter, Edmunds, Fewings, Hanson, Hench, Holbrook, Nelson, Schmitt, Toonen, Washburn and Wyatt2013) and community composition (Carleton & Doherty, Reference Carleton and Doherty1998; Lecchini et al., Reference Lecchini, Adjeroud, Pratchett, Cadoret and Galzin2003; Leichter et al., Reference Leichter, Alldredge, Bernardi, Brooks, Carlson, Carpenter, Edmunds, Fewings, Hanson, Hench, Holbrook, Nelson, Schmitt, Toonen, Washburn and Wyatt2013). Marked differences between food webs could thus be expected (Wyatt et al., Reference Wyatt, Waite and Humphries2012; Briand et al., Reference Briand, Bonnet, Goiran, Guillou and Letourneur2015), as an indicator of water retention (Leichter et al., Reference Leichter, Alldredge, Bernardi, Brooks, Carlson, Carpenter, Edmunds, Fewings, Hanson, Hench, Holbrook, Nelson, Schmitt, Toonen, Washburn and Wyatt2013) and of separation between neighbouring outer slope and lagoon communities.
Stable isotope analyses are commonly being used in food web studies. They offer a basis for studying food web components as stable isotope composition can be measured in most organisms, including photosynthetic ones, as well as in organic particles (e.g. Davenport & Bax, Reference Davenport and Bax2002; Carassou et al., Reference Carassou, Kulbicki, Nicola and Polunin2008). Carbon isotopic composition (δ13C) is generally used to determine the baseline sources of carbon in food webs (Michener & Kaufman, Reference Michener, Kaufman, Michener and Lajtha2007; Briand et al., Reference Briand, Bonnet, Goiran, Guillou and Letourneur2015) because of the differences in stable isotope composition generally observed between the different types of primary producers (phytoplankton, phytobenthos) or organic matter and the low enrichment in 13C (0.5–1‰) in organisms relative to their diet (DeNiro & Epstein, Reference DeNiro and Epstein1978; Michener & Kaufman, Reference Michener, Kaufman, Michener and Lajtha2007). Nitrogen isotopic composition (δ15N) is used to estimate the trophic level of consumers, as organisms are generally enriched in 15N (~3.4‰ on average) relative to their diet (DeNiro & Epstein, Reference DeNiro and Epstein1981; Schoeninger & DeNiro, Reference Schoeninger and DeNiro1984; Michener & Kaufman, Reference Michener, Kaufman, Michener and Lajtha2007) although important variations of the trophic enrichment from prey to predators occur (Wyatt et al., Reference Wyatt, Waite and Humphries2010). Furthermore, spatial and temporal variations of δ13C and δ15N in the baseline sources of food webs and organisms (e.g. Harmelin-Vivien et al., Reference Harmelin-Vivien, Loizeau, Mellon, Beker, Arlhac, Bodiguel, Ferraton, Hermand, Pillippon and Salen-Picard2008; Veit-Köhler et al., Reference Veit-Köhler, Guilini, Peeken, Quillfeldt and Mayr2013) may help to identify feeding areas (Hobson, Reference Hobson1999).
In this study, the planktonic food chain of the south-western New Caledonian coral reef environment was investigated by analysing C and N stable isotope ratios in particulate organic matter, two size classes of zooplankton and four trophic groups of teleosts. The chosen study area was the Ouano lagoon. Most studies on reef food webs of New Caledonia using stable isotopes were conducted in the Nouméa lagoon (e.g. Carassou et al., Reference Carassou, Kulbicki, Nicola and Polunin2008; Briand et al., Reference Briand, Bonnet, Guillou and Letourneur2016) but the Ouano lagoon has not been studied, to our knowledge. Furthermore, analysis of the isotopic signatures of different size classes of plankton has not been done before on New Caledonian coral reefs. The aims of this study were (1) to identify the pathways of organic matter from sources to demersal zooplanktivorous teleosts through stable isotope analysis, (2) to compare the architecture of the two identified food chains between lagoon and outer slope assemblages.
MATERIALS AND METHODS
Study area
The Ouano lagoon (south-west of New Caledonia, Pacific Ocean; Figure 1) is delimited by a large barrier reef and comprises several islets and intermediate reefs within the lagoon, i.e. coral reefs located in the middle of the lagoon between the coastline and the barrier reef. It is connected to the external ocean by the St-Vincent pass (southern passage) and the Isié pass (northern passage). It has a mean depth of 10 m. Previous studies have shown that water circulation in the Ouano lagoon is driven by both tide and waves (Chevalier et al., Reference Chevalier, Devenon, Rey, Yellowlees and Hughes2012, Reference Chevalier, Sous, Devenon, Pagano, Rougier and Blanchot2015): inward and outward flows of water through the passes occur during the flood and the ebb respectively. Oceanic water may also enter into the lagoon by going over the barrier reef during high wave events. The path of the lagoon water can be determined by the method of water origin (de Brye et al., Reference de Brye, de Brauwere, Gourgue, Delhez and Deleersnijder2013), with the numerical hydrodynamic model developed and validated in Chevalier et al. (Reference Chevalier, Sous, Devenon, Pagano, Rougier and Blanchot2015). This method highlights that water near the barrier reef inside the lagoon is predominantly coming from the outer slope (Figure 1).
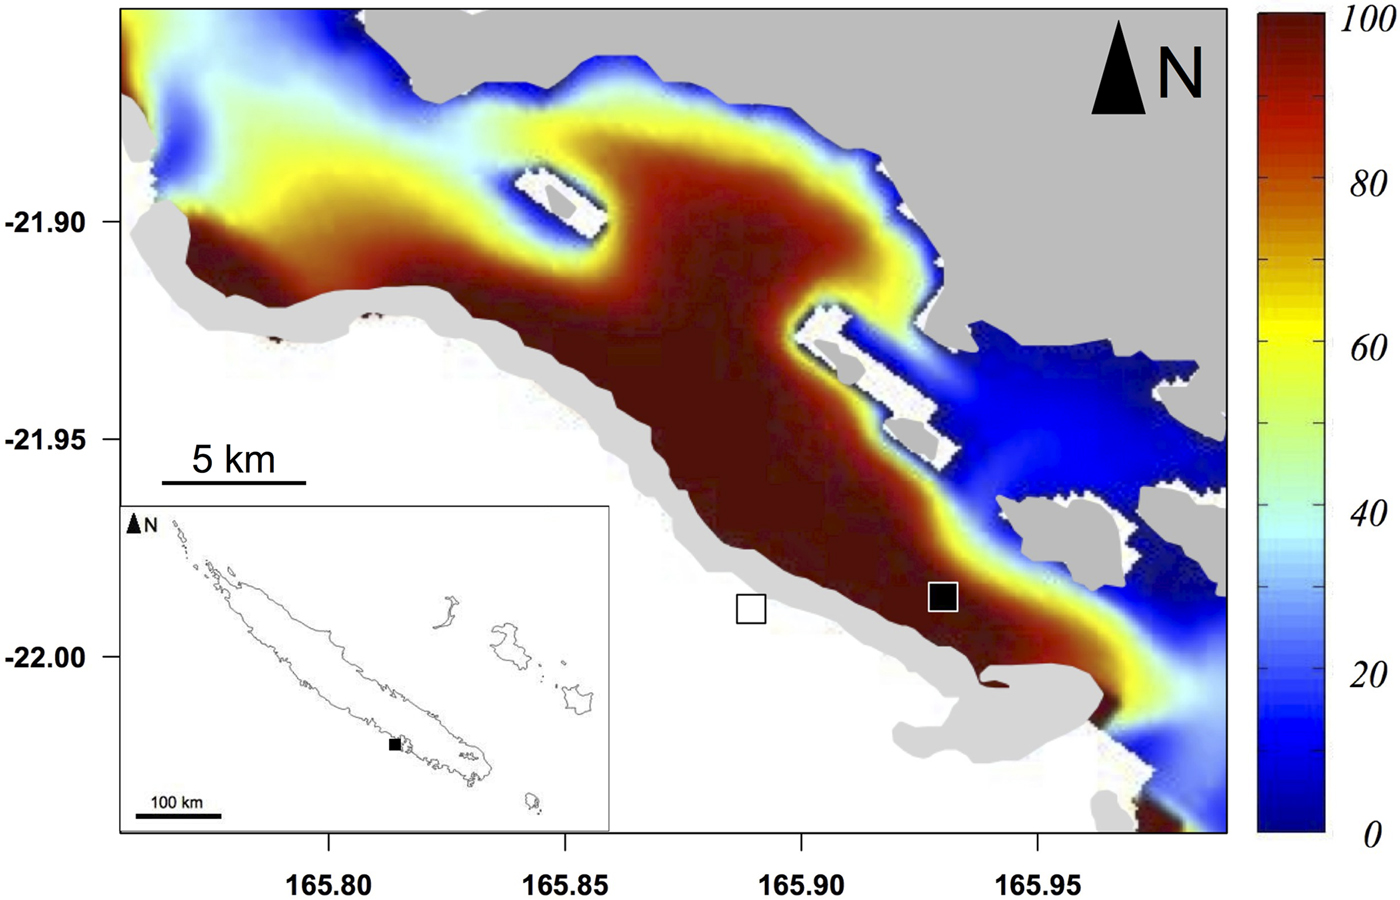
Fig. 1. Sampling area (light grey: reefs) of particulate organic matter (POM) and zooplankton and sampling stations of teleosts inside the Ouano lagoon (black square) and on the outer slope (white square). Colours represent the percentage of water coming from the outer slope in the Ouano lagoon with a wave height of 0.3 m, i.e. the mean wave height during the sampling campaign.
Sampling
Sampling was performed within the lagoon at ~2–3 m depth and on the outer slope at ~10–15 m depth from 2–9 October 2013. Particulate organic matter (POM) was considered as the baseline of the studied food chain as it included phytoplankton and other edible particles such as mucus, faeces and phytobenthos debris (Wyatt et al., Reference Wyatt, Lowe, Humphries and Waite2013). POM was obtained by sampling and filtering seawater on pre-combusted (500°C, 2 h) GF/F filters (N = 25). These filters were dried (60°C, 48 h) prior to subsequent analysis. Zooplankton was sampled at ~330 m on the outer slope and ~4 m in the lagoon and was sampled horizontally to obtain more biomass, by using an 80 µm mesh-sized WP2 net (N = 3). Zooplankton samples were separated into two size classes (80–200 and ≥200 µm) using sieves and then freeze-dried. Teleosts were opportunistically collected using 7% rotenone or by spearfishing inside the lagoon and on the outer slope (Figure 1) and then were frozen. In the laboratory, species were identified and classified in trophic groups according to the origin of their food given in the literature (Supplementary Table S1 in the supplemental material section): diurnal planktivorous teleosts feeding on pelagic plankton; nocturnal planktivorous teleosts feeding at night; non-planktivorous teleosts feeding on benthic prey (phytobenthos, sessile and/or mobile invertebrates) and teleosts with a mixed diet feeding on both pelagic and benthic food (e.g. consumption of both phytobenthos and planktonic crustaceans). Total length (TL) was measured. Digestive tracts of teleosts were removed and preserved in 95° ethanol. Anterior dorsal muscles of teleosts were sampled and freeze-dried for subsequent stable isotope analyses.
Stable isotope analysis
Zooplankton and teleost samples were ground into a fine powder. Carbonates present in POM and zooplankton (i.e. crustacean carapaces, mollusc shells) are more enriched in 13C than other tissues (DeNiro & Epstein, Reference DeNiro and Epstein1978). Consequently, analyses were carried out separately for measurements of δ13C and δ15N values. For δ13C measurements, one half of POM samples and one half of each zooplankton sample received 1% HCl treatment before being rinsed and dried to remove carbonates (Kennedy et al., Reference Kennedy, Kennedy and Papadimitriou2005; Jaschinski et al., Reference Jaschinski, Hansen and Sommer2008; Kolasinski et al., Reference Kolasinski, Rogers and Frouin2008). For δ15N measurements, the rest of the raw samples was analysed without acidification as acidification may affect nitrogen isotopic composition (Bunn et al., Reference Bunn, Loneragan and Kempster1995; Kennedy et al., Reference Kennedy, Kennedy and Papadimitriou2005; Kolasinski et al., Reference Kolasinski, Rogers and Frouin2008). Six replicates were analysed per station for POM and per zooplankton sample (three for δ13C, three for δ15N). For teleosts, a maximum of nine individuals (three individuals selected in three size classes) per species available were selected for stable isotope analysis. Lipid removal or correction for δ13C values was not necessary as levels of lipids in teleosts were low (C/N < 3.5) (Post et al., Reference Post, Layman, Arrington, Takimoto, Quatrochi and Montana2007; Skinner et al., Reference Skinner, Martin and Moore2016).
Powdered samples were precisely weighed (~0.4 mg for non-acidified zooplankton and teleosts; 1 mg for non-acidified POM and 2 mg for acidified POM and zooplankton; precision of 0.01 mg) in 5 × 8 tin cups (6 cups per station for POM and per zooplankton sample), and analysed with an elemental analyser (Flash EA 1112, Thermo Scientific, Milan, Italy) coupled to a continuous-flow isotope-ratio mass spectrometer (Delta V Advantage with a Conflo IV interface, Thermo Scientific, Bremen Germany). Analyses were conducted at the LIENSs stable isotope facility at the University of La Rochelle, France. δ13C and δ15N values are expressed in δ notation in ‰ as deviations from standards (Vienna Pee Dee Belemnite for δ13C and N2 in air for δ15N) according to the formula δX sample = [(R sample/R standard) − 1] × 1000, where X is 13C or 15N, R sample is the isotopic ratio of the sample and R standard is the isotopic ratio of the standard. Calibration was done using reference materials (USGS-24, IAEA-CH6, -600 for carbon; IAEA-N2, -NO-3, -600 for nitrogen). Analytical precision was <0.15‰ based on the analyses of acetanilide (Thermo Scientific) used as laboratory internal standard.
Stomach content analysis
Stomach contents of teleosts from the outer slope were analysed and the food items were identified to the lowest feasible taxonomic level. A technical failure prevented the analysis of the stomach contents of teleosts sampled inside the lagoon. Dry weight (DW) of ingested organisms was measured or estimated from data or mathematical formulas available in the literature (e.g. Uye, Reference Uye1982; Chisholm & Roff, Reference Chisholm and Roff1990; Satapoomin, Reference Satapoomin1999). Consequently, for some prey, total length and cephalosome length were measured to estimate DW. Food composition was expressed by frequency of occurrence (%O; percentage of non-empty stomachs containing a given prey item), numerical percentage (%N; mean percentage per stomach of the number of a given prey item as a proportion of the total number of all prey in each stomach), weight percentage (%W; mean percentage per stomach of the weight of a given prey item as a proportion of the total weight of all prey in each stomach). The index of relative importance (IRI; Pinkas et al., Reference Pinkas, Oliphant and Iverson1971) for each prey item was then calculated according to the formula IRI = %O × (%N + %W), and then transformed into percentage by dividing it by the sum of IRI for all prey items (%IRI; Cortés, Reference Cortés1997).
Data analysis
Data analyses were performed with the R statistical software (version 2.15.0; R core team, 2013). Isotopic compositions were analysed separately on POM, zooplankton and teleosts.
Differences in δ13C and δ15N values in POM inside the lagoon and on the outer slope were compared with Student's t-tests as data were normally distributed. After checking normality of residuals (Shapiro test) and homoscedasticity (Levene test), type III ANOVA were performed to compare δ13C and δ15N values among the fixed factors sampling zones (lagoon and outer slope) and size classes of zooplankton (80–200 and ≥200 µm). Both factors were orthogonal with each other.
For teleosts, after checking normality of residuals (Shapiro test) and homoscedasticity (Levene test), type III ANCOVA were performed to compare δ13C and δ15N values among the fixed factors trophic groups (diurnal planktivorous; nocturnal planktivorous; non-planktivorous and mixed diet) and sampling zones (lagoon and outer slope), with total body length as a co-variable to account for any size effect. Both factors were however not orthogonal with each other. Consequently, post hoc Games–Howell tests were performed if trophic groups had a significant effect on isotopic ratios. Hierarchical clustering (Euclidean distance, Ward method) was also performed to compare isotopic ratios among species. Trophic levels of the different trophic groups of teleosts were calculated using the formula proposed by Post (Reference Post2002): Trophic level = 2 + (δ15Ntrophic group − δ15NZoo≥200)/3.4. δ15Ntrophic group is the mean δ15N value of the trophic group considered in the lagoon or on the outer slope. δ15NZoo≥200 is the mean δ15N value in the zooplankton larger than 200 µm sampled in the lagoon or on the outer slope. δ15N value in the zooplankton larger than 200 µm was chosen as stomach contents showed that teleosts fed mainly on prey larger than 200 µm (mean ± SD = 1016.3 ± 0.7 µm).
RESULTS
POM had a lower δ13C on the outer slope (mean ± SD = −22.5 ± 0.4‰) than inside the lagoon (−21.0 ± 1.5‰) (t = −2.814, P = 0.020) but δ15N values did not significantly differ between the two zones (t = −0.639, P = 0.534) (Figure 2, Table 1).

Fig. 2. Means and standard deviations of δ13C and δ15N in the different groups of organisms inside the Ouano lagoon (black squares) and on the outer slope (white squares). SZ: 80–200 µm zooplankton; LZ: >200 µm zooplankton; Pk: diurnal planktivorous teleosts; Noc: nocturnal planktivorous teleosts; NPk: non-planktivorous teleosts; Mx: teleosts with a mixed diet.
Table 1. δ13C and δ15N values (mean ± SD, ‰) of the trophic groups and species of teleosts.
In zooplankton, δ13C values were not influenced by size class but were significantly lower on the outer slope (−20.4 ± 0.3‰) than inside the lagoon (−19.0 ± ≥0.0‰) (Figure 2, Tables 1 and 2(a)). For δ15N values, there was a significant interaction between size class and zone, with higher values for small zooplankton inside the lagoon and for large zooplankton on the outer slope (Figure 2, Tables 1 and 2(b)).
Table 2. Influence of size class (smaller or larger than 200 µm) and zone of sampling (interior, outer slope) on (a) δ13C and (b) δ15N values of zooplankton.

Bold results are significant.
ANCOVA results (Table 3(a)) showed that the interaction between sampling zone and trophic group influenced δ13C values. This just significant interaction showed that the effect of the lagoon was slightly more important in some teleost trophic groups, but, as for POM and zooplankton, teleosts of all groups sampled on the outer slope had lower δ13C (−17.9 ± 1.2‰) than those sampled in the lagoon (−14.8 ± 2.4‰). The trophic group also influenced δ13C but Figure 2 shows that trophic groups have rather similar values on the outer slope and more different ones inside the lagoon, in accordance with the interaction between the trophic groups and the sampling zone. Length had no effect on δ13C.
Table 3. Influence of trophic group (diurnal planktivorous, nocturnal planktivorous, non-planktivorous and mixed diet) and zone of sampling (interior, outer slope) on (a) δ13C and (b) δ15N values of teleosts.

Bold results are significant.
ANCOVA results (Table 3(b)) showed that δ15N values were not influenced by the interaction between sampling zone and trophic group. There were also no significant difference in mean δ15N values between teleosts sampled inside the lagoon (8.3 ± 0.6‰) and those sampled on the outer slope (8.5 ± 0.5‰). The trophic group influenced δ15N values with diurnal planktivorous being the most 15N-enriched teleosts among all trophic groups (4.374 ≤ t ≤ 5.552; P < 0.01) while the δ15N values of nocturnal planktivorous teleosts, non-planktivorous teleosts and teleosts with a mixed diet are not significantly different (0.737 ≤ t ≤ 51.842; P > 0.05). Length had a nearly significant effect on δ15N because of increasing values of δ15N with length in nocturnal planktivorous teleosts sampled inside the lagoon and non-planktivorous teleosts.
The cluster analysis on isotopic values (Figure 3) indicated that trophic group and zone of sampling influenced isotopic values in teleosts, as highlighted by the ANCOVA results. Three clusters appeared. The first one contained essentially non-planktivorous teleosts, including all those sampled inside the lagoon, but also contained a sub-cluster of nocturnal species. The second cluster contained only nocturnal species with a high δ13C. The last cluster contained nearly all diurnal planktivorous species and is divided into two sub-clusters, one containing almost exclusively diurnal planktivorous teleosts sampled on the outer slope.
Fig. 3. Cluster analyses (Euclidean distance) of δ15N and δ13C in teleost species sampled inside the Ouano lagoon (bold text) and on the outer slope. Pk: diurnal planktivorous teleosts; NPk: non-planktivorous teleosts; Mx: teleosts with a mixed diet; Noc: nocturnal teleosts.
Diurnal planktivorous teleosts had the highest trophic level (3.29 in the lagoon and 3.24 on the outer slope), followed by the nocturnal planktivorous (3.15 in the lagoon and 3.24 on the outer slope), the non-planktivorous (2.97 in the lagoon and 3.06 on the outer slope) and the teleosts with a mixed diet (3.03 in the lagoon and 2.97 on the outer slope).
Stomach contents of teleosts sampled on the outer slope are summarized in Supplementary Table S2. Diurnal planktivorous teleosts fed on gastropod larvae (%IRI = 32.50), phytobenthos (%IRI = 23.07) and various copepod species (%IRI = 20.67). The importance of phytobenthos for this group is explained by the consumption of this food by Genicanthus watanabei (%IRI = 84.55), which constitutes ~ a quarter of stomach contents of analysed planktivorous teleosts on the outer slope, while consumption of phytobenthos was negligible in the other planktivorous species (%IRI < 5). Non-planktivorous teleosts fed on phytobenthos (%IRI = 45.41), polyps (%IRI = 19.24), benthic gastropods (%IRI = 13.79) and eggs (%IRI = 10.03). The number of analysed individuals, however, was rather low (Supplementary Table S2). Nocturnal planktivorous teleosts and teleosts with a mixed diet were both represented by a single species (Ostorhinchus angustatus and Pomacentrus brachialis respectively) and few individuals (N = 1 and N = 2, respectively). Their diet was composed of five amphipods (%IRI = 83.19) and one small shrimp (%IRI = 16.81) for Ostorhinchus angustatus and of copepods (mainly the genus Oncaea and Clauso/Paracalanus, %IRI = 50.68), gastropod larvae (%IRI = 18.14) and Rhabdonema diatoms (%IRI = 18.06) for Pomacentrus brachialis.
DISCUSSION
Differences and similarities between two neighbouring food chains
Stable isotope analysis revealed that both food chains sampled in the Ouano lagoon and on the outer slope are distinguishable despite being close to each other (less than 10 km) and despite an important part of the water in the lagoon coming from the outer slope. For each trophic compartment (i.e. POM, zooplankton size classes and different teleost trophic groups), δ13C values were significantly higher in the lagoon than on the outer slope despite both areas being close (less than 10 km) while δ15N was not influenced by the sampling zone.
Differences in δ13C values between the lagoon and the outer slope may be explained by two hypotheses regarding POM composition. Firstly, δ13C values may be linked to potential differences in primary producer compositions between these two zones, namely by differences within picocyanobacteria assemblages that are important components in the oligotrophic ocean. In the Nouméa lagoon (~60 km south-east of Ouano lagoon), Prochlorococcus was shown to be dominant in oceanic waters, while Prochlorococcus and Synechococcus co-occur in the lagoon (Jacquet et al., Reference Jacquet, Delesalle, Torréton and Blanchot2006). Differences in δ13C values linked to potential co-existence of Prochlorococcus and Synechococcus in the Ouano lagoon seem to indicate that water exchanges between lagoon and ocean do not lead to the homogenization of the community structure of phytoplankton at a large spatial scale because of quick renewal of water inside the Ouano lagoon and grazing of imported picophytoplankton by coral reef community (Houlbrèque et al., Reference Houlbrèque, Delesalle, Blanchot, Montel and Ferrier-Pagès2006; Cuet et al., Reference Cuet, Atkinson, Blanchot, Casareto, Cordier, Falter, Frouin, Fujimura, Pierret, Susuki and Tourrand2011). Therefore, few picophytoplankton cells may be imported from the bordering ocean inside the lagoon by water passing over the reef. Further studies on phytoplankton communities of the Ouano lagoon may confirm this hypothesis.
Secondly, different contributions of materials (mucus, faeces, zooplankton, marine photosynthetic organism debris, barrier reef erosion debris) to POM among sites may explain the differences in δ13C values between the lagoon and the outer slope (Wyatt et al., Reference Wyatt, Lowe, Humphries and Waite2013; Briand et al., Reference Briand, Bonnet, Goiran, Guillou and Letourneur2015). Wyatt et al. (Reference Wyatt, Lowe, Humphries and Waite2013) observed that allochthonous phytoplankton mainly contributed to POM near the reef crest at Ningaloo Reef (~40–75%), while inside the lagoon autochthonous releases, i.e. detritus, mainly contributed to POM despite phytoplankton contribution remaining important (~20–25%). Detritus may include, for example, sedimentary matter resuspended by cross-reef flows (Chevalier et al., Reference Chevalier, Sous, Devenon, Pagano, Rougier and Blanchot2015), phytobenthos debris and coral mucus (Wyatt et al., Reference Wyatt, Lowe, Humphries and Waite2013), and are known to be more enriched in 13C than phytoplankton (Wyatt et al., Reference Wyatt, Lowe, Humphries and Waite2013; Briand et al., Reference Briand, Bonnet, Goiran, Guillou and Letourneur2015).
Similar results were found at Ningaloo Reef, Western Australia, where δ13C values of POM were lower on the outer slope than in the lagoon while no spatial variations of δ15N occurred (Wyatt et al., Reference Wyatt, Lowe, Humphries and Waite2013). In contrast, the inverse phenomenon was observed in two neighbouring bays of Moorea Island (French Polynesia), with δ13C values of POM decreasing from the entrance of the bays to the coastal areas (Letourneur et al., Reference Letourneur, Lison de Loma, Richard, Harmelin-Vivien, Cresson, Banaru, Fontaine, Gref and Planes2013). This difference may be explained by the lack of river inputs in the Ouano lagoon and the Ningaloo Reef (Wyatt et al., Reference Wyatt, Waite and Humphries2012, Reference Wyatt, Lowe, Humphries and Waite2013) while the two bays of Moorea island are subjected to river inputs reducing δ13C of POM (Letourneur et al., Reference Letourneur, Lison de Loma, Richard, Harmelin-Vivien, Cresson, Banaru, Fontaine, Gref and Planes2013).
Spatial variations of stable isotope values in zooplankton followed the same trend as in POM. Higher or similar densities of zooplankton were observed in lagoons of New Caledonia than on outer slopes, with highest densities observed in coastal areas (Champalbert, Reference Champalbert1993). Planktivorous teleosts, however, are known to form a ‘wall of mouths’ over reef flats that reduce the density and biomass of zooplankton entering lagoons (Hamner et al., Reference Hamner, Jones, Carleton, Hauri and Williams1988, Reference Hamner, Colin and Hamner2007). Consequently, zooplankton in the Ouano lagoon may be mainly reef-produced. As a result, differences of zooplankton composition between the lagoon and the outer slope may occur (Champalbert, Reference Champalbert1993; Hamner et al., Reference Hamner, Colin and Hamner2007), contributing to stable isotope values differentiation between the two communities. Differences of stable isotope ratios between zooplankton from the lagoon and from the outer slope may also be explained by differences of trophic ecology. Detritus in the POM of the lagoon can be used as food by organisms, including zooplankton (Gottfried & Roman, Reference Gottfried and Roman1983; Crossman et al., Reference Crossman, Choat, Clements, Hardy and McConochie2001; Dromard et al., Reference Dromard, Bouchon-Navaro, Cordonnier, Fontaine, Verlaque, Harmelin-Vivien and Bouchon2013). For example, Roman et al. (Reference Roman, Furnas and Mullin1990) showed that consumption of phytoplankton by reef zooplankton does not satisfy their daily nutritional requirements, leading reef zooplankton to also consume edible detritus such as mucus (Gottfried & Roman, Reference Gottfried and Roman1983). As a result, zooplankton in the lagoon and on the outer slope may exploit distinct food sources, i.e. differently composed POM, probably leading to their different δ13C values.
Trophic ecology of teleosts
The differences in δ13C values between lagoon and outer slope in teleosts were noticeable and consistent with the spatial variations observed in POM and zooplankton, indicating that δ13C values of teleosts are partially due to δ13C values of POM and zooplankton in their respective sampling area. Similar results were obtained at Ningaloo Reef (Wyatt et al., Reference Wyatt, Waite and Humphries2012), with increasing δ13C values in teleosts from the outer slope to the lagoon. In contrast, in Moorea Island, δ13C values of the teleost Steagastes nigricans decreased from the entrances of the bays to the coastal areas (Letourneur et al., Reference Letourneur, Lison de Loma, Richard, Harmelin-Vivien, Cresson, Banaru, Fontaine, Gref and Planes2013). This trend, however, follows the decreasing trend of δ13C values in POM across the bays. These results suggest that the sampled teleosts mostly rely on local food resources, and that migrations between lagoon and ocean are at best scarce. This hypothesis is consistent with their sedentary and even territorial behaviour, and the limited home range of most coral reef teleosts (Sale, Reference Sale1978; Ceccarelli, Reference Ceccarelli2007; Nash et al., Reference Nash, Welsh, Graham and Bellwood2015). As a result, higher contribution of reef-derived materials to the diet of teleosts, and thus higher δ13C values, are expected in the lagoon in the different trophic groups. This phenomenon was observed for the planktivorous teleost Amblyglyphidodon indicus in the Red Sea. On oceanic reefs (steep-walled pinnacles rising from deep water), analysis of stable isotope ratios in this planktivorous species revealed that it exploits a food chain with planktonic basal sources. On shelf reefs (situated on the continental shelf, in water between 25 and 60 m depth), although it still relied mainly on plankton-based food chains, this teleost appeared to also exploit a food chain based on phytobenthos (McMahon et al., Reference McMahon, Thorrold, Houghton and Berumen2016). As in other trophic compartments, δ15N values of teleosts did not differ between lagoon and outer slope and computed trophic levels appear to be similar. This result is consistent with the lack of spatial variations of δ15N values in POM and zooplankton but differs from the results at Ningaloo Reef where δ15N values of teleosts declined across the reef despite the lack of spatial variation of δ15N in POM (Wyatt et al., Reference Wyatt, Waite and Humphries2012, Reference Wyatt, Lowe, Humphries and Waite2013). By using Bayesian mixing models with zooplankton, phytobenthos and coral mucus as prey, Wyatt et al. (Reference Wyatt, Waite and Humphries2012) conclude that the contribution of zooplankton to the diet of teleosts decreased across the reef because of the rarity of oceanic zooplankton in the lagoon. Consequently, spatial variations of δ15N at least in the diurnal planktivorous teleosts would have been expected if the zooplankton contribution to their diet had declined from the ocean to the lagoon. Nevertheless, because densities of zooplankton are higher or similar in lagoons than in ocean in south-western New Caledonia (Champalbert, Reference Champalbert1993) and this zooplankton appears to be reef-produced, enough zooplankton may be available for planktivorous teleosts inside the lagoon. As a result, the absence of difference in δ15N values between teleosts of the lagoon and of the outer slope may reflect the absence of difference in δ15N values between zooplankton of the lagoon and of the outer slope.
δ13C and δ15N values differed significantly among trophic groups of teleosts. These differences, however, are the result of one trophic group having higher stable isotope values than the other ones (nocturnal planktivorous teleosts for δ13C and diurnal planktivorous teleosts for δ15N). The unusually high δ13C values of nocturnal planktivorous teleosts sampled inside the Ouano lagoon may be explained by the diets of several species. Indeed, Apogon exostigma, Cheilodipterus quinquelineatus and Ostorhinchus cyanosoma feed primarily on benthic prey, including small teleosts (Barnett et al., Reference Barnett, Bellwood and Hoey2006), that are generally enriched in 13C compared with POM (Briand et al., Reference Briand, Bonnet, Goiran, Guillou and Letourneur2015). Furthermore, the nocturnal emergence of zooplankton (Roman et al., Reference Roman, Furnas and Mullin1990) may also change δ13C values of zooplankton (Pitt et al., Reference Pitt, Clement, Connolly and Thibault-Botha2008), as the emerging organisms may rely on 13C-enriched sedimentary organic matter (Briand et al., Reference Briand, Bonnet, Goiran, Guillou and Letourneur2015) rather than on POM during daylight. Thus, the nocturnal emergence of zooplankton may influence δ13C values of their predators and upper trophic levels. In the lagoon, three species of sampled nocturnal planktivorous teleosts had isotopic compositions similar to those of non-planktivorous teleosts. Isotopic analyses on diurnal and nocturnal samples of zooplankton and POM should be carried out to confirm the existence of two different trophic pathways between day and night.
Stomach contents of the teleosts sampled on the outer slope indicated that several trophic groups may feed on similar prey. For example, Genicanthus watanabei fed mainly on phytobenthos like non-planktivorous teleosts. Such a phenomenon, already observed for the Genicanthus genus (Randall, Reference Randall1975; Howe, Reference Howe1993), may indicate that the trophic groups may have greater trophic plasticity or a less specific diet than indicated by stable isotopes. Further studies on the food web of the Ouano lagoon should also be done on stomach contents of teleosts sampled inside the lagoon in order to confirm the results presented here.
CONCLUSIONS
Differences in δ13C values between the lagoon and the outer slope show that the internal and external food chains are well differentiated between the Ouano Lagoon and the surrounding ocean, suggesting that exchanges of POM, phytoplankton and zooplankton between these biotopes are partially limited by the barrier reef and planktivorous teleosts. Nevertheless, previous studies showed that open ocean particles may still be a source of carbon for lagoon food webs and that water passing over the barrier reef may resuspend benthic particles inside the lagoon. These two combined phenomena may lead to the differentiation of composition and thus δ13C values of POM between the lagoon and the outer slope. Consistent differences in δ13C values between the lagoon and the outer slope in each trophic compartment indicate reliance on POM by the two food chains. Furthermore, while the planktonic food chain on the outer slope of the Ouano lagoon probably relies more on oceanic sources, the planktonic food chain in the lagoon may rely on both oceanic (imported particles) and benthic (mucus aggregates and resuspended particles) sources because of tidal and wave induced external inputs and autochthonous releases. Consequently, bentho-pelagic coupling may occur in the Ouano Lagoon. The lack of spatial differences in δ15N values of POM, zooplankton and teleosts, however, indicates a similar chain length in the lagoon and in the outer slope. Consequently, although distinguishable, the two food chains are similar.
The oceanic water typically passes over the barrier reefs in many lagoons. Consequently, this result is very likely to be generalizable on the general ecology of the trophic networks of many lagoons which are well separated from surrounding oceanic waters by a well delineated barrier reef.
SUPPLEMENTARY MATERIAL
The supplementary material for this article can be found at https://doi.org/10.1017/S0025315417001370
ACKNOWLEDGEMENTS
We would like to thank Claude Payri, for her welcome at the IRD centre of New Caledonia, and Pierre Labrosse and Olivier Boittiaux (High Commissioner of the Republic in New Caledonia), for allowing access to sampling zones. Thanks are also expressed to Samuel Tereua, pilot of the inflatable boat Diodon, and to Clément Pigot for preparing the samples. We are grateful to Gaël Guillou for running the stable isotope analyses. We also thank Michael Paul for improvement of the English. We thank the anonymous reviewers for their helpful comments.
FINANCIAL SUPPORT
This work was funded by IRD for the M.I.O. Action Sud program.